 Open Access Article
Creative Commons Attribution 3.0 Unported Licence
Uncatalyzed reactions of 4,4′-diphenylmethane-diisocyanate with polymer polyols as revealed by matrix-assisted laser desorption/ionization mass spectrometry†
Tibor
Nagy
a,
Borbála
Antal
a,
Anita
Dékány-Adamoczky
a,
József
Karger-Kocsis
b,
Miklós
Zsuga
a and
Sándor
Kéki
*a
aDepartment of Applied Chemistry, University of Debrecen, Egyetem tér1, H-4032 Debrecen, Hungary. E-mail: keki.sandor@science.unideb.hu
bDepartment of Polymer Engineering, Budapest University of Technology and Economics, Műegyetem rkp. 3, H-1111 Budapest, Hungary
First published on 4th May 2016
Abstract
The uncatalyzed reactions of polyols including polypropylene glycol (PPG, Mn = 2000 g mol−1), polytetrahydrofuran (PTHF, Mn = 1000 g mol−1), poly(ε-caprolactone)-diol (PCLD, Mn = 2000 g mol−1) and polypropylene glycol glycerol triether (PPG_GL, Mn = 1000 g mol−1) with 4,4′-diphenylmethane-diisocyanate (MDI) were studied using matrix-assisted laser desorption/ionization time-of-flight mass spectrometry (MALDI-TOF MS). The reactions between these polyols and MDI were monitored in time and first-order consecutive reaction kinetics for the formations of polyols end-capped with MDI units were established. The fractional MALDI-TOF MS intensities obtained for the different polymer series at various reaction times were converted into molar fractions versus time data by means of the estimated relative MALDI-TOF MS response factors from which the corresponding rate constants and the relative reactivities of the hydroxyl groups of polyols were determined. It was found that the pseudo first-order rate constants for the polyol-MDI reaction decreased in the order of PCLD > PTHF > PPG ≈ PPG_GL. It was also ascertained that the reactivity of the unreacted hydroxyl groups of the diols does not change significantly after the first one has reacted. On the contrary, in the case of PPG_GL it was found that the reactions of the hydroxyl groups with MDI proceed faster after any of the three hydroxyl groups has reacted, suggesting a positive substitution effect for this system.
Introduction
Polyurethanes (PUs) are one of the most versatile classes of industrial polymers whose applications cover various important areas ranging from coatings through elastomers to different types of biomaterials.1–3 PUs have recently received considerable attention as shape-memory materials.4–6 The production routes to PUs are based on the addition reactions of isocyanates with functionalities of two or higher with different types of polyols. Proper selection of the isocyanate and the polyol components allows one to tailor the properties of the resulting PUs for various applications. Evidently, the reactions of the isocyanate group with the hydroxyl groups of polyols play an essential role in the synthesis of PUs. Thus, due to the practical importance of PUs, the catalyzed and uncatalyzed reactions of different isocyanates with alcohols under various experimental conditions have been extensively studied from the early ages of the polyurethane industry.7–10 The kinetic studies on this topic have primarily focused on the reactions of mono- and industrially important diisocyanates with monofunctional alcohols to obtain the reaction order for both the isocyanate and alcohol components and to establish the reaction mechanism.11–20 The kinetics of the reaction between diisocyanates and polyols and polymer polyols with functionalities of two or higher are also well-documented.21–37 In most of these investigations the reaction was monitored using, e.g., titration method,21,22 FT-IR spectroscopy,23–30 rheological measurements29,31 and size-exclusion chromatography (SEC).32 Moreover, when a diol has been reacted with isocyanate the reaction mixture at an intermediate reaction time will surely contain the unreacted diols, the diols with one reacted and diols with two reacted OH groups. Titration and spectroscopic methods such as FT-IR and UV spectroscopy are, in most cases, capable of determining only the fraction of the number of reacted isocyanate and/or OH groups. Thus, the above mentioned methods may not provide information on the distribution of the various species present in the reaction mixture. In addition, as the molecular weight of the polyol component is increased the concentration of the “spectroscopically active” groups is thereby reduced making both the qualitative and quantitative interpretations very difficult. On the contrary, due to the well-resolved peaks, mass spectrometric methods, and especially those based on soft-ionization such as matrix-assisted laser desorption/ionization mass spectrometry (MALDI MS)38 and electrospray ionization (ESI-MS),39 are capable of detecting various species (including those which have high molecular weights) present in the reaction mixture.In this article, we report a detailed MALDI-TOF MS investigations on the reactions of 4,4′-diphenylmethane-diisocyanate (MDI) with polymer polyols including polypropylene glycol (PPG), polytetrahydrofuran (PTHF), polycaprolactone diol (PCLD) and a triol polypropylene glycol glycerol triether (PPG_GL, Rokopol G1000). The goals of this study were to gain information on the distributions of the intermediates and products formed during the reaction and to determine the reactivities of the hydroxyl groups of polymeric polyols. To the best of our knowledge such kind of investigation has not been reported yet.
Experimental
Chemicals
4,4′-Diphenylmethane-diisocyanate (MDI), polycaprolactone-diol (PCLD, Mn = 2000 g mol−1), toluene and tetrahydrofuran were received from Sigma-Aldrich (Taufkirchen, Germany). Polypropylene glycol (PPG, Mn = 2000 g mol−1) and polypropylene glycol glycerol triether (PPG_GL, Mn = 1000 g mol−1, Rokopol G1000) were obtained from BorsodChem (Kazincbarcika, Hungary) and PCC Rokita SA (Brzeg Dolny, Poland), respectively. Methanol and tetrahydrofurane were purchased from VWR International (Leuven, Belgium), respectively, and were used without further purification. Toluene was purified and dried according to the well-know procedure.40 Polymer polyols were dried at 50 °C in a vacuum oven for 48 hours.General procedure for performing the reactions of diisocyanates with alcohols
Into a flask of 5 mL, dry toluene (3 mL) and calculated amount of MDI were introduced under nitrogen atmosphere. The flask was thermostated at 80 °C. The reactions were started by addition of the calculated amount of the corresponding polymer polyols (PCLD or PPG or PTHF or PPG_GL) dissolved in toluene of 1 mL. The reaction mixture was further diluted with toluene to obtain a reaction volume of 5 mL. The initial concentrations of MDI and the polymer polyols were 0.32 M and 0.01 M, respectively. For the MALDI-TOF MS investigations, after predetermined time intervals, samples of 100 μL were taken out from the reaction mixture and added to a mixture of methanol/tetrahydrofuran (2![[thin space (1/6-em)]](https://www.rsc.org/images/entities/char_2009.gif) :
:![[thin space (1/6-em)]](https://www.rsc.org/images/entities/char_2009.gif) 1 v/v) to quench the unreacted isocyanate groups.
1 v/v) to quench the unreacted isocyanate groups.
Determination of the primary and secondary hydroxyl group content of PPG based samples
The primary and secondary group contents of PPG and PPG_GL samples were determined similarly to the method published in the literature.41,42 Samples of 50–100 mg were dissolved in CDCl3 of 500 μL to which trifluoroacetic anhydride in a 10-fold molar excess was added. After 3 hours reaction time the solutions were analyzed by 1H-NMR. The primary and the secondary group contents were calculated using the integrals of proton signals at 4.2 ppm, characteristics of –CH(CH3)–CH2–OCOCF3 and, at 5.2 ppm originating from –CH2–CH(CH3)OCOCF3.Matrix-assisted laser desorption/ionization time-of-flight mass spectrometry (MALDI-TOF MS)
The MALDI-TOF MS measurements were performed with a Bruker BIFLEX III™ mass spectrometer equipped with a time-of-flight (TOF) mass analyzer. In all cases 19 kV acceleration voltage was used with pulsed ion extraction (PIE™). The positive ions were detected in the reflectron mode (20 kV). A nitrogen laser (337 nm, 3 ns pulse width, 106 to 107 W cm−2) operating at 4 Hz was used to produce laser desorption and 300 shots were summed. The MALDI-TOF MS spectra were externally calibrated with poly(ethylene glycol)s (Mn = 1450 g mol−1 and Mn = 4000 g mol−1).Samples for MALDI-TOF MS were prepared with 2,5-dihydroxy benzoic acid (DHB) matrix dissolved in tetrahydrofuran at a concentration of 20 mg mL−1. Analyte samples were obtained by mixing 100 μL reaction mixture with methanol (400 μL) and tetrahydrofuran (200 μL) and sodium trifluoroacetate dissolved in tetrahydrofuran at a concentration of 5 mg mL−1 (used as the cationization agent to promote ionization). The solutions were mixed in a 10![[thin space (1/6-em)]](https://www.rsc.org/images/entities/char_2009.gif) :
:![[thin space (1/6-em)]](https://www.rsc.org/images/entities/char_2009.gif) 2
2![[thin space (1/6-em)]](https://www.rsc.org/images/entities/char_2009.gif) :
:![[thin space (1/6-em)]](https://www.rsc.org/images/entities/char_2009.gif) 1 (v/v) ratio (matrix/analyte/cationization agent). A volume of 0.5 μL of the solution was deposited onto a metal sample plate and allowed to air-dry.
1 (v/v) ratio (matrix/analyte/cationization agent). A volume of 0.5 μL of the solution was deposited onto a metal sample plate and allowed to air-dry.
Electrospray quadrupole time-of-flight mass spectrometry (ESI-QTOF MS)
The MS and MS/MS measurements were performed with a MicroTOF-Q type Qq-TOF MS instrument (Bruker Daltonik, Bremen, Germany) using an ESI source with positive ion mode. The sample solutions were introduced directly into the ESI source with a syringe pump (Cole-Parmer Ins. Co., Vernon Hills, IL, USA) at a flow rate of 3 μL min−1. The spray voltage was set to 4 kV. The temperature of the drying gas (N2) was kept at 180 °C. For the tandem MS measurements nitrogen was used as the collision gas and collision energies of 142 eV and 178 eV were applied (in the laboratory frame). The precursor ions for MS/MS were selected with an isolation width of 4 m/z units. The MS and MS/MS spectra were accumulated and recorded by means of a digitizer at a sampling rate of 2 GHz. The mass spectra were calibrated externally using the exact masses of the clusters generated from the electrosprayed solution of sodium trifluoroacetate (NaTFA). The recorded mass spectra were evaluated with the DataAnalysis 3.4 software from Bruker. Samples for the ESI-MS and ESI-MS/MS measurements were prepared using 10 μL of methanol-quenched reaction mixtures obtained at different reaction times and diluted with methanol to 1000 μL.Nuclear magnetic resonance spectroscopy (NMR)
1H-NMR spectra were recorded in CDCl3 at 25 °C on a Bruker AM 360 spectrometer at 360 MHz with tetramethylsilane as the internal standard.Evaluation of the kinetic measurements
The reaction steps of MDI with diols including PPG, PTHF and PCLD together with the products obtained after quenching the reaction mixture with methanol are depicted in Scheme 1.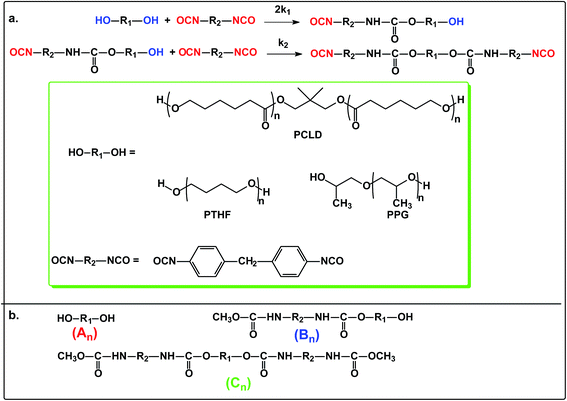 | ||
| Scheme 1 The reactions of polymer diols (PPG, PTHF and PCLD) with MDI (a) and the products obtained after quenching the reaction mixture by methanol (b). | ||
The MALDI-TOF MS intensities belonging to the corresponding oligomer series obtained on the quenched reaction mixture were summed and these intensities were used to calculate the fractional intensities (FAn, FBn and FCn) for series An, Bn and Cn as given by eqn (1)–(3).
 | (1) |
 | (2) |
| FCn = 1 − FAn − FBn | (3) |
Assuming linear relationship between the MALDI-TOF MS intensities and the concentrations of the corresponding oligomer series eqn (4)–(6) become as:
| IAn = fA[An] | (4) |
| IBn = fB[Bn] | (5) |
| ICn = fC[Cn] | (6) |
Using eqn (4)–(6), the molar fractions, i.e., XAn, XBn and XCn for series An, Bn and Cn can be given by eqn (7)–(9) as:
 | (7) |
 | (8) |
| XCn = 1 − XAn − XBn | (9) |
According to the reactions presented in Scheme 1: (i) assuming pseudo-first order rate dependence for the diols, and (ii) taking into account that each of the isocyanate groups and hydroxyl groups have the same reactivity due to symmetrical nature of the MDI and diols, the variation of the corresponding fraction of the oligomer series with time can be described by eqn (10)–(12)
| XAn(t) = e−4k1t | (10) |
 | (11) |
| XCn(t) = 1 − XAn(t) − XBn(t) | (12) |
The reaction steps of MDI with a triol, i.e., polypropylene glycol glycerol triether (PPG_GL, Rokopol G1000) and the products obtained after quenching the reaction mixture with methanol are shown in Scheme 2.
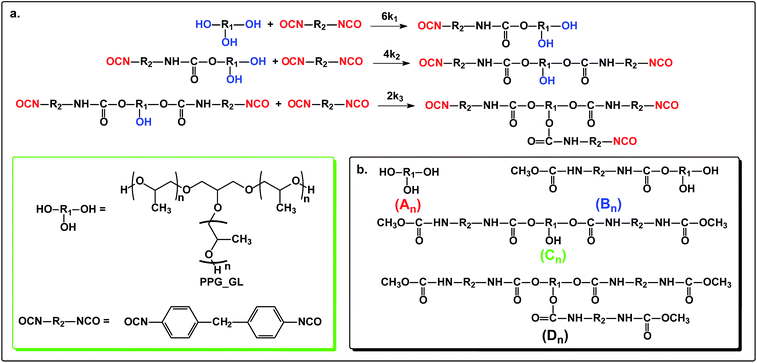 | ||
| Scheme 2 The reaction of polypropylene glycol glycerol triether (PPG_GL) with MDI (a) and the products obtained after quenching the reaction mixture by methanol (b). | ||
Similarly to the MDI-polymer diols system, the MALDI-TOF MS intensities belonging to the corresponding oligomer series obtained on the quenched reaction mixture were summed to calculate the fractional intensities for series An, Bn, Cn and Dn. Assuming linear relationships between the MALDI-TOF MS intensities and the concentrations of corresponding oligomer series, the molar fractions, i.e., XAn, XBn, XCn and XDn for series An, Bn, Cn and Dn (cf.Scheme 2b), respectively, can be given as:
 | (13) |
 | (14) |
 | (15) |
| XDn = 1− XAn − XBn − XCn | (16) |
Assuming pseudo-first order rate dependence for the polymer triol and equal reactivities for each of the isocyanate and hydroxyl groups, the change of the corresponding fraction of the oligomer series in time are given by eqn (17)–(20).
| XAn(t) = e−6k1t | (17) |
 | (18) |
 | (19) |
| XDn(t) = 1 − XAn(t) − XBn(t) − XCn(t) | (20) |
For fitting of the parameters of eqn (10)–(12) and (17)–(20) to the experimental kinetic data and thus to determine the corresponding rate constants a home-made parameter estimation software based the Gauss–Newton–Marquardt procedure was applied.43
Estimation of the relative MALDI-TOF MS response factors
Since no internal standards for the oligomer series are available either for the MDI-polymer-diol or for the MDI-polymer-triol reactions we have developed a method to estimate the relative MALDI-TOF MS response factors of the oligomer series with respect to series An. At different reaction times, i.e., at various product distributions, samples were taken out from the reaction mixtures and quenched with methanol similarly as described before. To each quenched samples, polyethylene glycol (PEG, Mn = 1450 g mol−1) or polypropylene glycol (Mn = 1000 g mol−1) were added as internal standard (reference). The intensities of the reference were compared to those of the different series, and the corresponding relative response factors were estimated by means of eqn (S1) and (S2) (ESI†) using multi regression analysis.Results and discussion
Reaction of polymer diols with MDI
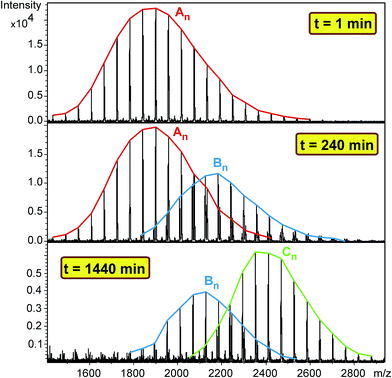
Polymer diols including polypropylene glycol (PPG, Mn = 2000 g mol−1), polytetrahydrofuran (Mn = 1000 g mol−1) and polycaprolactone diol (PCLD, Mn = 2000 g mol−1) were reacted with MDI in high molar excess to polymer diols in toluene at 80 °C. After predetermined time intervals, depending on the rates of reactions, samples were taken out of the reaction mixture, quenched with methanol and analyzed by MALDI-TOF MS. The MALDI-TOF MS spectra of the methanol-quenched reaction mixture obtained in the reaction of MDI with PPG are shown in Fig. 1.As seen in Fig. 1 the MALDI-TOF MS spectrum obtained at 1 min reaction time shows the presence of the starting PPG only. The m/z values of the members of series An cationized by sodium ions are in good agreement with those calculated for the PPG having two hydroxyl groups. For example, the measured and the calculated monoisotopic masses for the PPG with a number of propylene oxide (PO) units 32 are 1898.2 and 1898.3, respectively. As the reaction time is increased, series Bn begin to appear. The m/z value for Bn, e.g. with a number of PO units 32 is 2180.5 while the calculated value for this composition is 2180.4. Further increase in the reaction time resulted in the disappearance of the starting diol and the dominant presence of series Cn in which both hydroxyl groups have been reacted. In addition, by comparing the MALDI-TOF MS spectra shown in Fig. 1, it can also be concluded that the molecular weight distributions shifts stepwise by a mass of 282 Da from series An to Cn. Note that the nominal mass of an MDI plus a methanol unit is 282 Da. PPG with two diisocyanate end-groups have the same mass as those having an allophanate end-group, i.e., those of which obtained by the reaction of hydroxyl group diisocyanate followed by addition of a second diisocyanate unit to the urethane bond formed. Thus, in order to confirm the formation of PPG with two diisocyanate end-groups and to rule out the formation of allophanate bonds under the experimental conditions employed, additional experiments using electrospray ionization tandem mass spectrometry (ESI-MS/MS) were performed. For these ESI-MS/MS experiments several adduct ions, preferentially doubly charged sodiated adduct ions ([M + 2Na]2+) containing two MDI units were subjected to collision induced dissociation (CID) to obtain structural information on PPG with two diisocyanate groups. A representative ESI-MS/MS spectrum obtained by fragmentation of precursor ions with m/z 1213.7 is shown in Fig. 2.
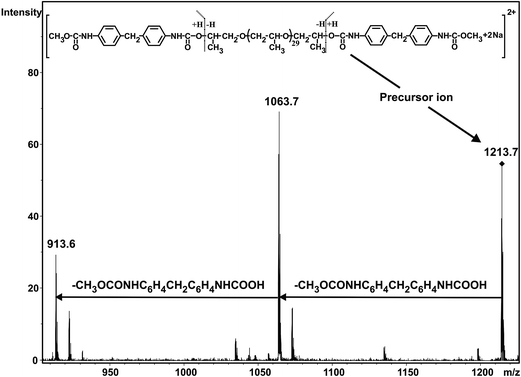 | ||
| Fig. 2 ESI-MS/MS spectrum of the [PPG + 2MDI + 2CH3OH + 2Na]2+ adduct ion with a number of repeat units of 31 (m/z 1213.7). The ESI-MS/MS spectrum was recorded at collision energy of 178 eV. | ||
Fig. 2 suggests that the main fragmentation pathway is the subsequent loss of two CH3OCONHC6H4CH2C6H4NHCOOH units from the precursor ion. The fact that these two units are eliminated is a clear indication of the presence of the diisocyanate end-groups, i.e., both hydroxyl groups of PPG have been reacted with diisocyanate.
Monitoring the MDI-polymer diols reaction in time and determining the composition of the reaction mixtures one can obtain information on the reactivity of the MDI towards the hydroxyl groups of polymer diols. The relative MALDI-TOF MS response factors were estimated experimentally using the procedure presented in the Experimental, and fA/fB ≈ fA/fC ≈ 1 was found. Similar observations were found for the other polymer diols (i.e., PTHF and PCLD) investigated. Changes in the molar fractions for series An, Bn and Cn with the reaction time are depicted in Fig. 3.
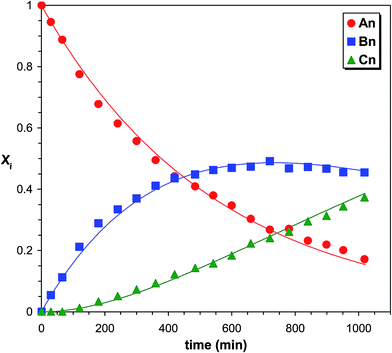 | ||
| Fig. 3 Variations of the product distributions with time in the PPG-MDI reaction determined by MALDI-TOF MS. The solid lines represent the fitted curves calculated by eqn (10)–(12). Experimental conditions: see Fig. 1 caption. | ||
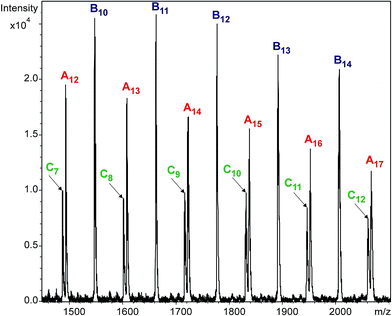
Variations of the molar fractions for An, Bn, and Cn in Fig. 3 reveal characteristic features of typical consecutive reactions. It should be noted, that no additional series can be detected with significant intensities. Fig. 4 shows the partial MALDI-TOF MS spectrum of the reaction products obtained in the reaction of MDI with PCLD.
As it turns out from Fig. 4, all the reaction products of the MDI-PCLD reaction, i.e., series An, Bn and Cn, are well-resolved. They can clearly be distinguished from one another, which allows us to depict the variation in the composition of the reaction mixture in time (Fig. 5).
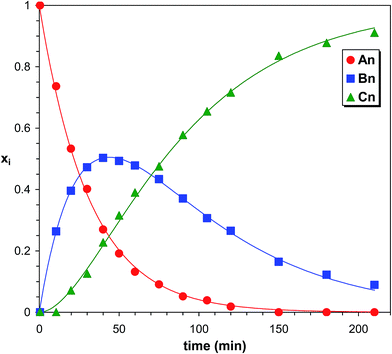 | ||
| Fig. 5 Product distributions versus time in the PCLD-MDI reaction determined by MALDI-TOF MS. The solid lines represent the fitted curves calculated by eqn (10)–(12). Experimental conditions: see Fig. 4 caption. | ||
The run of the Xiversus time traces is similar to those obtained in the MDI-PPG reaction. Similar kinetic curves were also obtained for the MDI-PTHF reaction, too (shown in the ESI as Fig. S1†).
In order to support the validity of the consecutive reactions presented in Scheme 1 and to determine the corresponding values of k1 and k2, eqn (10)–(12) were fitted to the experimental molar fraction versus reaction time data. The solid lines in Fig. 3 and 5 show the results of such fits. As seen in Fig. 3 and 5 the fitted curves match reasonable well the experimental data. The corresponding rate constants k1 and k2 are compiled in Table 1.
| Polymer diol | k 1 × 10⁴ (min−1) | k 2 × 10⁴ (min−1) |
|---|---|---|
| PPG | 4.6 ± 0.1 | 4.9 ± 0.2 |
| PTHF | 51 ± 1 | 59 ± 1 |
| PCLD | 80 ± 1 | 78 ± 2 |
Data in Table 1 indicate that PCLD and PTHF have similar reactivities towards MDI, while PPG reacts by almost one order of magnitude slower. Similar reactivities of PCLD and PTHF are most probably due to the presence of primary hydroxyl groups and relatively long carbon-chain-ends in both polymers. In contrast, the low reactivity of PPG can preferentially be ascribed to the secondary hydroxyl end-groups in PPG. It is well-known that secondary hydroxyl groups are less reactive than the primary ones.19,20 Thus, to confirm the presence of secondary hydroxyl end-groups in the PPG sample, the primary and the secondary hydroxyl group contents were determined according to a previously reported method.41,42 It was found that PPG contained ∼10% primary and ∼90% secondary hydroxyl end-groups. It is also evident from the data of Table 1 that the values of k1 are very close to those of k2, i.e., k2/k1 values are 1.06, 1.16 and 0.98 for PPG, PTHF and PCLD, respectively. This finding indicates that after either of the two hydroxyl groups has been reacted the reactivity of the remaining is not altered significantly, i.e., the absence of substitution effect. Another way to obtain data for the extent of substitution effect is to plot XBn as a function of XAn. This kind evaluation of kinetic data allows us not only to determine the values of k2/k1 but deviation from the statistically expected case, i.e., presence or absence of substitution effect, can easily be visualized over a wide range of XAn–XBn data. eqn (10)–(12) can easily be transformed into a time-independent relationship between XAn and XBn as shown by eqn (21) (the derivation of eqn (21) can be found in the ESI†).
 | (21) |
It follows from eqn (21) that the maximum value of XBn (XBn,max) can be given by eqn (22) as:
 | (22) |
It can also be deduced from eqn (22) that in the case of α = 0.5, i.e., in the absence of substitution effect, the value of XBn,max is 0.5.
In Fig. 6XBn as a function of XAn is presented for PPG, PTHF and PCLD.
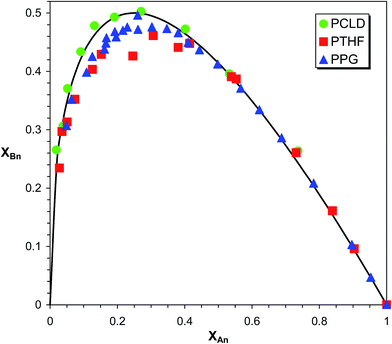 | ||
| Fig. 6 Variation of XBn as a function of XAn for PPG, PTHF and PCLD. The solid line show the theoretical curve for the case of α = 0.5. | ||
As it turns out from Fig. 6, the experimental XAnversus XBn values for PPG, PTHF and PCLD are very close to those calculated by eqn (21) with α = 0.5, supporting the absence of any significant substitution effect in the MDI-polymer diol reactions.
Reaction of polypropylene glycol glycerol triether (PPG_GL) with MDI
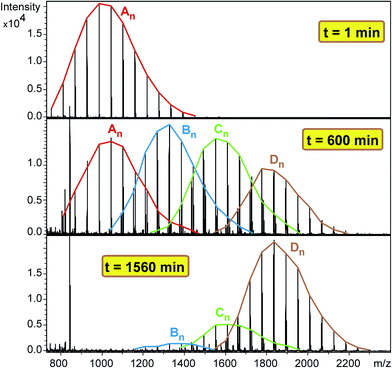
Similarly to the MDI-polymer-diol systems, the polymer-triol PPG_GL reacts in stepwise with MDI during the formation of series Bn, Cn and Dn as shown in Scheme 2. The formation of these series is evidenced by the MALDI-TOF MS spectra of the methanol-quenched reaction mixture recorded at different reaction times (Fig. 7).As seen in Fig. 7 after a short reaction time only the starting PPG_GL is present. However, at elapsed reaction time, the formation of series Bn, Cn and Dn can also be detected, while at very long reaction time the final product (series Dn) appears with the highest intensity. Furthermore, the masses of series increase by 282 Da from series An to Dn, corresponding to the subsequent additions of MDI molecules to the hydroxyl groups of PPG_GL. The ESI-MS/MS spectrum (shown in the ESI as Fig. S2†) on selected precursor ions from series Bn, Cn and Dn show consecutive losses of CH3OCONHC6H4CH2C6H4NHCOOH units. This confirms that the reaction of MDI with all of the three hydroxyl groups of PPG_GL took place and no allophanates formed under the reaction conditions employed. The relative MALDI-TOF MS response factors for series Bn, Cn and Dn were found to be fA/fB ≈ 1.3 and fA/fC ≈ fA/fD ≈ 2.1, respectively. The fractional MALDI-TOF MS intensities were then converted into molar fractions using the corresponding relative MALDI-TOF MS response factors. Eqn (17)–(20) were fitted to the experimental molar fractions versus time data to determine the corresponding rate constants k1, k2 and k3 (Fig. 8).
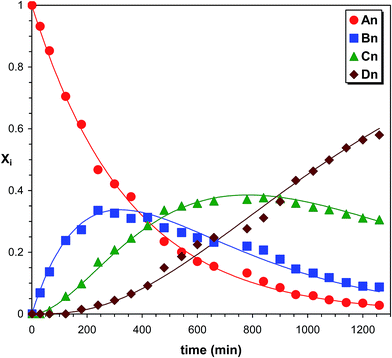 | ||
| Fig. 8 Product distributions versus time in the PPG_GL-MDI reaction determined by MALDI-TOF MS. The solid lines represent the fitted curves calculated by eqn (17)–(20). Experimental conditions: see Fig. 7 caption. | ||
The determined values of k1, k2 and k3 were (4.7 ± 0.1) × 10−4 min−1, (8.5 ± 0.2) × 10−4 min−1 and (8.6 ± 0.2) × 10−4 min−1, respectively. Note that these rate constant values, especially k1, are very close to those of PPG (Table 1). Although the values of k2 and k3 are very similar, both are higher than k1, indicating a positive substitution effect. This means that the reaction of the hydroxyl groups with MDI proceeds faster after the first one has been reacted.
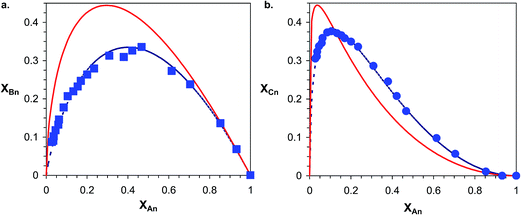
Furthermore, using the XBversus XA data shown in Fig. 9a, the α parameter can be determined using eqn (21). In case of a trifunctional triol α = 2k2/3k1 holds. Accordingly, using eqn (21)α = 1.20 ± 0.02 was obtained.
In addition, the variation of the molar fraction of series Cn (XCn) with that of series An (XAn) can be expressed as shown by eqn (23) (the derivation of eqn (23) can be found in the ESI†).
 | (23) |
By fitting eqn (23) to the experimental XCnversus XAn data (see Fig. 9b) the values of α and β can be determined for which α = 1.23 ± 0.02 and β = 0.51 ± 0.01 were obtained. It is noteworthy that very similar α values were deduced from both the XBnversus XAn and the XCnversus XAn plots. In the absence of substitution and/or any other effects the values of the rate constants k1, k2 and k3 should be equals, yielding values of 2/3 and 0.5 for α and β, respectively. In the case of “pure” statistical attachments of MDI units to the hydroxyl groups of PPG_GL the maximum value of both XBn and XCn are expected to be 4/9. The latter value can be obtained by derivation of eqn (22) and (23) and inserting α = 2/3 and β = 0.5). However, as it is evident from Fig. 9 the maxima of both XBn and XCn are considerable lower than 4/9 and thus α is higher than 2/3 suggesting a positive substitution effect. The 1H-NMR-analysis of the PPG_GL sample treated with (CF3CO)2O (similarly to that presented for PPG) revealed the dominant presence of secondary hydroxyl groups (>98%) with less than 2% primary hydroxyl group content. Hence, deviations from the theoretical ones can not be explained by any significant presence of hydroxyl groups with different reactivities. Considering the molecular weight of PPG_GL (Mn = 1000 g mol−1) one can estimate that one “arm” PPG_GL is composed of ca. 5–6 PO units on the average, thus representing relatively short “arms”. Based on this argument, we may conclude that the observed positive substitution effect may be due to a facile interaction between the urethane and the unreacted hydroxyl end-groups. However, it cannot be excluded that the substitution effect observed for the MDI-PPG_GL system may come from the uncertainties associated with the determinations of the relative MALDI-TOF MS response factors and/or the occurrence of “unobserved” side reactions.
Conclusion
The progress of the reactions of three polymer polyols including PPG, PTHF and PCLD with MDI was monitored by MALDI-TOF MS. The resulting MALDI-TOF MS intensities obtained in the methanol-quenched reaction mixture at different reactions times allowed us to construct the fractional intensities for the corresponding polymer series appeared in the MALDI-TOF MS spectra. The fractional intensities were then converted into molar fractions using the relative MALDI-TOF MS response factors. From the molar fractions versus time data the corresponding pseudo first-order rate constants were determined and the reactivities of the polymer-diols were found to decrease in the order of PCLD > PTHF ≫ PPG. The low reactivity of PPG compared to those of PCLD and PTHF were ascribed to the presence of secondary hydroxyl groups in PPG which were confirmed by 1H-NMR analysis. Based on the results of kinetic experiment it was concluded that the urethane end-group formed in the reaction of OH group with MDI does not alter significantly the reactivity of the unreacted hydroxyl group in the case of these polymer-diols. However, the reaction of PPG_GL with MDI represented a more complex kinetic situation as, besides the starting one, three additional polymer series corresponding to the PPG_GL reacted with one, two and three MDI units were formed. The relative MALDI-TOF MS response factors for the different polymer series were also estimated and these response factors were used further to obtain the molar fractions for the different polymer series from the corresponding fractional intensities. Using the molar fractions versus time data and a consecutive reaction model consisting of three reaction steps, the corresponding pseudo-first order rate constants (k1, k2 and k3) were determined. According to the results, the rate constant k1 determined for PPG_GL was very close to that obtained for PPG indicating that the number of “arms” and the molecular weight had no significant effect on the reactivities of the terminal hydroxyl groups. Moreover, the reaction of the MDI with the second hydroxyl group of PPG_GL (i.e. after one of the three has been reacted) proceeds faster than with the first one, indicating a positive substitution effect. This effect may be attributed to a facile interaction between the urethane group formed and the yet unreacted hydroxyl end-groups owing to the presence of the relatively short “arms” in PPG_GL. Moreover, we can not exclude that the substitution effect observed for the MDI-PPG_GL system may arise from uncertainties of the determinations of the relative MALDI-TOF MS response factors and/or the presence of “unobserved” side reactions.In addition, it has been shown that the time-independent XAn–XBn plot for the MDI-polymer-diol and the XAn–XBn and the XAn–XCn plots for the MDI-polymer-triol systems yielded reliable results for the relative reactivities and the presence or absence of any substitution effects.
It has been also demonstrated that MALDI-TOF MS offers unique way for studying such a complex polymer systems as each of the species with different masses can easily be identified and quantitative information can also be gained providing that the corresponding response factors are successfully determined.
Acknowledgements
The authors acknowledge financial support for this work by grant No. K-101850 from OTKA (National Scientific Research Fund, Hungary). This work was also supported by Hungarian National Talent Program (NTP-EFÖ-P-15, T. Nagy).References
- A. A. Caraculacu and S. Soceri, Prog. Polym. Sci., 2001, 26, 799 CrossRef CAS.
- P. Król, Prog. Mater. Sci., 2007, 52, 915 CrossRef.
- R. J. Zdrahala and I. J. Zdrahala, J. Biomater. Appl., 1999, 14, 67 CrossRef CAS PubMed.
- A. Lendlein and R. Langer, Science, 2002, 296, 1673 CrossRef PubMed.
- B. K. Kim, S. Y. Lee and M. Xu, Polymer, 1996, 37, 5781 CrossRef CAS.
- K. Czifrák, J. Karger-Kocsis, L. Daróczi, M. Zsuga and S. Kéki, Macromol. Chem. Phys., 2014, 215, 1896 CrossRef.
- F. H. Brock, J. Chem. Soc., 1961, 65, 1638 Search PubMed.
- J. Burkus and C. F. Eckert, J. Am. Chem. Soc., 1957, 80, 5948 CrossRef.
- J. W. Baker and J. Gaun, J. Chem. Soc., 1949, 19 RSC.
- E. Dyer, H. A. Taylor, S. J. Mason and J. Samson, J. Chem. Soc., 1949, 71, 4106 CrossRef CAS.
- G. Anzuino, A. Pirro, O. Rossi and L. Polo Friz, J. Polym. Sci., Polym. Chem. Ed., 1975, 13, 1657 CrossRef CAS.
- G. Raspoet, M. T. Nguyen, M. McGarraghy and A. F. Hegarty, J. Org. Chem., 1998, 63, 6878 CrossRef CAS PubMed.
- A. A. Caraculacu, I. Agherghinei, M. Gapar and C. Prisacariu, J. Chem. Soc., Perkin Trans. 2, 1990, 8, 1343 RSC.
- B. Grepinet, F. Pla, P. H. Hobbes, P. H. Swaels and T. H. Monge, J. Appl. Polym. Sci., 2000, 75, 705 CrossRef CAS.
- P. Król and J. Wojturska, J. Appl. Polym. Sci., 2003, 88, 327 CrossRef.
- X. Y. Huang, W. Yu and C. S. P. Sung, Macromolecules, 1990, 23, 391 CrossRef.
- X. D. Sun and C. S. P. Sung, Macromolecules, 1996, 29, 3198 CrossRef CAS.
- Z. H. Gao, J. Y. Gu and X. D. Bai, Pigm. Resin Technol., 2007, 36, 90 CrossRef CAS.
- M. A. Zaverkina, V. P. Lodygina, V. V. Komratova, E. V. Stovbun and E. R. Badamshina, Polym. Sci., Ser. A, 2006, 48, 382 CrossRef.
- T. Nagy, B. Antal, K. Czifrak, I. Papp, J. Karger-Kocsis, M. Zsuga and S. Keki, J. Appl. Polym. Sci., 2015, 132, 42127 CrossRef.
- A. Kaushik and P. Singh, Int. J. Polym. Mater., 2008, 57, 815 CrossRef CAS.
- T. N. M. T. Ismail, K. D. P. Palam, Z. B. A. Bakar, H. S. Soi, Y. S. Kian, H. A. Hassan, C. Schiffman, A. Sendijarevic, V. Sendijarevic and I. Sendijarevic, J. Appl. Polym. Sci., 2016, 133, 42955 CrossRef.
- C. A. Cateto, M. F. Barreiro, A. E. Rodrigues and M. N. Belgacem, React. Funct. Polym., 2011, 71, 863 CrossRef CAS.
- M. Ionescu, Z. S. Petrovic and X. Wan, J. Polym. Environ., 2010, 18, 1 CrossRef CAS.
- P. K. Maji and A. K. Bhowmick, J. Polym. Sci., Part A: Polym. Chem., 2009, 47, 731 CrossRef CAS.
- U. Sebenik and M. Krajnc, Int. J. Adhes. Adhes., 2007, 27, 527 CrossRef CAS.
- M. A. Semsarzadeh and A. H. Navarchian, J. Polym. Eng., 2003, 23(4), 225 CAS.
- C. Pavier and A. Gandini, Eur. Polym. J., 2000, 36, 1653 CrossRef CAS.
- M. J. Elwell, A. J. Ryan, H. J. M. Grünbauer and H. C. Van Lieshout, Macromolecules, 1996, 29, 2960 CrossRef CAS.
- M. Möller and H. U. Moritz, J. Appl. Polym. Sci., 2006, 101, 4090 CrossRef.
- R. Ghoreishi and G. J. Suppes, RSC Adv., 2015, 5, 68361 RSC.
- A. Eceiza, K. de la Caba, V. Gascón, M. A. Corcuera and I. Mondragon, Eur. Polym. J., 2001, 37, 1685 CrossRef CAS.
- R. Ghoreishi, Y. Zhao and G. J. Suppes, J. Appl. Polym. Sci., 2014, 131, 40388 CrossRef.
- P. Król and B. Pilch-Pitera, Polymer, 2003, 44, 5075 CrossRef.
- A. Eceiza, K. de la Caba, G. Kortaberria, N. Gabilondo, C. Marieta, M. A. Corcuera and I. Mondragon, Eur. Polym. J., 2005, 41, 3051 CrossRef CAS.
- B. Grepinet, F. Pla, P. H. Hobbes, P. H. Swaels and T. H. Monge, J. Appl. Polym. Sci., 2001, 81, 3149 CrossRef CAS.
- H. Kothandaraman and A. Sultan Nasar, J. Appl. Polym. Sci., 1993, 50, 1611 CrossRef CAS.
- K. Tanaka, H. Waki, Y. Ido, S. Akita and T. Yoshida, Rapid Commun. Mass Spectrom., 1988, 2, 151 CrossRef CAS.
- S. F. Wong, C. K. Meng and J. B. Fenn, J. Phys. Chem., 1988, 92, 546 CrossRef CAS.
- K. M. Kadish, X. Mu and J. E. Anderson, Pure Appl. Chem., 1989, 16, 1823 Search PubMed.
- M. Bednarek, P. Kubisa and S. Penczek, Macromol. Chem. Phys., 1989, 15, 49 CrossRef CAS.
- D. Chakraborty, A. Rodriguez and E. Y. X. Chen, Macromolecules, 2003, 36, 5470 CrossRef CAS.
- D. Marquardt, SIAM J. Appl. Math., 1963, 11, 431 CrossRef.
Footnote |
| † Electronic supplementary information (ESI) available. See DOI: 10.1039/c6ra06671b |
| This journal is © The Royal Society of Chemistry 2016 |

