
Fabrication and cell viability of injectable n-HA/chitosan composite microspheres for bone tissue engineering
Bin Cai,
Qin Zou*,
Yi Zuo,
Limei Li,
Boyuan Yang and
Yubao Li*
Research Center for Nano-Biomaterial, Analytical & Testing Center, Sichuan University, Chengdu 610064, China. E-mail: zouqin80913@126.com; nic7504@scu.edu.cn
First published on 2nd September 2016
Abstract
Composite microspheres based on nano-hydroxyapatite (n-HA)/chitosan (CS) with different weight ratios were fabricated by an emulsion method and using natural vanillin as a cross-linking agent. FT-IR, XRD, TGA, SEM and laser particle size analysis were used to characterize their physico-chemical properties. Live-dead cell staining and MTT assay were used to evaluate cell viability and cytocompatibility. The results showed that the rod-like n-HA crystals could be incorporated into the CS matrix in a relatively high level up to 29.57 wt%. The encapsulation efficiency of n-HA in the composite microspheres was between 29.50–73.93%. The composite microspheres with a diameter of 10.9–55.0 μm and good swelling properties should be easy to inject into irregular bone defects. The studies of in vitro biodegradation and cell culture using MG63 cells demonstrated that the vanillin-crosslinked n-HA/CS microspheres could be degraded in a sustained and controlled behavior while supporting cell growth, thus acting as worthy candidates for a multifunctional injectable matrix in bone tissue engineering.
1. Introduction
n-HA, a kind of similar material to the main inorganic component of natural bone,1 was introduced as a biomaterial in bone repair, bone implants and bone drug delivery systems due to its superior bioactivity, biocompatibility, osteoconductivity, osseointegration and non-toxicity.2 It is an effective component for preparing bone tissue engineering scaffolds, but some drawbacks, such as difficulty of shaping, poor mechanical strength and brittleness, limit its application in bone tissue.3Various kinds of n-HA/polymer composites have been investigated in order to widen the use of n-HA. Some natural polymers have often been used as the matrix of these composites.4 CS has been suggested as a natural polymer for use in orthopedic applications and has been widely used for bone tissue engineering in various forms due to its non-toxicity, cytocompatibility, biodegradability5 and other unique properties such as low immunogenic6 and antibacterial.7 The cytocompatibility of CS was due to its chemical structure, which had a similar backbone to glycosaminoglycan, the major component of the extracellular matrix of bone.8 In recent years, CS has been used to fabricate n-HA/CS composites into specific shapes, such as membranes, 3D scaffolds and microspheres.9 The microsphere-type scaffolds can provide more versatile applications than pre-shaped scaffolds. For example, they can be acted as injectable scaffolds because of their pseudoplastic behavior.10 They are easier to be injected into the location of bone defects and more advantageous in filling the irregular bone defect compared with films and 3D scaffolds. Cross-linking is a common way to modify the CS structure. The available amino and hydroxyl groups on CS are active sites capable of forming a number of linkages.
In this experiment, oil/water double emulsion technique and vanillin crosslinker were selected to fabricate the n-HA/CS composite microspheres. Although some aldehydes reagents have been adopted as crosslinkers, such as formaldehyde,5 glyoxal11 and glutaraldehyde,12 their potential toxicity may impair the biocompatibility of the obtained materials,13 thus limiting their application in bone tissue engineering. Vanillin is a kind of natural edible spices widely used in food or cosmetic industry.14 In the past few years, it has been used as a crosslinker for formulation of CS microspheres because of two following reasons: the Schiff base reaction between aldehyde group in vanillin and the amino group of CS, and phenolic hydroxyl may form hydrogen bonds with CS to establish network structures of microspheres.15 Previously, we have also reported that vanillin crosslinked CS microspheres displayed a better cytocompatibility and much weaker neutrophilic inflammatory reaction than glutaraldehyde crosslinked CS microspheres.16 In this study, we hypothesize that vanillin cross-linked n-HA/CS composite microspheres can be mixed with cells and then injected into irregular shaped bone defects for bone repair. It has been reported that the n-HA can improve the bioactivity of CS scaffolds.17 The n-HA mineral phase present on the surface of CS membranes is more favorable for the adhesion of proteins.18 However, as for CS microspheres, the loaded efficiency of n-HA is limited and encapsulation efficiency is impossible to be perfect because of the saturated ionic or polar interactions between –NH3+ in CS polymer chains and PO43− in n-HA particles.19 Apart from this, excessively high concentration of n-HA may induce cellular uptake,20 which impair the cytocompatibility of microspheres. Accordingly, although n-HA can provide n-HA/CS composites with some excellent properties, the real content of n-HA cannot be ignored for the investigation of n-HA/CS composite microspheres. In particular, it is meaningful to investigate properties in the range of various n-HA contents, thus supporting further advance in building an injectable microspheres-based scaffold.
2. Materials and methods
2.1 Materials
Chitosan (average molecular weight MW = 2.5 × 10⁵ g mol−1, deacetylation degree DD = 90%) was from Jinan Haidebei Marine Bioengineering Co. Ltd. (Shandong, China). Vanillin (99%, Aladdin, China) was used as the crosslinker. Analytically pure chemical reagents including acetic acid, liquid paraffin (C16–C20 alkane), petroleum ether (60–90 °C), isopropyl alcohol, Tween80, Span80, anhydrous alcohol, Ca(NO3)2, Na3PO4, and NaOH were used in the fabrication of composite microspheres.2.2 Fabrication of n-HA/CS composite microspheres
![[thin space (1/6-em)]](https://www.rsc.org/images/entities/char_2009.gif) :1, 1:9, 2:8, 3:7 and 4:6) of n-HA to CS. About 14 g water phase mixture was emulsified with 84 g liquid paraffin (oil phase) containing 0.3 g Tween80 and 1.2 g Span80 at a speed of 5000–6000 rpm by a shearing emulsification instrument (MS-A200, MUXUAN Corporation, Shanghai, China) for 30 min. Subsequently, the CS emulsion was crosslinked by 15 mL 20 wt% vanillin/ethanol solution and stirred at 400 rpm for 3 h. Finally, n-HA/CS composite microspheres were precipitated on the bottom, separated using petroleum ether from emulsion mixture, and washed by isopropyl alcohol three times. The obtained composite microspheres relative to the weight ratio, named as CM-0, CM-1, CM-2, CM-3 and CM-4, were kept in anhydrous alcohol.
:1, 1:9, 2:8, 3:7 and 4:6) of n-HA to CS. About 14 g water phase mixture was emulsified with 84 g liquid paraffin (oil phase) containing 0.3 g Tween80 and 1.2 g Span80 at a speed of 5000–6000 rpm by a shearing emulsification instrument (MS-A200, MUXUAN Corporation, Shanghai, China) for 30 min. Subsequently, the CS emulsion was crosslinked by 15 mL 20 wt% vanillin/ethanol solution and stirred at 400 rpm for 3 h. Finally, n-HA/CS composite microspheres were precipitated on the bottom, separated using petroleum ether from emulsion mixture, and washed by isopropyl alcohol three times. The obtained composite microspheres relative to the weight ratio, named as CM-0, CM-1, CM-2, CM-3 and CM-4, were kept in anhydrous alcohol.
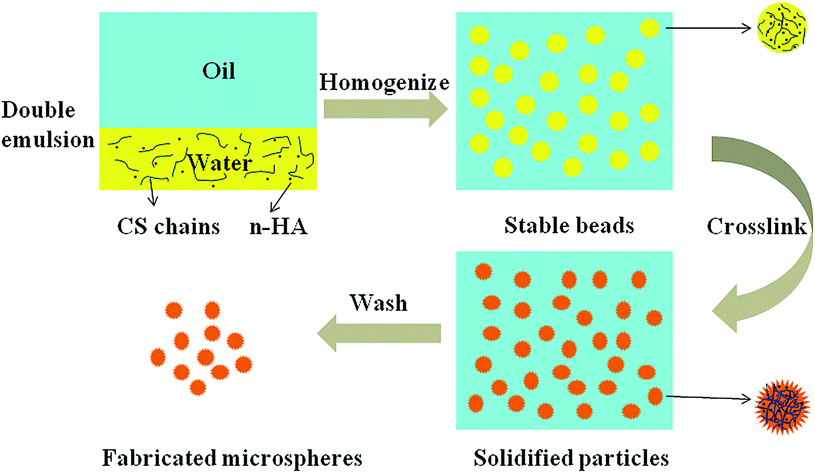 | ||
| Fig. 1 Schematic diagram for fabrication of composite microspheres via oil/water double emulsion process and vanillin crosslinking. | ||
2.3 Characterization
The size and morphology of n-HA were observed using transmission electron microscope (TEM, Tecnai, G2 F20, USA),19 operating at an accelerating voltage of 30 kV. Before observation, dried samples were ground into fine powders and dispersed in anhydrous ethanol. The suspension was dropped on a carbon-coated copper grid.The size distribution of these composite microspheres was measured by laser particle size analyzer (BaiTe, BT-9300H, China). The results were obtained from automated analysis of the laser particle size analyzer. These data include particle size distribution curve, D10, D50, D90 and so on. If D10 is A μm, it represents there are 10% particles whose diameters are less than A μm. The meaning of D50 and D90 is similar to D10. Therefore, D10–D90 with median diameter D50 can reflect the particle size distribution (minimum size–maximum size) indirectly. Since the values of D10 and D90 in each group were similar, we chose the minimum value A μm (D10) and maximum value B μm (D90) to represent the overall distribution of all fabricated microspheres. The shape and surface morphology of the microspheres with different n-HA/CS ratio were observed by scanning electron microscopy (SEM, HITACH S530, Japan). Before observation, the microspheres were fully dispersed in anhydrous alcohol via ultrasound.
The microspheres kept in anhydrous alcohol were centrifuged, separated and dried to obtain microspheres. Then they were weighed and mixed with 0.1 M PBS solution (pH = 7.4) in 5 mL medical syringes (orifice diameter of 2 mm) to obtain 1 mL of gels consisted of microspheres (35 w/v% solid content). The injectability test was evaluated by directly injecting the gels under a compressive force and recording photographs immediately.
The phase composition and structure of n-HA/CS composite microspheres were determined by X-ray diffraction (XRD, philips X'pert pro MPD, Cu Kα) and Fourier transform infrared spectroscopy (FT-IR, Thermofisher, Nicolet-5700, KBr). The XRD patterns were operated at 40 kV and 20 mA in a 2θ range of 5–60° with a step of 0.03°. Samples for FT-IR were mixed with analytical grade KBr powders at a weight ratio of 1/100. The FT-IR spectra were collected from 3500 to 500 cm−1.
Thermogravimetric analysis (TG) was employed to estimate the mass percentage and encapsulation efficiency of n-HA,22 using a NETZSCH STA 449F3 Jupiter instrument in a constant N2 flow of 50 mL min−1. The temperature was set from 25 °C to 700 °C with a heating rate of 10 K min−1. The sample mass was about 5 mg put in Al2O3 crucible with a lid. The content of n-HA was estimated by combining TG analysis curves for n-HA sample and CM-0. Calculation eqn (1) and (2) were described as follows:23
| (1 − N) × M + N × R = W | (1) |
| N/A = E | (2) |
The ability of the microspheres to swell was conducted using 0.1 M PBS solution (pH = 7.4) as contact liquids. Microspheres were dried to constant weight and then immersed in the solution at 37 °C for 2 days. The swollen microspheres were collected after they were centrifugalized and separated from the medium. After having been superficially remove the excess water with filter paper, they were weighed immediately on an analytical balance. The swelling ratio (Sw) of the cross-linked microspheres at equilibrium was calculated using eqn (3):24
| Sw(%) = [(Wt − W0)/W0] × 100 | (3) |
The in vitro biodegradation property was monitored as the change in sample weight over time under simulated physiological condition. The test was conducted in lysozyme solution (3 mg mL−1). The initial dry weight of the sample (Wi) was recorded. Three parallel samples were incubated in 0.1 M PBS (pH = 7.4) solution containing lysozyme in a shaker at 37 °C. At predetermined time intervals, the samples were centrifuged and separated from the degradation medium. Subsequently, they were dried to constant weight (Wd) and same volume of fresh medium were added. The cumulative degradation (Dc) was calculated using eqn (4):25
| Dc(%) = (Wi − Wd) × 100/Wi | (4) |
2.4 Cell adhesion and morphology
The MG63 cells from human osteosarcoma belong to a non-transformed cell line and exhibit an osteoblastic phenotype. The cells used in this study were obtained from HuaXi hospital (Chengdu, China). The cells were propagated in F12 nutrient solution (GIBCO, USA) with supplements of 10% calf serum (GIBCO, USA) and 1% penicillin/streptomycin incubated at 37 °C in 5% CO2.22 After being 90% confluent, the cells were washed, trypsinized, suspended in fresh media and continued to incubate. The culture medium was changed every 3 days. Before seeded on the microspheres, MG63 cells grew in a good condition and almost completely occupied on the bottom of bottle.The composite microspheres (10 mg each) with different n-HA contents were dispersed respectively in 24-well plates (Corning, USA) with bottom glass sheets, and sterilized in 75% ethanol for 3 hours. Then they were washed three times with PBS solution and incubated in the culture media overnight. One of wells without microspheres was set as a control group. After ensuring non-pollution, the culture media were discarded. 1 mL of MG63 cells in suspension (5 × 10⁴ cells) was seeded on each well and incubated at 37 °C in 5% CO2. The culture medium was changed every 2 days to maintain the sufficient supply of nutrient. In order to evaluate the cell morphology on microspheres, the cells/microspheres adhering on the glass sheets were harvested, washed with PBS solution, fixed by glutaraldehyde (2.5%), dehydrated though gradient alcohol concentrations (30, 50, 75, 83, 95 and 100%), replaced by isoamyl acetate, critical point dried and sputter-coated with gold to observe the morphology of cells/microspheres using SEM at 20 kV.
2.5 Live/dead and MTT assay
The in vitro qualitative analysis of cell viability was evaluated using live/dead viability/cytotoxicity assay.26 Cells were characterized by fluorescent staining of live cells in green (by calcein-AM, Invitrogen) and dead cells in red (by ethidium, Invitrogen). After being propagated for 4 and 7 days, cells were washed three times with PBS and stained by live/dead solution (200 μM calcein-AM and 400 μM ethidium) in the dark. The cells/microspheres samples were analyzed with an inverted fluorescence microscope after combination dyeing in the incubator (37 °C, 5% CO2) for 30 min.Cell proliferation on microspheres was determined quantitatively using MTT assay method by measuring the activity of the mitochondrial dehydrogenases.27 The vanillin-crosslinked microspheres with different n-HA content were dispersed in 24-well plates, respectively. One of wells without microspheres was set as a control group. The MG63 cells in suspension (∼5 × 10⁴ cells) were seeded on each well. After being seeded for 4 d and 7 d, cells were washed three times with PBS, then incubated in 40 μL prepared 3-[4,5-dimethylthiazol-2-yl]-2,5-diphenyltetrazolium bromide (MTT) solution at 37 °C. Four hours later, MTT solution was removed and dimethylsulfoxide (DMSO) was added in the wells. At last, the DMSO solution was transferred into 96-well plates to detect absorbance at 490 nm. Three parallel samples were analyzed for each batch.
2.6 Statistical analysis
Data of swelling test, in vitro degradation and MTT assay were expressed as mean ± standard deviations. One way analysis of variance was used to determine the statistical significance among different groups. When P value was less than 0.05, the statistics were considered significant.3. Results and discussion
3.1 The morphology, size distribution and injectability of microspheres
Fig. 2 shows the morphology and size distribution of the fabricated microspheres with different n-HA contents. They display ball-like shape and increased surface roughness (Fig. 2a–e). The surface of CM-0 looks uniform (Fig. 2a) and has a net microstructure composed of crosslinked CS matrix (Fig. 2f). The morphology of pure n-HA particles was confirmed to be rod-like in a nano-scale (at length of ∼120 nm and width of ∼20 nm measured based on Fig. 2A and B). The rod-like n-HA particles (marked by arrows) in composite microspheres can be also observed from the microstructure (dark color, Fig. 2g–j), demonstrating successful incorporation of n-HA component into CS matrix. It shows that there is a thin layer of polymer phase around the n-HA particles (Fig. 2g and h). And the n-HA particles are completely embedded within the polymeric phase of nanocomposites. With increasing amount of n-HA addition, the nano-particles are gradually aggregated into clusters and separated from fibers (Fig. 2i and j). Therefore, n-HA particles are obviously aggregated on the surface of microspheres (Fig. 2d and e). And the increasing content of separated n-HA particles changes the good degree of sphericity and surface geometry of microspheres.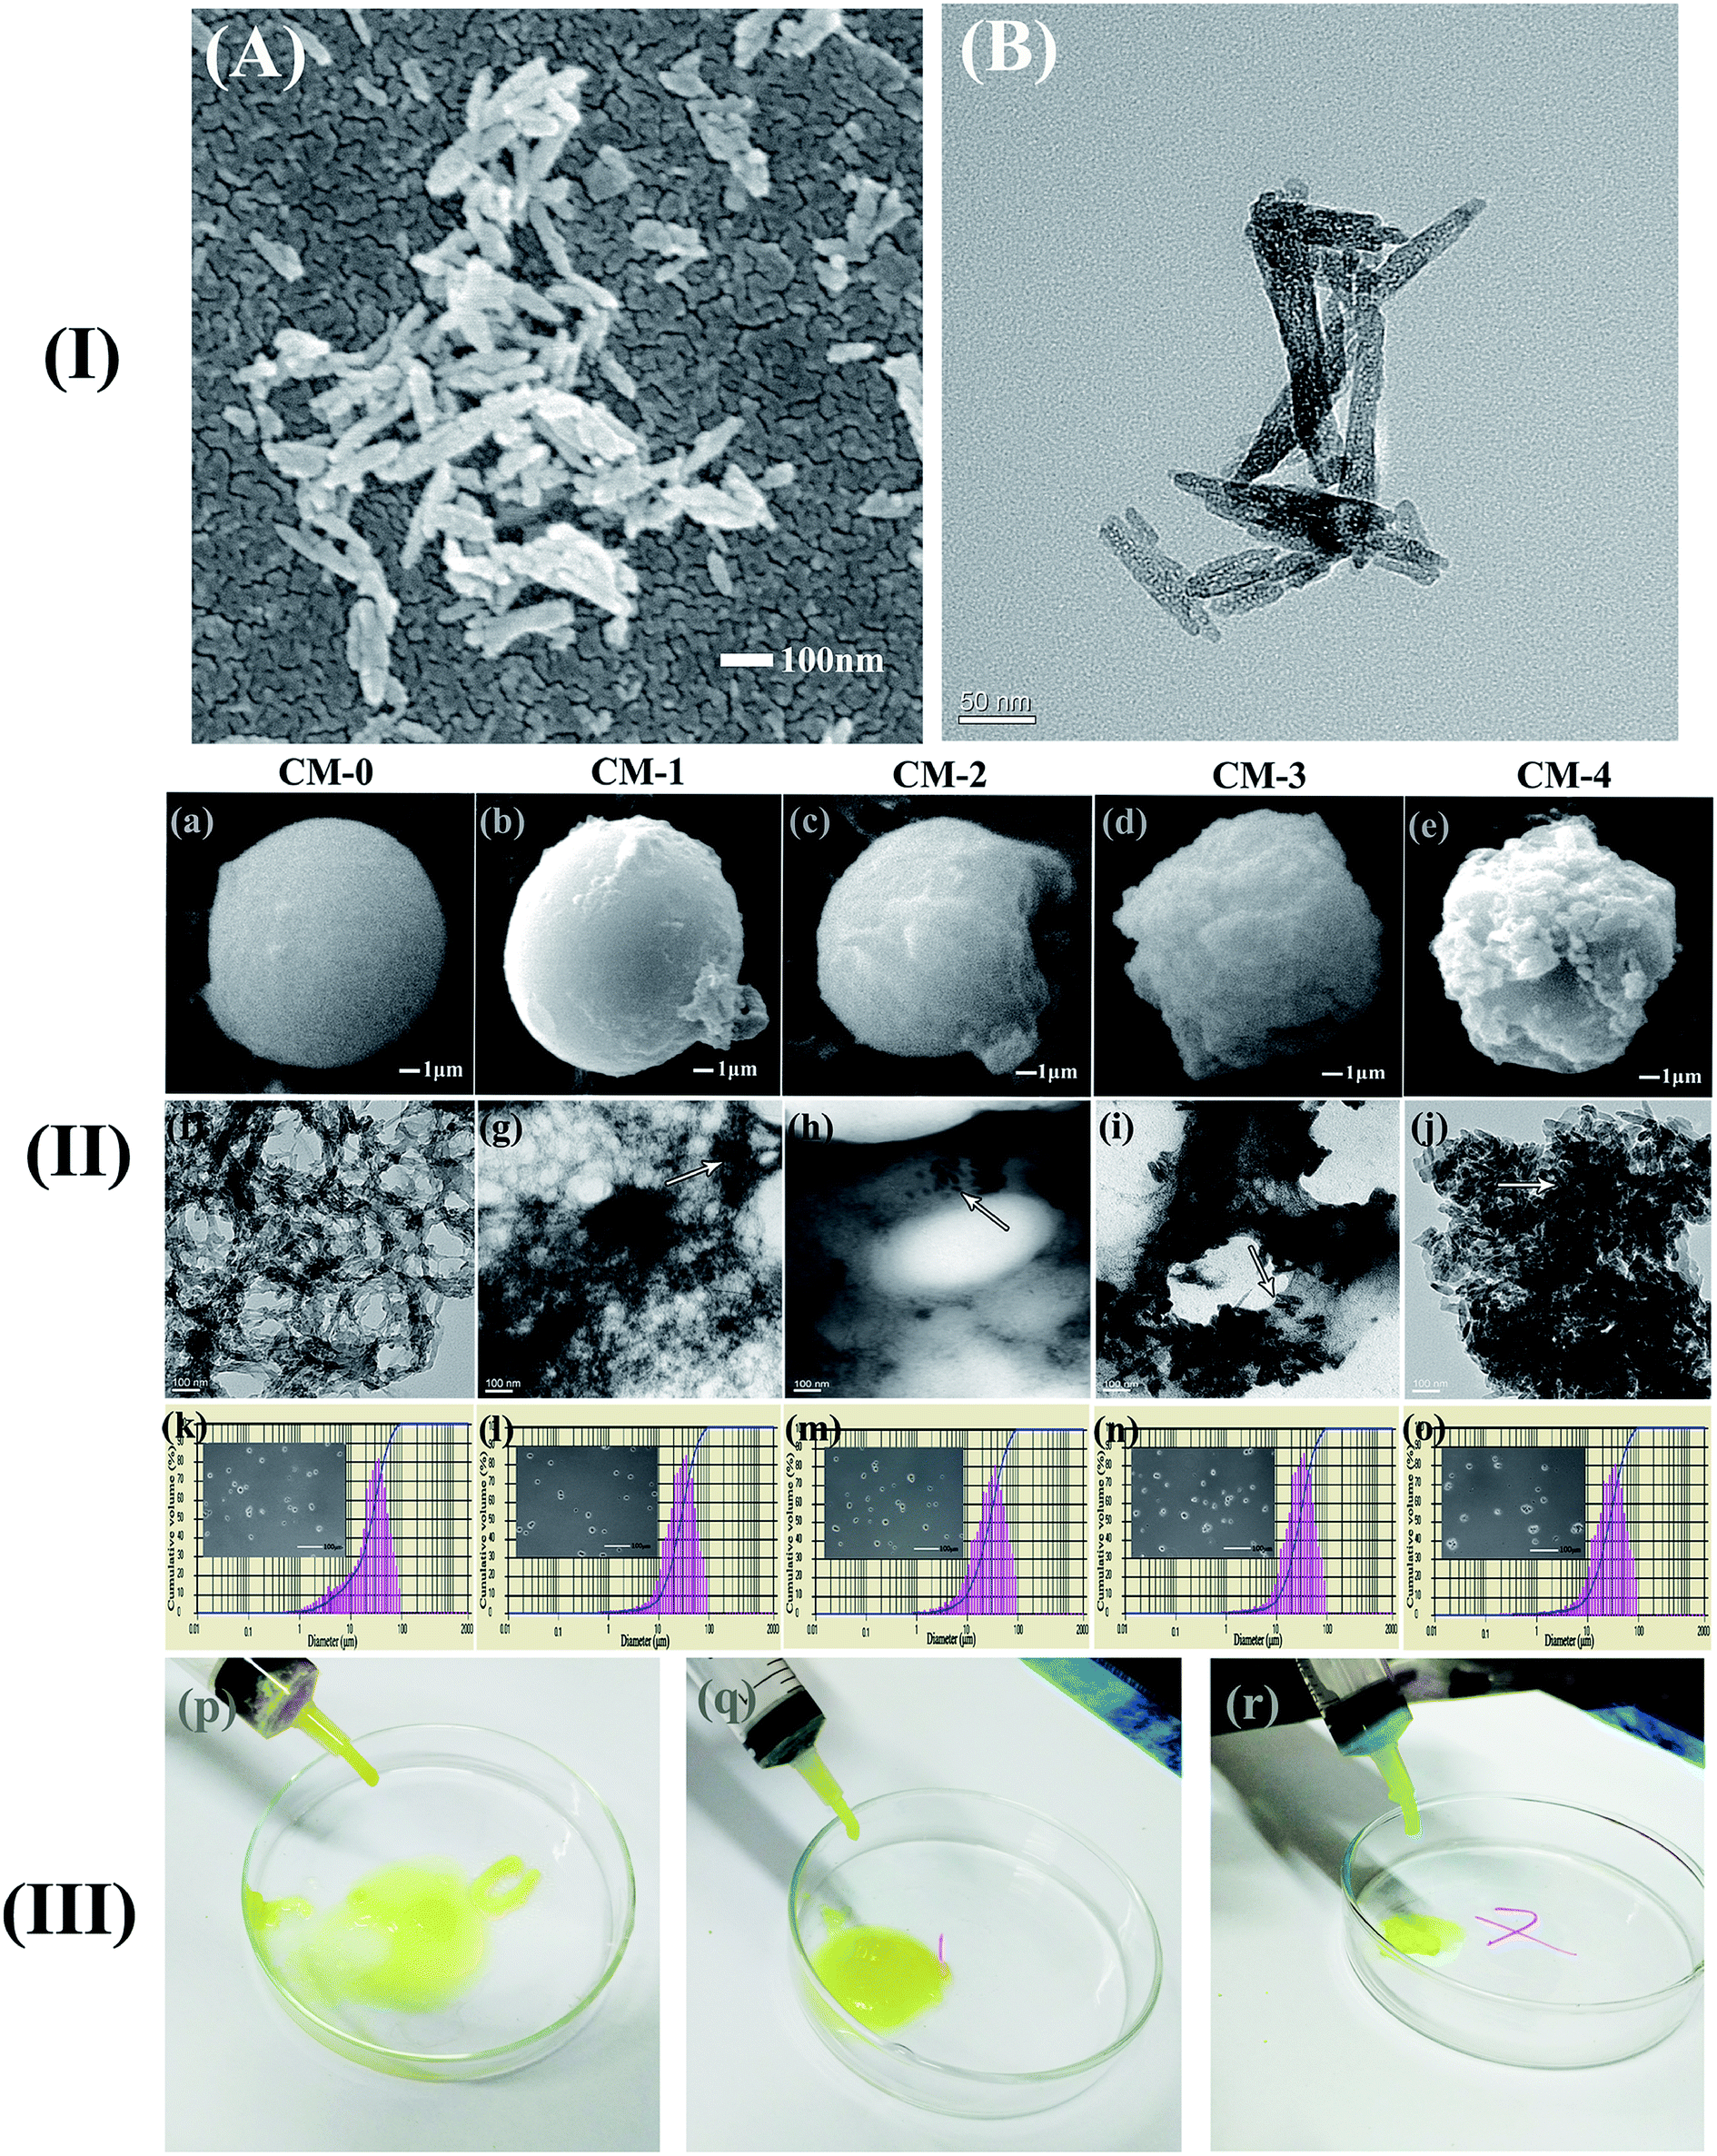 | ||
| Fig. 2 (I) The SEM (A) and TEM (B) morphology of the pure n-HA (II) the SEM morphology (a–e), TEM microstructure (f–j) and size distribution (k–o) of the microspheres with different n-HA content (arrows represent n-HA particles) (III) injectability test of CM-0 (p), CM-1 (q) and CM-4 (r). | ||
The size of microspheres is influenced by inorganic particle fillers and has a great effect on their cytocompatibility or biodistribution.28 It has been reported that spheres of less than 2 mm can be used in matrix of injectable scaffold to aid bone regeneration.29 The particle size distribution of CM-0 to CM-4 (Fig. 2k–o) is similar, in a range of 10.9–55.0 μm (D10–D90) with median diameter (D50) of 33.0 μm. From the digital photographs (Fig. 2p–r), we can see both CM-0 and the composites with low or high contents of n-HA were allowed to extruded like gel-threads through syringes, suggesting a good injectability of the fabricated microspheres. The diameter of these microspheres is controlled by several parameters of fabrication process, such as the solution concentration, the amount of surfactants, the content of n-HA, and the speed of emulsification pretreatment. The later parameter plays the most important role in obtaining smaller and well-dispersed microspheres, which can be attributed to the cleavage of large liquid drop into smaller drops in the stable and homogeneous emulsion system.30 All the fabricated microspheres have a small size and relatively narrow particle size distribution, which are beneficial to their potential applications in bone tissue engineering or related drug delivery.
3.2 FT-IR analysis
As shown in Fig. 3a, the peaks at ∼1592 and ∼1511 cm−1, which also appear with a slight blue shift in the spectra of microspheres (Fig. 3c–g), are ascribed to benzene ring of vanillin. The absorption bands at ∼2859 cm−1 and ∼2739 cm−1 are attributed to the Fermi resonance of aldehyde group of uncrosslinked vanillin. They are not present in the microspheres, demonstrating the occurrence of crosslinking reaction between CS and vanillin.31 In addition, the typical absorption peak at ∼1642 cm−1 in spectra of microspheres belongs to stretching vibration of C![[double bond, length as m-dash]](https://www.rsc.org/images/entities/char_e001.gif) N group resulting from the Schiff base reaction between aldehyde group of vanillin and amino group of CS.32
N group resulting from the Schiff base reaction between aldehyde group of vanillin and amino group of CS.32
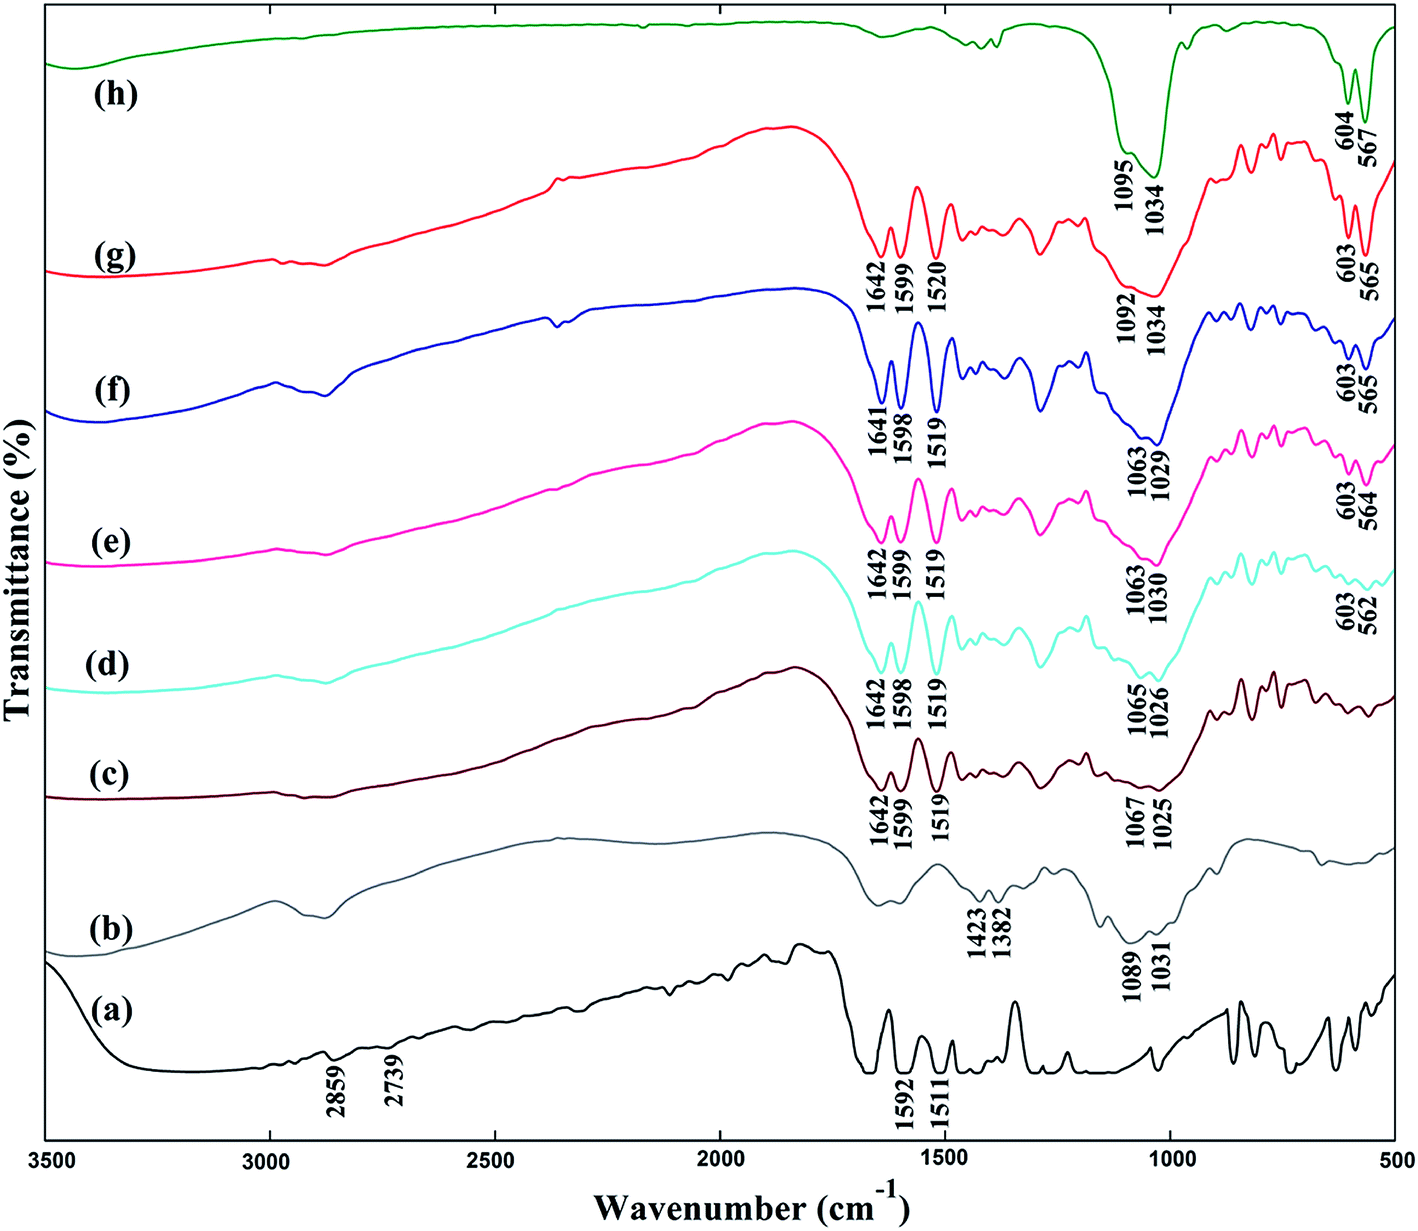 | ||
| Fig. 3 FT-IR spectra of vanillin (a), chitosan (b), CM-0 (c), CM-1 (d), CM-2 (e), CM-3 (f) CM-4 (g) and n-HA (h). | ||
The bands at 1423, 1382 cm−1 and 1089, 1031 cm−1 (Fig. 3b) correspond to the absorption of –CH2– groups and C–O–C stretching vibration in CS molecular chain.33 These adsorption peaks are present or overlapped in CM-0–CM-4. The observed bands at about 567, 604, 1034 and 1095 cm−1 (Fig. 3h), which also appear with slight red shift in the composite microspheres (Fig. 3d–g), are assigned to typical absorption for PO43− vibrational modes of n-HA component,34,35 indicating the presence of n-HA fillers in CS matrix and possible interaction between n-HA and CS.
3.3 Phase composition and structure
The phase composition and structure of n-HA, CS, CM-0, CM-1, CM-2, CM-3 and CM-4 were analyzed via XRD patterns, as shown in Fig. 4. The n-HA sample reveals a typical crystalline structure with sharp diffraction peaks at 25.9°, 31.8°, 32.8°, 34.0°, 39.9° and 49.5° (Fig. 4a) that can be assigned respectively to the (002), (211), (300), (202), (310) and (213) lattice planes of HA hexagonal structure (JCPDS #09-0432).36,37 The diffraction pattern of CS exhibits two broad peaks at about 11° and 20° (Fig. 4g). With regard to the microspheres, the intensity of CS peaks decreases while the intensity of n-HA peaks increase with the addition of n-HA fillers (Fig. 4b–f), showing weakly crystallized structure of both n-HA and CS in the composite microspheres (Fig. 4b–e). However, the composite microspheres maintain the same position of diffraction peaks as that of n-HA and CS, and do not change their respective crystal structure. As we know, the apatite mineral in natural bone also has a weak crystallinity. Furthermore, the TEM images (Fig. 2i and j) of CM-3 and CM-4 reveal the n-HA crystals can distribute in CS matrix or on the surface of microspheres through electrostatic force between cationic polyelectrolyte of CS and anions (e.g. PO43−, –OH) of n-HA.38 The weakly crystallized n-HA incorporated into the microspheres could provide better affinity and bone-bonding capacity for bone regeneration.39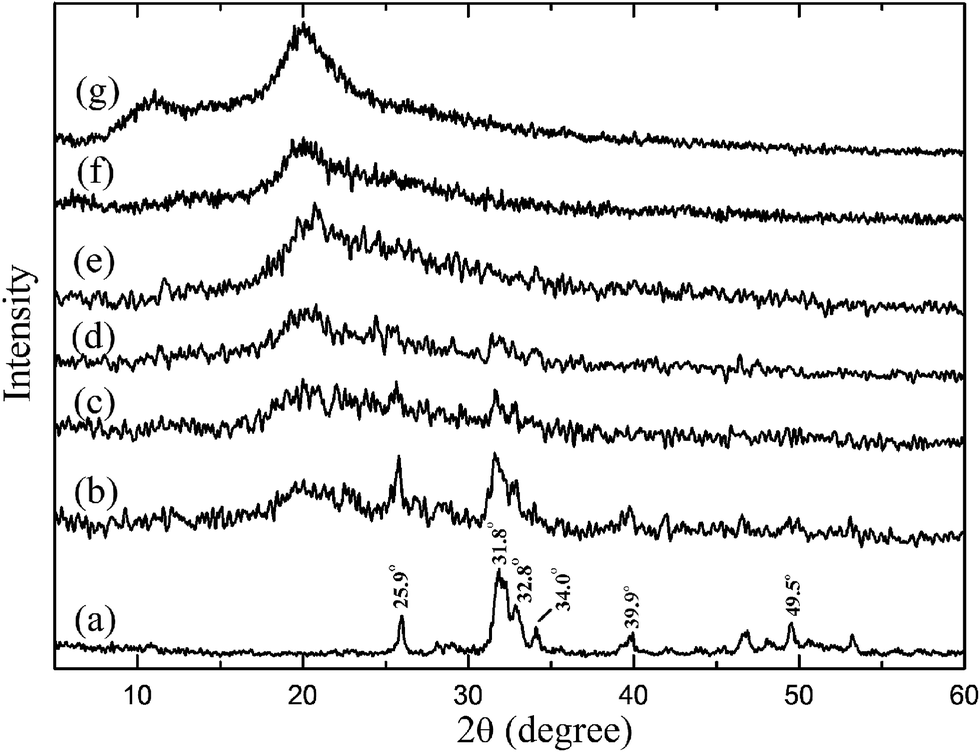 | ||
| Fig. 4 XRD patterns of n-HA (a), CM-4 (b), CM-3 (c), CM-2 (d), CM-1 (e), CM-0 (f) and CS (g). | ||
3.4 Thermogravimetric analysis
The TG curves for n-HA, CM-0, CM-1, CM-2, CM-3 and CM-4 are shown in Fig. 5, where the temperature is set as X-axis and the remaining mass (%) is set as Y-axis. All the microspheres (Fig. 5a–e) have a similar thermal decomposition trend at temperature from 25 °C to 700 °C. There are three mass loss stages corresponding to three temperature range. The first range is from initial temperature to ∼260 °C, where the adsorbed H2O molecules decompose from microspheres. The degradation of polymer occurs at the second temperature range from ∼260 °C to ∼300 °C. It is related to a complex process of dehydration of the saccharide rings, depolymerization and decomposition of acetylated and deacetylated chitosan units.40 The third range is from ∼300 °C to ∼670 °C, in which the terminal thermal degradation temperature was reported to be 620 °C for CS.41 After 670 °C, the mass loss is not obvious. As for n-HA fillers (Fig. 5f), no significant mass decrease can be observed at temperature above ∼500 °C. The desorption of physically and chemically adsorbed H2O molecules contributes to the mass loss before 500 °C.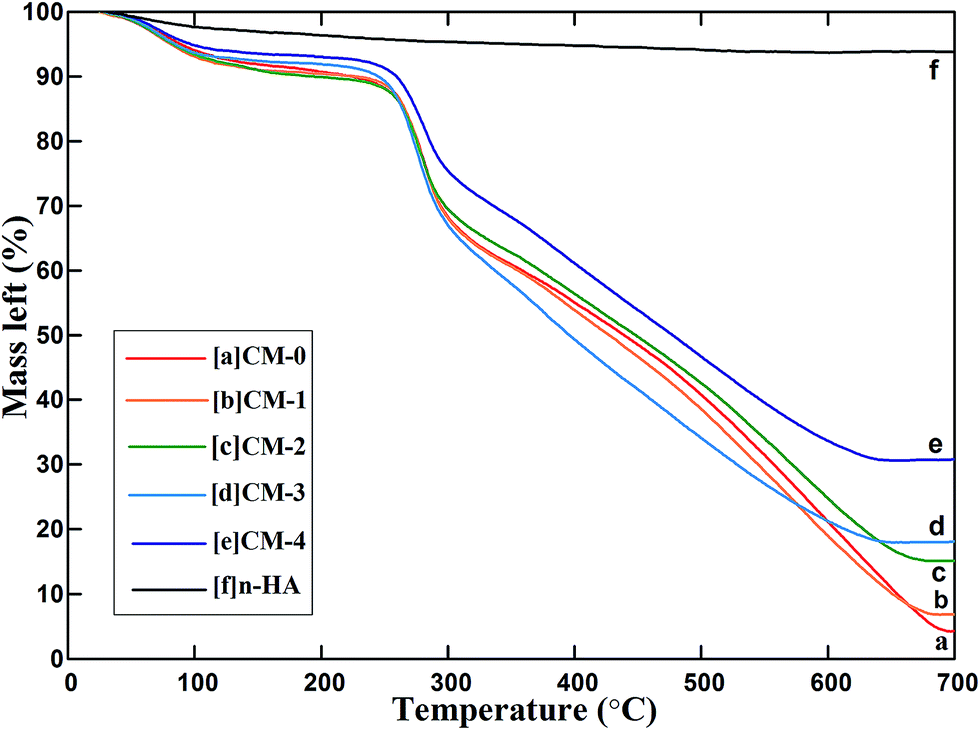 | ||
| Fig. 5 TG curves for thermal decomposition of CM-1, CM-2, CM-3 and CM-4 compared with CM-0 and n-HA. | ||
The n-HA sample has the highest residual mass of about 93.85% (Fig. 5f), and the CM-0 sample shows lowest residual mass of about 4.28% (Fig. 5a) at 700 °C. The residual mass of the composite microspheres is between that of n-HA and CM-0, and increases with the increasing amount of n-HA fillers. The estimated quantitative data of n-HA content and the encapsulation efficiency of n-HA in CS matrix are listed in Table 1.
| Microspheres | n-HA content (wt%) | Encapsulation efficiency (%) |
|---|---|---|
| CM-1 | 2.95 | 29.50 |
| CM-2 | 12.15 | 60.75 |
| CM-3 | 15.45 | 51.50 |
| CM-4 | 29.57 | 73.93 |
It can be seen from Table 1 that the n-HA content of composite microspheres varies from 2.95% to 29.57%, lower than the additive theoretical value of 10–40% during fabrication of microspheres. When additive amount is 40%, the actual content is 29.57%, and the actual encapsulation efficiency of n-HA fillers in CS matrix can still reach to 73.93%, which is a relatively high value for CS microspheres.
In the preparation for CM-1, the majority of the n-HA particles were dissolved in the CS acetic acid solution because of their weak alkaline property.42 Only a tiny fraction (2.95%) of n-HA was entrapped in CS network. When n-HA addition amount was increased to 20%, more alkalescent n-HA particles gradually adjusted the pH of the system.43 There were adequate n-HA particles can be encapsulated into the CS matrix, resulting in the increase of encapsulation efficiency to 60.75%. From Fig. 2i, we can see some n-HA particles were aggregated and separated from the polymer matrix in CM-3. They were weakly adsorbed on the surface of microspheres. We inferred that some of these aggregated particles were lost in the process of high speed stirring. So the encapsulation efficiency of CM-3 declined slightly compared with that of CM-2. However, when n-HA content increased to 40%, more aggregated n-HA particles were adsorbed on the surface of microspheres, which improved the adsorption capacity of their surface. Excess n-HA particles would not be lost in the process of high speed stirring but be adsorbed on the surface of microspheres. Therefore, the encapsulation efficiency of CM-4 will increase to 73.93%.
3.5 Swelling properties
The fabricated n-HA/CS composite microspheres are aimed to be injected for bone tissue engineering. So the swelling property is crucial for practical applications because it might benefit for keeping the size and shape of scaffolds stable during contact with the implanted site or during cell culture.44 From the data in Fig. 6, we can conclude that the microspheres-type scaffold absorbed water more than their own weight, suggesting a good swelling behavior of CS microspheres and n-HA/CS composites. Besides, incorporation of n-HA into pure CS results in a decline of the swelling degree, demonstrating the n-HA is helpful in reducing the water absorption. The similar trend like this has also been reported previously.45 However, there is no significant difference (P > 0.05) among each composites although the mean values exhibit a small decrease trend with the increase of n-HA. It demonstrates that the n-HA content has no significant effect on the swelling property of the composite microspheres crosslinked by vanillin. This means these composites maintain the hydrophilic properties of CS to a significant extent, which is helpful to facilitate cell attachment and growth. Moreover, we believe that the size and shape of the composite microspheres are stable while allowing the cells to proliferate during the cell culture period for tissue engineering applications.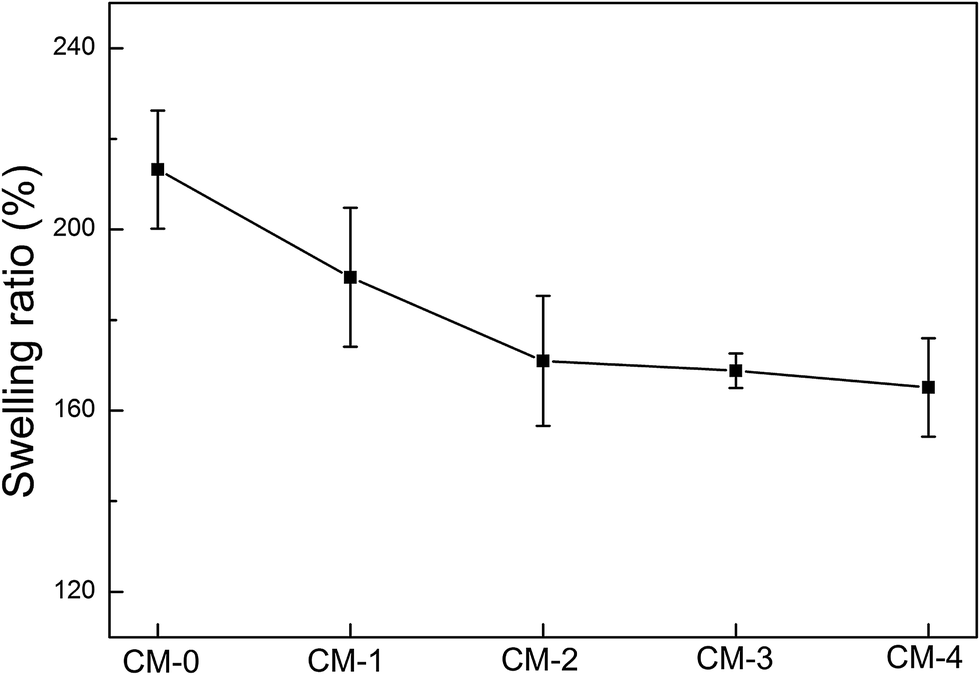 | ||
| Fig. 6 The swelling property of CS microspheres and various n-HA/CS composite microspheres. | ||
3.6 In vitro biodegradation studies
The biodegradation behavior has a great contribution to the long-term performance of tissue-engineered materials. It is well-known that n-HA is a biodegradable material. Besides, CS has been proved to be naturally degraded in vivo by lysozyme,46 which exists in various human body fluids and tissue. In our study, the in vitro biodegradation behaviors of various CS composite microspheres within 15 days are presented in Fig. 7. It shows that all fabricated microspheres have obvious biodegradability over time. The CM-0 was degraded marginally greater than the composite microspheres. With increase of n-HA content, the mass loss of these composites decreased slightly. This means the incorporation of n-HA into the CS network is a potential approach to control the biodegradation behavior. After 15 days of in vitro test, the maximum mass loss of CM-0 and the composites (CM-4) were reached by ∼18.61% and ∼12.16%, respectively. The above results reveal that the composite microspheres exhibit insignificant change. The reason for that is due to high degree of deacetylation (90%) of CS because previous studies have reported that the degree of lysozyme-dependent degradation was related to the deacetylation degree of CS.47 Overall, the composite microspheres could be degraded at a sustained and controlled rate, thus acting as a promising template to allow tissue formation.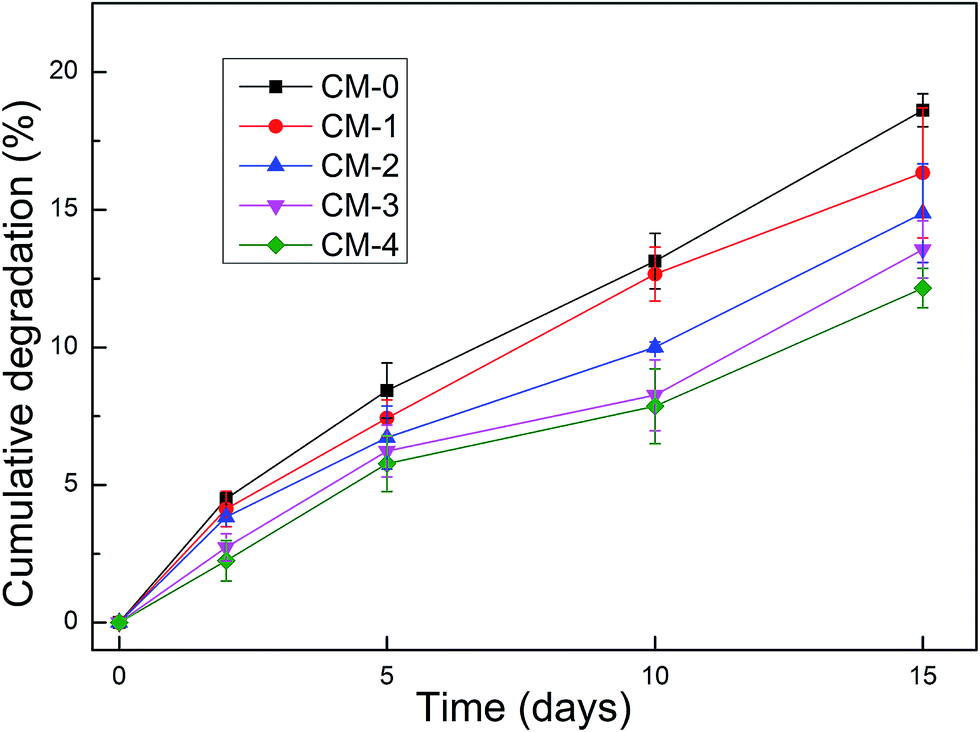 | ||
| Fig. 7 Biodegradation behaviors of CM-0 and the composite micropheres in 3 mg mL−1 lysozyme solution (pH = 7.4) at 37 °C within 15 days. | ||
3.7 Cell attachment and adhesion
Cell attachment and adhesion often occur in the first phase of material/cells interactions, which will affect the capacity of cells to proliferate on the material.48 Fig. 8 shows the morphology of cells adhered on the surface of microspheres. After seeded for 4 days, the MG-63 cells cultured on all microspheres and the blank control are well attached and spread with rich of filopodia (Fig. 8A–F). On day 7, the cells grown on microspheres (Fig. 8H–L) show much more filopodia than the control group (Fig. 8G), and present the formation of extracellular matrix. The extracellular matrix is thought to be an essential cell attachment component.49 During cell attachment, the cells could produce some proteins like vinculin to develop the extracellular matrix and subsequently attach to the substrate.50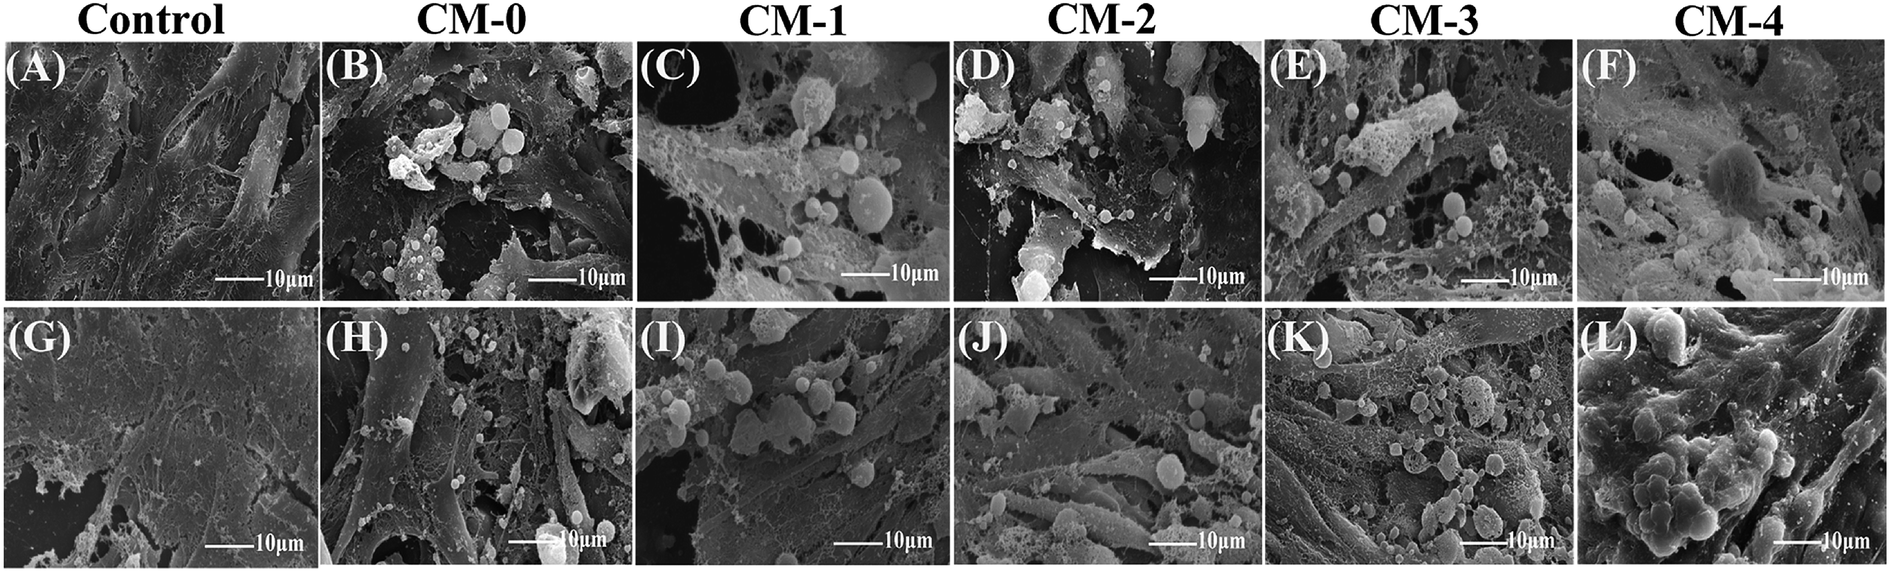 | ||
| Fig. 8 SEM micrographs of MG-63 cells cultured on CM-0, CM-1, CM-2, CM-3, CM-4 and the control group for 4 and 7 days. | ||
Unlike CM-0, CM-1, CM-2 and CM-3, some microspheres of CM-4 sample are almost completely wrapped by cells and extracellular matrix (Fig. 8L), suggesting a positive role of n-HA filler in promoting cells adhesion on composite microspheres. The long and fine cytoplasmic extensions together with large lamellipodia imply excellent adhesion and homogeneous colonization. In addition, scanning electron micrographs of the cells show a continuous monolayer with distinguishable microvilli (Fig. 8I–L). This should be strongly related to the good affinity of n-HA to osteogenic cells. The high surface energy of n-HA greatly influences the initial cell attachment and spreading of human osteoblastic cells at the surface.51,52 Particularly, the enhancement of surface polar components of materials may promote osteoblastic cell attachment. Moreover, surface roughness can improve surface wetting properties, to affect cell attachment directly via enhanced formation of focal contacts or indirectly through selective adsorption of serum proteins required for cell attachment.53 Consequently, these factors make the cell–cell interactions on the microspheres more significant and thus favorable in the delivery of cellular aggregates. This function of delivering cells is considered ideal to achieve native-tissue equivalents by ex vivo culturing, as well as to help complete tissue formation after implantation. Therefore, the composite microspheres with higher n-HA content is better for cell attachment and adhesion, that may support cell proliferation and bone regeneration.
3.8 Cell viability and proliferation
The viability of cells is generally visualized using fluorescent live/dead assay (Fig. 9A). On day 4, live cells layer (green fluorescence) can be observed from all culture groups, which reveals that the CS matrix and n-HA filler have no negative effect on the cytocompatibility. With increase of incubation time, more and more live cells are present on day 7, suggesting that the cells proliferate well on the composite microspheres. Besides, the fluorescence images also exhibit many filopodia, demonstrating commendable cells attachment on the microspheres, which is coincident with the results of SEM micrographs in Fig. 8.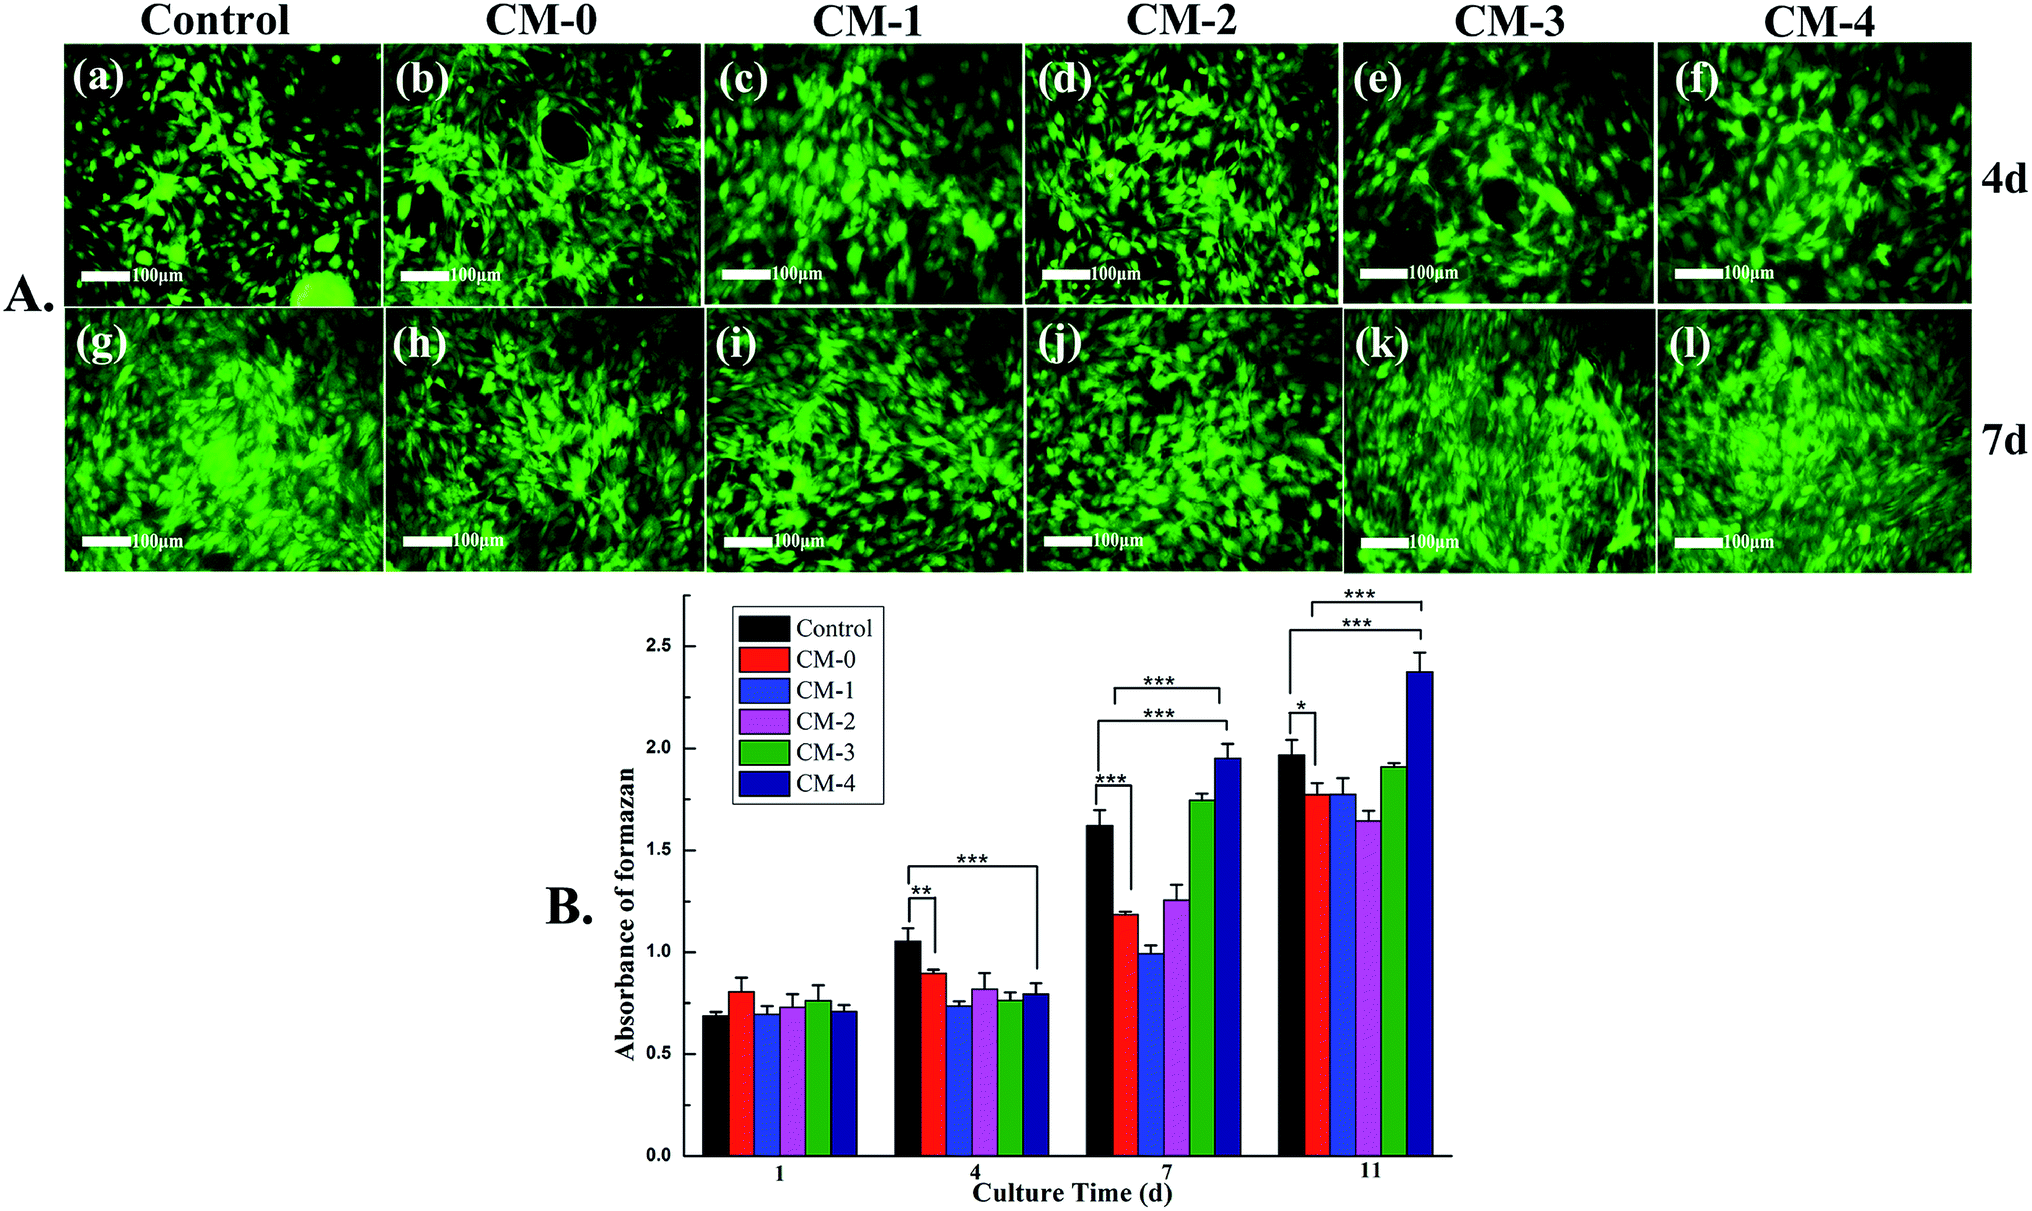 | ||
| Fig. 9 (A) Fluorescence images of MG-63 cells on control group and various microspheres after being cultured for 4 (a–f) and 7 days (g–l) determined by live/dead assay. (B) Proliferation of MG-63 cells after cultured for 1, 4, 7 and 11 day(s) on control group and various microspheres. *(p < 0.05), **(p < 0.01) and ***(p < 0.001) indicate statistical significance. | ||
The cell proliferation results via MTT assay are showed in Fig. 9B. There is no statistically significant difference between each group on day 1. However, with the increase of culture time, the proliferation of cells shows a continued growing trend for all microsphere groups and the control group. Although the proliferation on control group and CM-0 is higher than those composite microspheres on day 4, the proliferation on CM-4 is more rapid from day 7. The result indicates that the CM-4 microspheres with higher n-HA content can exhibit better cell adhesion and proliferation, which should be preferentially chosen for future in vivo investigation and application.
4. Conclusion
The n-HA/CS composite microspheres with small size and narrow particle size distribution were successfully prepared in a double emulsion system via vanillin crosslinking. They possessed good swelling property to keep their size and shape stable, and can be easy to inject into irregular bone defects. Moreover, they can be degraded in a sustained and controlled manner while supporting cells growth. The cell culture illustrated good cytocompatibility of the composite microspheres, and a positive role in supporting cells adhesion and proliferation. The CS composite microspheres with about 29.57 wt% n-HA fillers presented better cell adhesion, viability and proliferation. In conclusion, the optimized n-HA/CS composite microspheres can provide a promising injectable template to aid cell proliferation for bone tissue engineering.Acknowledgements
The authors appreciate financial support from China NSFC Fund (No. 31370971), National 863 Project (No. 2015AA033702) and China 863 Project (2013AA032203).References
- J. Liuyun, X. Chengdong, J. Lixin and X. Lijuan, Compos. Sci. Technol., 2014, 93, 61–67 CrossRef.
- S. C. Chao, M. J. Wang, N. S. Pai and S. K. Yen, Mater. Sci. Eng., C, 2015, 57, 113–122 CrossRef CAS PubMed.
- X. Hu, H. Shen, F. Yang, X. Liang, S. Wang and D. Wu, Appl. Surf. Sci., 2014, 292, 764–772 CrossRef CAS.
- R. A. Perez, J. E. Won, J. C. Knowles and H. W. Kim, Adv. Drug Delivery Rev., 2013, 65, 471–496 CrossRef CAS PubMed.
- H. Gangurde, N. Chavan, A. Mundada, D. Derle and S. Tamizharasi, J. Young Pharm., 2011, 3, 9–14 CrossRef CAS PubMed.
- H. N. Lim, N. M. Huang and C. H. Loo, J. Non-Cryst. Solids, 2012, 358, 525–530 CrossRef CAS.
- M. D. Buschmann, A. Merzouki, M. Lavertu, M. Thibault, M. Jean and V. Darras, Adv. Drug Delivery Rev., 2013, 65, 1234–1270 CrossRef CAS PubMed.
- A. Shavandi, D. Bekhit Ael, Z. Sun, A. Ali and M. Gould, Mater. Sci. Eng., C, 2015, 55, 373–383 CrossRef CAS PubMed.
- A. Anitha, S. Sowmya, P. T. S. Kumar, S. Deepthi, K. P. Chennazhi, H. Ehrlich, M. Tsurkan and R. Jayakumar, Prog. Polym. Sci., 2014, 39, 1644–1667 CrossRef CAS.
- Q. Wang, J. Wang, Q. Lu, M. S. Detamore and C. Berkland, Biomaterials, 2010, 31, 4980–4986 CrossRef CAS PubMed.
- Q. Yang, F. Dou, B. Liang and Q. Shen, Carbohydr. Polym., 2005, 59, 205–210 CrossRef CAS.
- E. Campos, P. Coimbra and M. H. Gil, Polym. Bull., 2012, 70, 549–561 CrossRef.
- F. L. Mi, Y. C. Tan, H. F. Liang and H. W. Sung, Biomaterials, 2002, 23, 181–191 CrossRef CAS PubMed.
- B. Max, J. M. Salgado, S. Cortes and J. M. Dominguez, J. Agric. Food Chem., 2010, 58, 1909–1917 CrossRef CAS PubMed.
- S. Walke, G. Srivastava, M. Nikalje, J. Doshi, R. Kumar, S. Ravetkar and P. Doshi, Carbohydr. Polym., 2015, 128, 188–198 CrossRef CAS PubMed.
- Q. Zou, J. Li and Y. Li, Int. J. Biol. Macromol., 2015, 79, 736–747 CrossRef CAS PubMed.
- L. Kong, Y. Gao, G. Lu, Y. Gong, N. Zhao and X. Zhang, Eur. Polym. J., 2006, 42, 3171–3179 CrossRef CAS.
- X. Li, K. Nan, S. Shi and H. Chen, Int. J. Biol. Macromol., 2012, 50, 43–49 CrossRef CAS PubMed.
- J. Li, D. Zhu, J. Yin, Y. Liu, F. Yao and K. Yao, Mater. Sci. Eng., C, 2010, 30, 795–803 CrossRef CAS.
- C. Y. Tay, W. Fang, M. I. Setyawati, S. L. Chia, K. S. Tan, C. H. Hong and D. T. Leong, ACS Appl. Mater. Interfaces, 2014, 6, 6248–6256 CAS.
- L. Li, Y. Zuo, Q. Zou, B. Yang, L. Lin, J. Li and Y. Li, ACS Appl. Mater. Interfaces, 2015, 7, 22618–22629 CAS.
- J. Lee and H.-S. Yun, J. Mater. Chem. B, 2014, 2, 1255 RSC.
- M. Xie, M. O. Olderoy, J. P. Andreassen, S. M. Selbach, B. L. Strand and P. Sikorski, Acta Biomater., 2010, 6, 3665–3675 CrossRef CAS PubMed.
- M. Stroescu, A. Stoica-Guzun, G. Isopencu, S. I. Jinga, O. Parvulescu, T. Dobre and M. Vasilescu, Food Hydrocolloids, 2015, 48, 62–71 CrossRef CAS.
- I. Adekogbe and A. Ghanem, Biomaterials, 2005, 26, 7241–7250 CrossRef CAS PubMed.
- V. P. Mantripragada and A. C. Jayasuriya, Mater. Sci. Eng., C, 2014, 42, 506–516 CrossRef CAS PubMed.
- J. H. Lin, C. K. Chen, S. P. Wen and C. W. Lou, Mater. Sci. Eng., C, 2015, 52, 111–120 CrossRef CAS PubMed.
- T. M. Brenza, L. K. Petersen, Y. Zhang, L. M. Huntimer, A. E. Ramer-Tait, J. M. Hostetter, M. J. Wannemuehler and B. Narasimhan, Pharm. Res., 2015, 32, 1368–1382 CrossRef CAS PubMed.
- M. Tallawi, J. Biomed. Mater. Res., Part B, 2011, 96, 261–266 CrossRef PubMed.
- X. Zou, X. Zhao, L. Ye, Q. Wang and H. Li, J. Ind. Eng. Chem., 2015, 21, 1389–1397 CrossRef CAS.
- D. Sajan, Y. Erdogdu, T. Kuruvilla and I. H. Joe, J. Mol. Struct., 2010, 983, 12–21 CrossRef CAS.
- H. Peng, H. Xiong, J. Li, M. Xie, Y. Liu, C. Bai and L. Chen, Food Chem., 2010, 121, 23–28 CrossRef CAS.
- J. P. Quiñones, Y. C. García, H. Curiel and C. P. Covas, Carbohydr. Polym., 2010, 80, 915–921 CrossRef.
- C. Kojima, K. Watanabe, T. Nagayasu, Y. Nishio, R. Makiura and A. Nakahira, J. Ind. Eng. Chem., 2013, 15, 1–11 Search PubMed.
- K. Madhumathi, K. T. Shalumon, V. V. D. Rani, H. Tamura, T. Furuike, N. Selvamurugan, S. V. Nair and R. Jayakumar, Int. J. Biol. Macromol., 2009, 45, 12–15 CrossRef CAS PubMed.
- C.-C. Ding, S.-H. Teng and H. Pan, Mater. Lett., 2012, 79, 72–74 CrossRef CAS.
- S. Wang, D. H. Kempen, M. J. Yaszemski and L. Lu, Biomaterials, 2009, 30, 3359–3370 CrossRef CAS PubMed.
- A. Yunoki, E. Tsuchiya, Y. Fukui, A. Fujii and T. Maruyama, ACS Appl. Mater. Interfaces, 2014, 6, 11973–11979 CAS.
- S. V. Dorozhkin, J. Mater. Sci., 2007, 42, 1061–1095 CrossRef CAS.
- W. I. Abdel-Fattah, A. S. Sallam, A. M. Diab and G. W. Ali, Mater. Sci. Eng., C, 2015, 54, 158–168 CrossRef CAS PubMed.
- K. Muraleedharan, P. Alikutty, V. M. Abdul Mujeeb and K. Sarada, J. Polym. Environ., 2014, 23, 1–10 CrossRef.
- W. Ji, F. Yang, H. Seyednejad, Z. Chen, W. E. Hennink, J. M. Anderson, J. J. van den Beucken and J. A. Jansen, Biomaterials, 2012, 33, 6604–6614 CrossRef CAS PubMed.
- D. Gogoi, A. G. Shanmugamani, S. V. S. Rao, T. Kumar and P. K. Sinha, J. Radioanal. Nucl. Chem., 2013, 298, 337–344 CrossRef CAS.
- H. Liu, J. Mao, K. Yao, G. Yang, L. Cui and Y. Cao, J. Biomater. Sci., Polym. Ed., 2004, 15, 25–40 CrossRef CAS PubMed.
- W. W. Thein-Han and R. D. Misra, Acta Biomater., 2009, 5, 1182–1197 CrossRef CAS PubMed.
- B. M. Chesnutt, A. M. Viano, Y. Yuan, Y. Yang, T. Guda, M. R. Appleford, J. L. Ong, W. O. Haggard and J. D. Bumgardner, J. Biomed. Mater. Res., Part A, 2009, 88, 491–502 CrossRef PubMed.
- D. Ren, H. Yi, W. Wang and X. Ma, Carbohydr. Res., 2005, 340, 2403–2410 CrossRef CAS PubMed.
- J. Chen, Y. Luo, L. Hong, Y. Ling, J. Pang, Y. Fang, K. Wei and X. Gao, J. Biomed. Mater. Res., 2011, 22, 547–555 CAS.
- R. O. Hynes and R. O. Hynes, Cell, 1992, 69, 11–25 CrossRef CAS PubMed.
- A. Aryaei and A. C. Jayasuriya, Mater. Sci. Eng., C, 2015, 52, 129–134 CrossRef CAS PubMed.
- G. G. Niederauer, T. D. Mcgee, J. C. Keller and R. S. Zaharias, Biomaterials, 1994, 15, 342–352 CrossRef CAS PubMed.
- S. A. Redey, M. Nardin, D. Bernache-Assolant, C. Rey, P. Delannoy, L. Sedel and P. J. Marie, J. Biomed. Mater. Res., 2000, 50, 353–364 CrossRef CAS PubMed.
- I. D. de Souza, M. A. Cruz, A. N. de Faria, D. C. Zancanela, A. M. Simao, P. Ciancaglini and A. P. Ramos, Colloids Surf., B, 2014, 118, 31–40 CrossRef CAS PubMed.
| This journal is © The Royal Society of Chemistry 2016 |