
Effect of dual-doping on the thermoelectric transport properties of CaMn1−xNbx/2Tax/2O3†
Rapaka S. C. Bose and
Abanti Nag*
Materials Science Division, CSIR-National Aerospace Laboratories, Bangalore 560017, India. E-mail: abanti@nal.res.in
First published on 23rd May 2016
Abstract
The dual-substituted CaMn1−xNbx/2Tax/2O3 is synthesized by solid-state reaction and it's crystal structure-thermoelectric property relationship is established. Rietveld refinement confirms the formation of a single phase orthorhombic structure with a gradual increase of cell parameters and bond lengths with doping level. The electrical resistivity (ρ) shows non-metal like temperature dependence. The ρ-value decreases with increasing doping level indicating an increase in charge-carrier concentration through formation of Mn3+ ions with e1g electron in the Mn4+ matrix of CaMn1−xNbx/2Tax/2O3. The shallow region observed around 500 K in the resistivity curve is interpreted as the formation of local charge-ordering clusters due to the presence of oxygen vacancies in CaMn1−xNbx/2Tax/2O3. The Seebeck coefficient initially decreases with temperature as expected from increasing charge carrier concentration. Above 600 K, the Seebeck coefficient increases with temperature as oxygen vacancies start playing the dominant role. The relatively low thermal conductivity of CaMn1−xNbx/2Tax/2O3 results from the damping of local vibration through substitution of heavier ions of Nb and Ta as well as crystallographic distortion. The dual-substituted CaMn1−xNbx/2Tax/2O3 shows a maximum power factor of 200 μW m−1 K−2 and dimensionless figure-of-merit (ZT) of 0.15 at x = 0.04, arising from low electrical resistivity of 15 mΩ cm, a moderate Seebeck coefficient of −176 μV K−1 and low thermal conductivity of 1.2 W m−1 K−1.
Introduction
The widespread strategies for the production of electrical energy that rely on fossil fuels are having a negative impact on the environment. The global trend of increasing demand for energy requires alternative and environmentally benign sources of energy that are adequately competitive with conventional technologies.1–3 Alternative renewable energy sources such as biomass, hydropower, wind, geothermal or solar energy, are becoming an important support to compensate limited fossil fuel resources. Among the above mentioned energy-conversion technologies, there has been a resurgence of interest in thermoelectric as the major part of the world's overall energy resources such as solar radiation, geothermal heat or industrial and automobile exhaust are discharged as waste heat into the environment without practical application. Therefore, technologies for harnessing the dissipating heat from various sources are highly desired. Direct thermoelectric power conversion that excludes any mechanical intermediate stages, is one of the most promising aspects to make potential contributions towards lowering greenhouse gas emissions and providing cleaner form of energy.4–6Thermoelectric power generation requires three major pieces of technology: thermoelectric materials, thermoelectric modules and systems that interface with the heat source. Thermoelectric materials generate electricity while in a temperature gradient.5 The key parameter that defines the thermoelectric materials is the ‘dimensionless figure of merit’, ZT, which is derived from the combination of three physical properties; thermal conductivity (κ), electrical conductivity (σ) and Seebeck coefficient (S), ZT = (S2σ/κ)T, where T is the temperature.5 A thermoelectric module converts heat (Q) into electrical power (P) with efficiency η. The efficiency of a thermoelectric generator depends predominantly on the temperature difference ΔT = TH − TC across the device and is typically expressed as:7

It is apparent from the above expression that not only the ZT value but also the maximum temperature plays a primary role in determining the efficiency of the thermoelectric devices. In this respect, oxide materials have advantages. Although the oxide based thermoelectric materials have slightly lower ZT compared to that of the conventional metallic alloys, the deficiency is highly compensated because of the capability of the oxides at elevated temperatures. Further, oxide materials are cost effective, chemically and thermally stable at elevated temperature in air, non-toxic and will be free from hazardous Pb and expensive Te in comparison with the conventional Bi–Te or Pb–Te based thermoelectric alloys.8–11
Thermoelectric transition metal oxides can be categorized in four different classes based on their crystal structure: (i) wide band-gap semiconductor oxides, (ii) perovskite based oxides, (iii) layered cobalt oxides and (iv) layered oxychalcogenides.12 Among the transition metal oxides, perovskite manganites based on CaMnO3 is an antiferromagnetic Mott–Hubbard insulator exhibits large electrical resistivity and high thermopower both at room temperature and at higher temperatures. CaMnO3 is well known for becoming semiconductor to metallic at narrow doping levels as it is at the edge of Meta-Insulator (M-I) transition.13–15 Nominal electron doping both at A (Ca2+) and B-sites (Mn4+) of CaMnO3 results drastic decrease of electrical resistivity; keeping relatively high thermopower. The promising thermoelectric performances of CaMnO3 is reported in literature through substitution on A-site16–28 by rare-earth ions, Y3+ and Bi3+ as well as on B-site29–34 by Nb5+, Ta5+, Mo6+ and W5+. It is reported that, among the A-site doped samples Yb3+ doped CaMnO3 shows highest ZT;17,18 whereas regarding B-site doping, Nb-doped samples have the highest figure-of-merit.30,32 Recently, we have reported improved thermoelectric performances in dual-substituted Ca1−xLnxMn1−xNbxO3 (Ln = Gd, Yb and Lu).35,36 In Ca1−xLnxMn1−xNbxO3, the substitution at Ca-site by trivalent rare-earth ions along with Nb5+ at Mn-site drastically modifies the thermoelectric properties. The enhanced lattice distortion in Ca1−xLnxMn1−xNbxO3 arises from the formation of Mn3+ ions leading to formation of oxygen vacancies.
It is reported in the literature that, the doping of CaMnO3 at Mn sites with pentavalent and hexavalent d0 elements of NbV, TaV, WVI, MoVI modifies the electrical resistivity behavior of this phase, by significantly reducing the electrical resistivity both at room temperature and high temperature as the doping element content increases.29,30,32–34 The introduction of a cation with a valency higher than (IV) such as NbV or TaV on the manganese sites of CaMnO3 induces the formation of Mn3+ (t32ge1g) species in the Mn4+ (t32ge0g) matrix according to the ideal formula of CaMnIV1−2xMnIIIx(NbV,TaV)xO3. In this paper, we investigated the effect of dual-substitution at B-site of CaMnO3 by two pentavalent ions of Nb5+ and Ta5+; CaMn1−xNbx/2Tax/2O3 (0.01 ≤ x ≤ 0.08) to establish a structure-property correlation.
Experimental
The dual-substituted polycrystalline samples of CaMn1−xNbx/2Tax/2O3 (0.01 ≤ x ≤ 0.08) were synthesized by the conventional high temperature solid–state reactions. The starting materials were high-purity CaCO3, MnO2, Nb2O5 and Ta2O5 powders from Alfa Aesar. Initially, the stoichiometric ratio of these powders were mixed well in ball mill for 2 h, calcined at 1000 °C and annealed at 1200 °C for several hours with intermediate grinding. The annealed powders were reground and pressed into pellets. The pellets were sintered in air at 1325 °C for 10 h and slowly cooled to room temperature. The phase composition and crystal structure of CaMn1−xNbx/2Tax/2O3 were determined by powder X-ray diffraction (XRD). A Rigaku Ultima IV X-ray diffractometer was used to record powder XRD patterns. For structure refinement, XRD data were collected in the 2θ range of 5–70° with a step size of 0.01°. Rietveld refinement of powder XRD data were carried out by least-squares refinement method and were refined for lattice parameters, scale factor, background (shifted Chebyshev background function), pseudo-Voigt profile function (U, V, W, and X), atomic coordinates and isothermal temperature factors (Uiso) using GSAS program.37 SEM and EDX analyses were carried out in LEO Electron microscopy from Oxford Instruments. The electrical resistivity (ρ) and Seebeck coefficient (S) measurements were carried out on a bar-shaped sample (2 × 2 × 13 mm3) between 300 and 950 K at ambient pressure using ULVAC RIKO ZEM 3. The thermal conductivity (κ) measurements were carried out on a disk-shaped sample (2 mm thickness × 12 mm diameter) by laser flash technique using FLASHLINE 5000 thermal conductivity system.Results and discussions
Fig. 1(a–d) shows scanning electron micrographs of as-sintered samples of CaMn1−xNbx/2Tax/2O3 (0.01 ≤ x ≤ 0.08). The SEM micrograph exhibits the grains of irregular lumps with rounded corners and smooth grain interfaces. It is observed from the micrograph that no substantial morphological changes occurred due to Nb and Ta dual-substitution in CaMnO3. The grain size distribution is narrow, ranging from 3–5 μm irrespective of the concentration of the substituent. However, on closer look it is observed that the level of porosity decreases with increasing the dopant concentration of CaMn1−xNbx/2Tax/2O3, indicating grain growth with clear grain boundaries.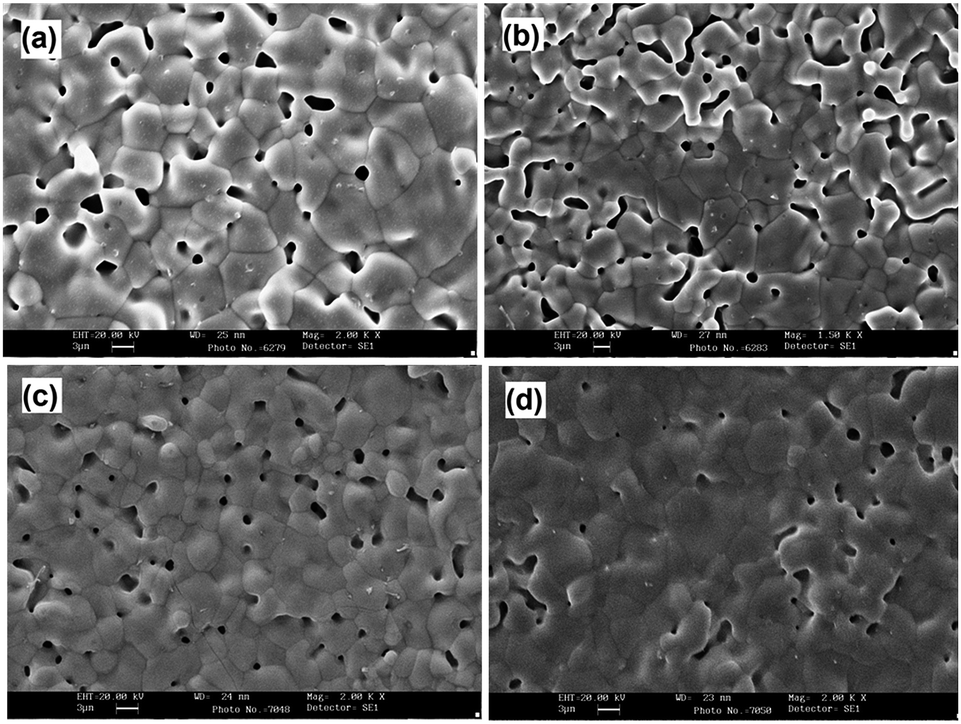 | ||
| Fig. 1 SEM micrographs showing of as sintered pellets of (a) CaMn0.98Nb0.01Ta0.01O3, (b) CaMn0.96Nb0.02Ta0.02O3, (c) CaMn0.94Nb0.03Ta0.03O3 and (d) CaMn0.92Nb0.04Ta0.04O3. | ||
Fig. 2(a–e) shows the XRD pattern of CaMn1−xNbx/2Tax/2O3 (0.01 ≤ x ≤ 0.08) compositions that indicate the formation of single phase orthorhombic perovskite structure with Pnma space group. Rietveld refinement is done considering orthorhombic perovskite structure (ao ≈ co ≈ ac√2 and bo ≈ 2ac where o and c stands for orthorhombic and cubic, respectively) with Pnma space group (Fig. 2(a–e)). The refinement shows that the pattern can be completely indexed as GdFeO3-type orthorhombic perovskite structure38 (Fig. 2(a–e)). Table 1 summarizes the refined lattice parameters, R-factors, bond lengths and bond angles. The unidentified peak at 2θ = 33° with low intensity (<1%) belongs to the minor phase of orthorhombic CaMn2O4 with Pmab space group (JCPDS file no. 76-0516). The variation of the refined lattice parameters; a, b and c and the cell volume V with dopant concentration for CaMn1−xNbx/2Tax/2O3 system are displayed in Fig. 2(f) and summarizes in Table 1. On closer look on Fig. 2(f) and Table 1, it is observed that, the lattice parameters and cell volume increase with increasing the Na and Ta concentration in CaMn1−xNbx/2Tax/2O3 compositions. This observation can be well understood based on the fact that the resultant ionic radius of the B-site substituent; NbVI5+ (0.640 Å) and TaVI5+ (0.640 Å), are much larger than that of MnVI4+ (0.530 Å).39 The relationship of the lattice parameters of orthorhombic perovskite; ao, bo/√2 and co can provide a measure of the distortion of the unit cell of CaMn1−xNbx/2Tax/2O3. There are two types of orthorhombic perovskite structure; the O-type orthorhombic structure, characterized by the relationship c ≤ b/√2 ≤ a, exists when the degree of lattice deformation is relatively small, while, the O′-type orthorhombic structure, with b/√2 ≤ c ≤ a, exists in the case of enhanced lattice deformation.40 In the present paper, the relationship of lattice parameters of CaMn1−xNbx/2Tax/2O3 follows c ≤ b/√2 ≤ a indicating O-type orthorhombic structure with relatively less lattice deformation (Table 1). Further, the distortion from ideal perovskite structure can be demonstrated by the evolution of Goldsmith tolerance factor (t). Goldsmith tolerance factor (t) for ABO3-type perovskite is calculated from the following equation where r represents the ionic radii of respective ions.40

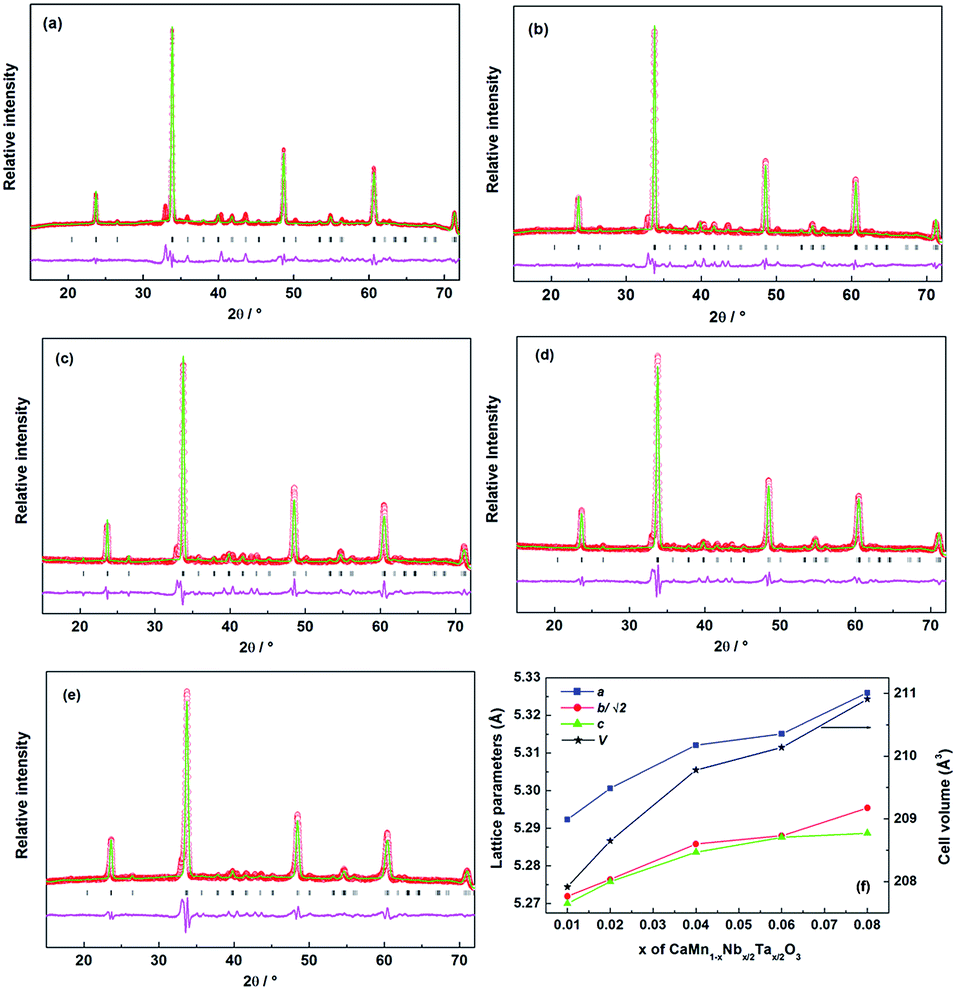 | ||
| Fig. 2 Rietveld refinements from powder XRD data of (a) CaMn0.99Nb0.005Ta0.005O3, (b) CaMn0.98Nb0.01Ta0.01O3, (c) CaMn0.96Nb0.02Ta0.02O3, (d) CaMn0.94Nb0.03Ta0.03O3, (e) CaMn0.92Nb0.04Ta0.04O3 and (f) lattice parameters and cell volume of the CaMn1−xNbx/2Tax/2O3 (0.01 ≤ x ≤ 0.08) as a function of x as derived from PXRD data. | ||
| CaMn1−xNbx/2Tax/2O3 | |||||
|---|---|---|---|---|---|
| x = 0.01 | x = 0.02 | x = 0.04 | x = 0.06 | x = 0.08 | |
| a (Å) | 5.2923(2) | 5.3006(3) | 5.3121(4) | 5.3151(4) | 5.3260(6) |
| b (Å) | 7.4545(5) | 7.4609(4) | 7.4742(6) | 7.4773(6) | 7.4877(8) |
| c (Å) | 5.2700(3) | 5.2758(2) | 5.2836(4) | 5.2876(4) | 5.2887(6) |
| b/√2 | 5.2719 | 5.2764 | 5.2858 | 5.2880 | 5.2954 |
| V (Å3) | 207.913(7) | 208.648(1) | 209.779(3) | 210.141(2) | 210.91(4) |
| Rwp | 3.60 | 3.39 | 3.90 | 3.97 | 4.28 |
| Rp | 2.35 | 2.26 | 2.52 | 2.45 | 2.64 |
| RF | 11.5 | 12.40 | 12.16 | 11.33 | 10.57 |
| χ2 | 4.55 | 4.65 | 4.26 | 5.21 | 4.97 |
| 〈Mn–O〉 | 1.899 | 1.920 | 1.944 | 1.959 | 1.965 |
| Mn–O1–Mn (°) | 152.391(2) | 150.919(7) | 150.586(3) | 150.586(3) | 150.179(4) |
| Mn–O2–Mn (°) | 162.194(2) | 163.645(5) | 165.696(6) | 164.649(1) | 165.105(7) |
| t | 0.9286 | 0.9280 | 0.9270 | 0.9259 | 0.9252 |
The tolerance factor is a structural parameter that describes the geometrical distortion for ABO3-type perovskite. An ideal perovskite structure normally describes by t of 1. The shifting of t towards t < 1 indicates enhanced geometric distortion in the perovskite lattice. Table 1 listed the tolerance factor of CaMn1−xNbx/2Tax/2O3 system. The tolerance factor less than unity and the decrease in t value with doping level indicates enhancement of geometric distortion in CaMn1−xNbx/2Tax/2O3 system. Table 1 also represents the bond lengths and bond angles for (Mn,Nb,Ta)O6 octahedral. The average bond length increases with increasing the Nb/Ta concentration. The increase in Mn–O bond lengths clearly indicate the increase of Mn3+ ions and decrease of Mn4+ ions in the dual-substituted CaMnO3 matrix as ionic radii of Mn3+ (0.645 Å) is larger than Mn4+ (0.530 Å). The significant lowering of octahedral bond angle from linearity (180°) induces tilting of (Mn,Nb,Ta)O6 that results in Mn–O–Mn zig–zag chain in CaMn1−xNbx/2Tax/2O3. This structural distortion arises from electron doping in the form of substitution of pentavalent Nb and Ta in the tetravalent Mn-sites of CaMnO3.
The temperature dependence of electrical resistivity (ρ) of CaMn1−xNbx/2Tax/2O3 (0.01 ≤ x ≤ 0.08) is shown in Fig. 3(a). It is reported in the literature that undoped CaMnO3 shows typical semiconductor like behaviour (dρ/dT < 0) with the resistivity as high as 0.2 Ω.cm at 1000 K (Fig. 3(b) inset). The dual-substituted CaMn1−xNbx/2Tax/2O3 also shows non-metallic nature of transport behaviour at the entire temperature range of 300 to 1000 K. However the ρ values of Nb and Ta dual-substituted CaMnO3 are one order of magnitude lower than that of undoped CaMnO3. The resistivity curves of CaMn1−xNbx/2Tax/2O3 represent characteristic of semiconductor samples in which resistivity decreases with temperature showing the values ρ1000K = 24 mΩ cm for x = 0.01 and ρ1000K = 12 mΩ cm for x = 0.08. The remarkable reduction of electrical resistivity can be attributed to the formation of Mn3+ (t32ge1g) cation in the Mn4+ (t32ge0g) matrix of CaMnO3 due to dual-substitution of Nb5+ and Ta5+. This observation is further supported from the crystallographic analyses that the increase in Mn–O bond lengths with dual-substitution is directly related to the increase of Mn3+ ions as ionic radius of Mn3+ is larger than Mn4+ ions. Based on the valence equilibrium, the formation of an appreciable concentration of Mn3+ introduces free electrons in the eg orbital. The electrons in the eg levels act as a charge carrier in Mn3+–O–Mn4+ framework and reduce ρ through movement of electron by hopping mechanism. On closer look of the resistivity curve, it is observed that there is a shallow region around 500 K. To understand the origin of the shallow region in the resistivity curve, two singly doped compositions of CaMn0.96Nb0.04O3 and CaMn0.92Ta0.08O3 are prepared with high dopant concentration of Nb and Ta, respectively. The resistivity curves of singly doped CaMnO3 show similar semiconductor like behaviour with shallow region around 500 K (Fig. 3(b)). Therefore, the appearance of shallow region is independent of the nature of dopant rather appearing due to high level of electron doping in the CaMnO3 system. Fig. S1 and S2† show the electrical resistivity as a function of temperature for x ≥ 0.06 of CaMn1−xNbx/2Tax/2O3 for both heating and cooling cycles. Although the shallow region around 500 K is more dominant in the heating curve the same is also present in the cooling curve indicating the behavior inherent in nature. Further in the case of CaMn1−xNbx/2Tax/2O3 system, although there is a decrease of resistivity with increasing the concentration of Nb and Ta, the change of resistance is very marginal above x ≥ 0.04. It is well known that the doping level dependence of resistivity is not linear when the doping level exceeds the optimal concentration as other factors starts playing role apart from charge carrier concentrations.41–43 It is well known that the electron doping CaMnO3 system generates oxygen vacancies that acts as a defect centre.44–46 When the electron concentration reaches a certain magnitude, the defect centre may cause the local charge ordering in the system that may be responsible for the anomaly in the resistivity values. The low dopant concentration introduce electrons to the eg level of Mn ions giving rise to electronic delocalization and consequent reduction in resistivity, however, at higher dopant concentration the local charge-ordering clusters form, resulting in the localization of electrons and followed by anomaly in resistivity curve. Therefore, for higher concentration of Nb and Ta the increase in resistivity at 500 K is very prominent than the lower Nb and Ta doping. After sudden increase of few milliohms resistivity saturates and results in the shallow region at the resistivity curve.
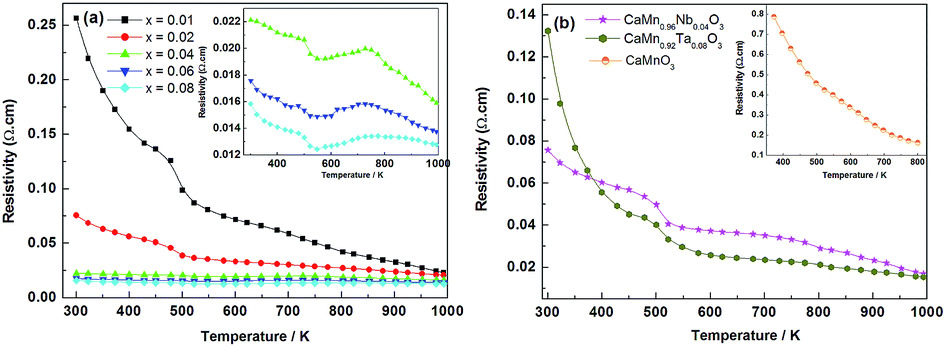 | ||
| Fig. 3 Temperature dependence of electrical resistivity of (a) CaMn1−xNbx/2Tax/2O3 (0.01 ≤ x ≤ 0.08) and (b) singly doped CaMn0.96Nb0.04O3 and CaMn0.92Nb0.08O3. Inset (a) shows the variation of ρ(T) with x for CaMn1−xNbx/2Tax/2O3 (0.04 ≤ x ≤ 0.08). | ||
Fig. 4(a) shows the temperature dependence of thermopower (S) of CaMn1−xNbx/2Tax/2O3 (0.01 ≤ x ≤ 0.08). The negative S value in the whole measured temperature range confirms that the dominant charge carriers are electrons. It was earlier observed for co-substituted Ca1−xLnxMn1−xNbxO3 system that Seebeck coefficient increases with increasing the temperature. In the case of Ca1−xLnxMn1−xNbxO3, where the incorporation of trivalent Ln at Ca-site and pentavalent Nb at Mn-site cause formation of mixed valency of Mn3+ (t32ge1g) and Mn4+ (t32ge0g), the theoretical thermopower value is expressed by the modified Heikes formula.47 The mathematical expression of modified Heikes formula is as follows that indicates the temperature independence of Seebeck coefficient at higher temperature.
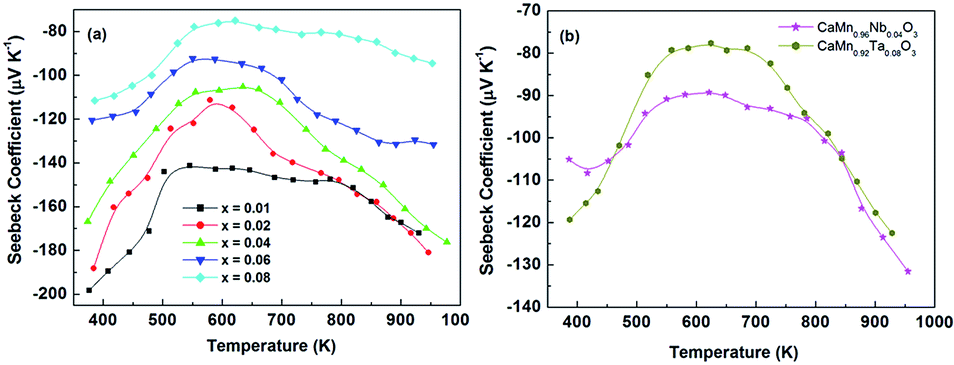 | ||
| Fig. 4 Temperature dependence of Seebeck coefficient of (a) CaMn1−xNbx/2Tax/2O3 (0.01 ≤ x ≤ 0.08) and (b) singly doped CaMn0.96Nb0.04O3 and CaMn0.925Nb0.08O3. | ||
| Expected electron concentration | SExpt (μV K−1) at 300 K | SExpt (μV K−1) at 600 K | SExpt (μV K−1) at 950 K | Ea (meV) |
|---|---|---|---|---|
| x = 0.01 | −200 | −142 | −172 | 113 |
| x = 0.02 | −187 | −113 | −182 | 94 |
| x = 0.04 | −167 | −106 | −176 | 55 |
| x = 0.06 | −120 | −93 | −131 | 51 |
| x = 0.08 | −110 | −76 | −94 | 51 |
The increase in Seebeck coefficient with temperature is reported for the off-stoichiometric CaMnO3−δ.44–46 The partial reduction of CaMnO3 causes formation of five-coordinated Mn3+ centres with oxygen vacancies that arranged in a zig–zag pattern along the ac-direction of the lattice. This results in formation of defect centres in the crystal system and thereby causes change in entropy with temperature. In the case of dual-substituted CaMn1−xNbx/2Tax/2O3, oxygen vacancy arises due to the incorporation of pentavalent Nb/Ta causing the reduction of Mn4+ and formation of Mn3+. According to the Kröger–Vink notation, the reduction of metal (Mn) site can be formulated as:  .
.
It is well known that the temperature dependence of S can be quantitatively explained by Mott's small polaron hopping transport model that can be simplified in two terms, the charge carrier concentration and the average change of system entropy.49 The presence of oxygen vacancy associated defect centres causes additional contribution on the entropy of the system on and above the electron carrier concentrations above 600 K result in increase in Seebeck coefficient as a function of temperature.
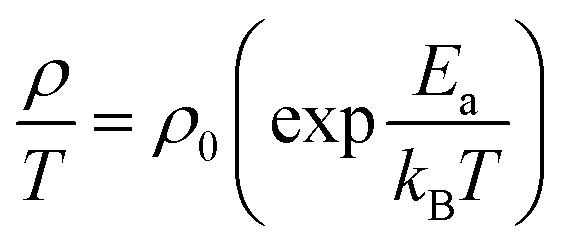
The transport mechanism of dual-substituted CaMn1−xNbx/2Tax/2O3 can be well understood according to Mott's adiabatic small polaron conduction model that describes the linear fit of ρ(T) curve. In this framework, ρ(T) shows linear relationship with the inverse of temperature and expressed as:49,50
 | ||
| Fig. 5 The linear curve fitting for ln(ρ/T) versus 1000/T plots for CaMn1−xNbx/2Tax/2O3 (0.01 ≤ x ≤ 0.08) series. | ||
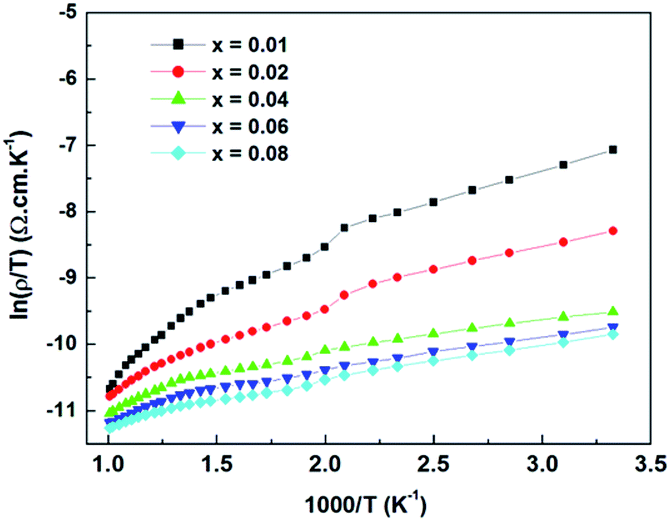
The power factor (S2/ρ) is calculated from the measured electrical resistivity and Seebeck coefficient of CaMn1−xNbx/2Tax/2O3 and plotted as a function of temperature in Fig. 6. The power factor as a function of temperature also shows similar behaviour as of electrical resistivity and thermopower. The power factor initially decreases, reached minimum at 600 K and then increases further. The larger power factor of 200 μW m−1 K−2 at 950 K is obtained for CaMn0.96Nb0.02Ta0.02O3 due to the relatively lower resistivity of 15 mΩ cm and moderate Seebeck coefficient of −176 μV K−1.
 | ||
| Fig. 6 The temperature dependence of the power factor (S2/ρ) for CaMn1−xNbx/2Tax/2O3 (0.01 ≤ x ≤ 0.08) series. | ||
Fig. 7(a) shows the temperature dependence of thermal conductivity (κ) of CaMn1−xNbx/2Tax/2O3 (0.02 ≤ x ≤ 0.06). The thermal conductivity was calculated from the following formula of κ = DCpd, where D = thermal diffusivity, Cp = specific heat capacity and d = density of the materials. It is reported in the literature that undoped CaMnO3 shows the thermal conductivity as high as 3.5 W m−1 K−1 at 300 K.54 Thermal conductivity of dual-substituted CaMn1−xNbx/2Tax/2O3 is much lower than that of CaMnO3. Fig. 7(a) shows that the κ decreases with temperature as well as with increasing co-doping showing lowest κ of 1.14 for CaMn0.94Nb0.03Ta0.03O3 at 973 K.
 | ||
| Fig. 7 The temperature dependence of the (a) thermal conductivity (κ) and (b) dimension less figure-of-merit (ZT) of CaMn1−xNbx/2Tax/2O3 (0.02 ≤ x ≤ 0.06). | ||
The comparison of thermal conductivity is carried out between the dual-substituted CaMn1−xNbx/2Tax/2O3 samples with densities around ∼3.90 g cm−3 as they were prepared by similar methodology. However, there is a decreasing trend of thermal conductivities that is observed with increasing the doping level and the effects related to that. The comparison has been tabulated at Table 3 where it clearly shows that the decrease in thermal conductivity from κ973 K = 1.34 W m−1 K−1 for x = 0.02 to κ973 K = 1.15 W m−1 K−1 for x = 0.06 of CaMn1−xNbx/2Tax/2O3. Therefore the decrease in thermal conductivity solely depends on the enhanced doping level. The thermal conductivity (κ) is the sum of the phonon component (κph) and carrier component (κe). It is reported that for the materials with ρ > 1 Ω cm, κe is negligible. However, in the case of CaMn1−xNbx/2Tax/2O3 the electrical resistivity is much lower in the range of milliohms. The electronic contribution of the κ can be calculated from Widemann–Franz law as κe = LTσ (where L = 2.45 × 10⁻⁸ W Ω K−2 is the Lorentz number). Table 3 shows the electronic and phonon contribution of thermal conductivity. The electronic contribution increases with increasing the doping content of Nb and Ta due to the increased carrier concentrations. The highest κe is calculated to 0.19 W m−1 K−1 at 973 K for CaMn0.92Nb0.04Ta0.04O3, which is the 16% contribution to the total thermal conductivity values at that temperature. The phonon thermal conductivity estimated by subtraction of the electronic thermal conductivity from the total thermal conductivity as summarized in Table 3. This implies, in the case of CaMn0.92Nb0.04Ta0.04O3, the phonon thermal conductivity is the dominant component in the total thermal conductivity. Further, on closer look it is observed from Table 3 that the κph also decreases with increasing the doping level of Nb and Ta. The decrease of phonon thermal conductivity with doping can be interpreted in two ways: (i) crystallographic distortion arises from the change of ionic radii due to dual-substitution of Nb (rNb = 0.640 Å) and Ta (rTa = 0.640 Å) at Mn-site (rMn = 0.530 Å) and (ii) substitution by heavier elements (high atomic mass of Nb and Ta) to damping the local vibration.55 The atomic mass difference at Mn-site (mNb = 92.906, mTa = 180.947 and mMn = 54.938) due to substitution of Nb and Ta significantly affects κph due to shortening of the mean-free-path while crystallographic distortion is having very little influence.
| x | ρ at 973 K (Ω m) | κel at 973 K (W m−1 K−1) | κph at 973 K (W m−1 K−1) | κph at 973 K (W m−1 K−1) |
|---|---|---|---|---|
| 0.02 | 0.0001591 | 0.15 | 1.19 | 1.34 |
| 0.04 | 0.0001377 | 0.17 | 1.1 | 1.27 |
| 0.06 | 0.0001277 | 0.19 | 0.96 | 1.15 |
The dimensionless figure-of-merit (ZT) is plotted as a function of temperature in Fig. 7(b). The ZT value increases with increasing the temperature as well as the doping level. The composition CaMn0.96Nb0.02Ta0.02O3 exhibits the highest ZT value of 0.15 at 973 K arising from its low thermal conductivity (κ ∼ 1.2 W m−1 K−1), low electrical conductivity (ρ ∼ 16 mΩ cm) and moderate Seebeck coefficient (S ∼ −176 μV K−1).
Conclusions
In this paper we have investigated the crystal structure and high temperature thermoelectric properties of dual-doped CaMn1−xNbx/2Tax/2O3 (0.01 ≤ x ≤ 0.08). The cell parameters and Mn–O bond angles increases with increasing the doping level indicating formation of Mn3+ ions in the Mn4+ matrix of CaMnO3 as rMn3+ > rMn4+.The reduction Mn4+ to Mn3+ with e1g electron in turn helps in reduction of electrical conductivity without much altering the Seebeck coefficient value that results in highest power factor of 200 μW m−1 K−2 at 973 K for CaMn0.96Nb0.02Ta0.02O3. The thermal conductivity remains relatively low due to damping of local vibration through substitution of heavier ions of Nb and Ta as well as crystallographic distortion leading to highest ZT value of 0.15 at 973 K for CaMn0.96Nb0.02Ta0.02O3.Acknowledgements
We thank Dr A Roy Choudhury, IISER Mohali for powder XRD data, Ms Kalavati, NAL for SEM and Dr R Ramadurai, IIT Hyderabad for thermoelectric measurements. Financial support by Council of Scientific and Industrial Research and Science and Engineering Research Board, Department of Science and Technology, Government of India (SERB/F/4679/2013-14) are gratefully acknowledged.References
- F. J. DiSalvo, Thermoelectric cooling and power generation, Science, 1999, 238, 703–706 CrossRef.
- L. E. Bell, Cooling, heating, generating power, and recovering waste heat with thermoelectric systems, Science, 2008, 321, 1457–1461 CrossRef CAS PubMed.
- G. J. Snyder and E. S. Toberer, Complex thermoelectric materials, Nat. Mater., 2008, 7, 105–114 CrossRef CAS PubMed.
- T. M. Tritt, Recent Trends in Thermoelectric Materials Research I & II, in Semiconductors and semimetals, Academy Press, USA, 2001 Search PubMed.
- D. M. Rowe, Thermoelectrics Handbook : Micro to Nano, CRC Press, Taylor & Francis Group, USA, 2006 Search PubMed.
- B. I. Ismail and W. H. Ahmed, Thermoelectric power generation using waste-heat energy as an alternative green technology, Recent Pat. Electr. Eng., 2009, 2, 27–39 CrossRef CAS.
- G. J. Snyder, Small thermoelectric generators, Electrochem. Soc. Interface, 2008, 54–56 CAS.
- H. Ohta, K. Sugiura and K. Koumoto, Recent progress in oxide thermoelectric materials: p-type Ca3Co4O9 and n-type SrTiO3, Inorg. Chem., 2008, 47, 8429–8736 CrossRef CAS PubMed.
- J. W. Fergus, Oxide materials for high temperature thermoelectric energy conversion, J. Eur. Ceram. Soc., 2012, 32, 525–540 CrossRef CAS.
- K. Koumoto, Y. F. Wang, R. Zhang, A. Kosuga and R. Funahashi, Oxide thermoelectric materials: A nanostructuring approach, Annu. Rev. Mater. Res., 2010, 40, 363–394 CrossRef CAS.
- N. N. Van and N. Pryds, Nanostructured oxide materials and modules for high-temperature power generation from waste heat, Adv. Nat. Sci.: Nanosci. Nanotechnol., 2013, 4, 023002 CrossRef.
- A. Nag and V. Shubha, Oxide thermoelectric materials: A structure-property relationship, J. Electron. Mater., 2014, 43, 962–977 CrossRef CAS.
- Z. Zeng, M. Greenblatt and M. Craft, Large magnetoresistance in antiferromagnetic CaMnO3−δ, Phys. Rev. B: Condens. Matter Mater. Phys., 1999, 59, 8784–8788 CrossRef CAS.
- D. B. Marsh and P. E. Parris, High-temperature thermopower of LaMnO3 and related systems, Phys. Rev. B: Condens. Matter Mater. Phys., 1996, 54, 16602 CrossRef CAS.
- Y. Wang, Y. Sui, J. Cheng, X. Wang, Z. Lu and W. Su, High temperature metal−insulator transition induced by rare-earth doping in perovskite CaMnO3, J. Phys. Chem. C, 2004, 113, 12509–12516 CrossRef.
- B. T. Cong, T. Tsuji, P. X. Thao, P. Q. Thanh and Y. Yamamura, High-temperature thermoelectric properties of Ca1−xPrxMnO3−δ (0 ≤ x < 1), Phys. Rev. B: Condens. Matter Mater. Phys., 2004, 352, 18–23 CrossRef CAS.
- D. Flahaut, T. Mihara, R. Funahashi, N. Nabeshima, K. Lee, H. Ohta and K. Koumoto, Thermoelectrical properties of A-site substituted Ca1−xRexMnO3 system, J. Appl. Phys., 2006, 100, 084911 CrossRef.
- Y. Wang, Y. Sui and W. Su, High temperature thermoelectric characteristics of Ca0.9R0.1MnO3 (R = La,Pr,…,Yb), J. Appl. Phys., 2008, 104, 093703 CrossRef.
- A. Kosuga, Y. Isse, Y. Wang, K. Koumoto and R. Funahashi, High-temperature thermoelectric properties of Ca0.9−xSrxYb0.1MnO3−δ, J. Appl. Phys., 2009, 105, 093717 CrossRef.
- Y. Wang, Y. Sui, H. Fan, X. Wang, Y. Su, W. Su and X. Liu, High Temperature Thermoelectric Response of Electron-Doped CaMnO3, Chem. Mater., 2009, 21, 4653–4660 CrossRef CAS.
- F. Kawashima, X. Y. Huang, K. Hayashi, Y. Miyazaki and T. Kajitani, Structure and high-temperature thermoelectric properties of the n-type layered oxide Ca2−xBix−δMnO4−γ, J. Electron. Mater., 2009, 38, 1159–1162 CrossRef CAS.
- J. Lan, Y. H. Lin, H. Fang, A. Mei, C. W. Nan, Y. Liu, S. Xu and M. Petersz, High-temperature thermoelectric behaviors of fine-grained Gd-doped CaMnO3 ceramics, J. Am. Ceram. Soc., 2010, 93, 2121–2124 CrossRef CAS.
- Y. Wang, Y. Sui, X. Wang and W. Su, Enhancement of thermoelectric efficiency in (Ca,Dy)MnO3–(Ca,Yb)MnO3 solid solutions, Appl. Phys. Lett., 2010, 97, 052109 CrossRef.
- H. Taguchi, T. Kugi, M. Kato and K. Hirota, Fabrication of (Ca1−xLax)MnO3 ceramics with a high relative density and their power factor, J. Am. Ceram. Soc., 2010, 93, 3009–3011 CrossRef CAS.
- S. M. Choi, C. H. Lim and W. S. Seo, Thermoelectric properties of the Ca1−xR xMnO3 perovskite system (R: Pr, Nd, Sm) for high-temperature applications, J. Electron. Mater., 2011, 40, 551–556 CrossRef CAS.
- Y. Wang, Y. Sui, X. Wang and W. Su, Effects of substituting La3+, Y3+ and Ce4+ for Ca2+ on the high temperature transport and thermoelectric properties of CaMnO3, J. Phys. D: Appl. Phys., 2009, 42, 055010 CrossRef.
- C.-J. Liu, A. Bhaskar and J. J. Yuan, High-temperature transport properties of Ca0.98RE0.02MnO3−δ (RE = Sm, Gd, and Dy), Appl. Phys. Lett., 2011, 98, 214101 CrossRef.
- F. P. Zhang, Q. M. Lu, X. Zhang and J. X. Zhang, Preparation and improved electrical performance of the Pr-doped CaMnO3−δ thermoelectric compound, Phys. Scr., 2013, 88, 035705 CrossRef.
- A. Maignan, C. Martin, C. Autret, M. Hervieu, B. Raveaua and J. Hejtmanek, Structural–magnetic phase diagram of Mo-substituted CaMnO3: consequences for thermoelectric power properties, J. Mater. Chem., 2002, 12, 1806–1811 RSC.
- L. Bocher, M. H. Aguirre, D. Logvinovich, A. Shkabko, R. Robert, M. Trottmann and A. Weidenkaff, CaMn1−xNbxO3 (x ≤ 0.08) perovskite-type phases as promising new high-temperature n-type thermoelectric materials, Inorg. Chem., 2008, 47, 8077–8085 CrossRef CAS PubMed.
- T. Okuda and Y. Fujii, Co-substitution effect on the magnetic, transport, and thermoelectric properties of the electron-doped perovskite manganite CaMnO3, J. Appl. Phys., 2010, 108, 103702 CrossRef.
- G. Xu, R. Funahashi, Q. Pu, B. Liu, R. Tao and G. Wang, Zejun Ding, High-temperature transport properties of Nb and Ta substituted CaMnO3 system, Solid State Ionics, 2004, 171, 147–151 CrossRef CAS.
- M. Miclau, J. Hejtmanek, R. Retoux, K. Knizek, Z. Jirak, R. Frésard, A. Maignan, S. Hébert, M. Hervieu and C. Martin, Structural and magnetic transitions in CaMn1−xWxO3, Chem. Mater., 2007, 19, 4243–4251 CrossRef CAS.
- S. Populoh, M. Trottmann, M. H. Aguire and A. Weidenkaff, Nanostructured Nb-substituted CaMnO3 n-type thermoelectric material prepared in a continuous process by ultrasonic spray combustion, J. Mater. Res., 2011, 26, 1947–1952 CrossRef CAS.
- A. Nag, F. DSa and V. Shubha, Doping induced high temperature transport properties of Ca1−xGdxMn1−xNbxO3 (0 ≤ x ≤ 0.1), Mater. Chem. Phys., 2015, 151, 119–125 CrossRef CAS.
- A. Nag and R. S. C. Bose, High temperature transport properties of co-substituted Ca1−xLnxMn1−xNbxO3 (Ln = Yb, Lu; 0.02 ≤ x ≤ 0.08), Mater. Res. Bull., 2016, 74, 41–49 CrossRef CAS.
- A. C. Larson and R. B. von Dreele, General Structure Analysis System Report LAUR 86-748; Los Alamos National Laboratory, Los Alamos, NM, 1990 Search PubMed.
- W. Paszkowicz, J. Piętosa, S. M. Woodley, P. A. Dłużewski, M. Kozłowski and C. Martin, Lattice parameters and orthorhombic distortion of CaMnO3, Powder Diffr., 2010, 25, 46–59 CrossRef CAS.
- R. D. Shannon, Revised effective ionic radii and systematic studies of interatomic distances in halides and chalcogenides, Acta Crystallogr., Sect. A: Cryst. Phys., Diffr., Theor. Gen. Crystallogr., 1976, 32, 751–767 CrossRef.
- R. H. Mitchell, Perovskites – Modern and Ancient, Almez Press Inc., Ontario, Canada, 2002 Search PubMed.
- D. Vega, C. Ramos, H. Aliaga, M. T. Causa, B. Alascio, M. Tovar, G. Polla, G. Leyva, P. König and I. Torriani, Charge ordering in the electron doped Ca1−xYxMnO3 manganites, Phys. B, 2002, 320, 37–39 CrossRef CAS.
- B. Raveau, Y. M. Zhao, C. Martin, M. Hervieu and A. Maignan, Mn-Site Doped CaMnO3: Creation of the CMR Effect, J. Solid State Chem., 2000, 149, 203–207 CrossRef CAS.
- M. Miclau, J. Hejtmanek, R. Retoux, K. Knizek, Z. Jirak, R. Frésard, A. Maignan, S. Hébert, M. Hervieu and C. Martin, Structural and Magnetic Transitions in CaMn1−xWxO3, Chem. Mater., 2007, 19, 4243–4251 CrossRef CAS.
- M. Molinari, D. A. Tomsett, S. C. Parker, F. Azough and R. Freer, Structural, electronic and thermoelectric behaviour of CaMnO3 and CaMnO(3−δ), J. Mater. Chem. A, 2014, 2, 14109–14117 CAS.
- J. Briático, B. Alascio, R. Allub, A. Butera, A. Caneiro, M. T. Causa and M. Tovar, Double-exchange interaction in electron-doped CaMnO3−δ, Phys. Rev. B: Condens. Matter Mater. Phys., 1996, 53, 14020–14023 CrossRef.
- M. Schrade, R. Kabir, S. Li, T. Norby and T. G. Finstad, High temperature transport properties of thermoelectric CaMnO3−δ – Indication of strongly interacting small polaron, J. Appl. Phys., 2015, 115, 103705 CrossRef.
- P. M. Chaikin and G. Beni, Thermopower in the correlated hopping regime, Phys. Rev. B: Solid State, 1976, 13, 647 CrossRef CAS.
- A. Bhaskar, Z.-R. Yang and C.-J. Liu, Electronic transport of co-doped misfit layered cobaltites, J. Mater. Sci.: Mater. Electron., 2015, 26, 9463–9469 CrossRef CAS.
- N. F. Mott and E. A. Davis, in Electronic Processes in Noncrystalline Materials, Clarendon, Oxford, 1971 Search PubMed.
- G. N. Austin and N. F. Mott, Polarons in crystalline and non-crystalline materials, Adv. Phys., 1969, 18, 41–102 CrossRef.
- J. J. Hamilton, E. L. Keatley, H. L. Ju, A. K. Raychaudhuri, V. N. Smolyaninova and R. L. Greene, Low-temperature specific heat of La0.67Ba0.33MnO3 and La0.8Ca0.2MnO3, Phys. Rev. B: Condens. Matter Mater. Phys., 1996, 54, 14926 CrossRef CAS.
- M. R. Lees, O. A. Petrenko, G. Balakrishnan and D. McK, Paul, Specific heat of Pr0.6(Ca1−xSrx)0.4MnO3 (0 <∼ x <∼ 1), Phys. Rev. B: Condens. Matter Mater. Phys., 1999, 59, 1298 CrossRef CAS.
- S. Mollah, G. Anjum and H. D. Yang, Non-adiabatic polaron hopping conduction in CaMn1−xCrxO3 (0 ≤ x ≤ 0.3), J. Phys. Chem. Solids, 2009, 70, 489–494 CrossRef CAS.
- X. Y. Huang, Y. Miyazaki and T. Kajitani, High temperature thermoelectric properties of Ca1−xBixMn1−yVyO3−δ (0 ≤ x = y ≤ 0.08), Solid State Commun., 2008, 145, 132–136 CrossRef CAS.
- D. Flahaut, T. Mihara, R. Funahashi, N. Nabeshima, K. Lee, H. Ohta and K. Koumoto, J. Appl. Phys., 2006, 100, 084911 CrossRef.
Footnote |
| † Electronic supplementary information (ESI) available. See DOI: 10.1039/c6ra06032c |
| This journal is © The Royal Society of Chemistry 2016 |