 Open Access Article
Creative Commons Attribution 3.0 Unported Licence
Detection of Salmonella bacteria in milk using gold-coated magnetic nanoparticle clusters and lateral flow filters†
Jeongin
Hwang
,
Donghoon
Kwon
,
Sanghee
Lee
and
Sangmin
Jeon
*
Department of Chemical Engineering, Pohang University of Science and Technology (POSTECH), 77 Cheongam-Ro, Nam-Gu, Pohang, Gyeongbuk, Republic of Korea. E-mail: jeons@postech.ac.kr
First published on 11th May 2016
Abstract
A novel method was developed for the detection of Salmonella bacteria using gold-coated magnetic nanoparticle clusters (Au/MNCs) and lateral flow filters. Unlike a conventional lateral flow immunoassay (LFA) membrane, where antibodies are immobilized on test and control lines to observe a signal, the test line in the new method is formed simply by pressing a nitrocellulose membrane to decrease its thickness. Half-antibody fragment-functionalized Au/MNCs were used to capture Salmonella in milk and then dispersed in a small volume of buffer solution in which one end of the lateral flow filter was immersed. The free Au/MNCs rose to the pressed test line, while the Salmonella–Au/MNC complexes remained in the solution because they were too large to pass through the pores inside the lateral flow filter. The flow of free Au/MNCs was blocked at the test line because of the reduced pore size, and their accumulation caused the test line to darken. The color of the test line was inversely proportional to the Salmonella concentration, and the limit of detection for Salmonella in milk was determined to be 103 CFU mL−1 after image processing. A control test using Escherichia coli, Staphylococcus aureus, and Vibrio parahaemolyticus revealed that the new lateral flow filtration method with Au/MNCs is highly selective for the detection of Salmonella.
1. Introduction
Lateral flow immunoassay (LFA), also known as immunochromatographic assay, is the most common commercially available point-of-care (POC) diagnostic tool because it is low-cost, disposable, and requires no specialized equipment, and it is used in various applications, such as in the detection of proteins,1,2 antibiotics,3 metal ions,4,5 and toxins.6–9 A typical LFA uses specific biological components such as antibodies and DNAs to observe a signal at test and control lines on a nitrocellulose (NC) membrane. A sample solution containing target molecules flows through the NC membrane, and the binding of target molecule–gold nanoparticle complexes to the antibodies at the test and control lines induces a change in color that can be observed by the naked eye.Although the working principle of LFA is simple, it cannot be applied in a straightforward manner for the detection of foodborne bacteria in real samples because the concentration of bacteria rinsed off of food samples is very low compared to the concentration of food debris. This problem may be circumvented by using magnetic nanoparticles (MNPs), which allow the capture, separation, and concentration of target bacteria from a large volume of sample solution into a small volume of solution.10–13 The concentration of the bacteria can be determined by conventional LFA to observe the binding of the MNP–bacteria complexes to the antibodies on the test and control lines. However, the immobilization of antibody increases the cost of LFA and limits its shelf life because of the gradual loss of activity.
We solved this problem by using an LFA membrane as a lateral flow filter based on the large size difference between the free MNPs (<200 nm) and the MNP–bacteria complexes (>1 μm). The pores of the lateral flow filter were larger than those of the free MNPs but smaller than those of the MNP–bacteria complexes; thus, only free MNPs could pass through the membrane. If the pore size at the test line was decreased to be smaller than that of the free MNPs, the flow of free MNPs would be blocked at the test line and the color change at the test line due to the accumulation of free MNPs could be detected by the naked eye. Compared to conventional filtration, the lateral flow filter does not require suction equipment and produces clear signals by concentrating the target particles at the narrow test line.
In this study, we used half-antibody fragment-functionalized gold-coated magnetic nanoparticle clusters (Au/MNCs) to capture Salmonella bacteria in milk and determined the concentration using a lateral flow filter with a reduced pore size at the test line. The pore size was simply reduced by pressing an NC membrane to decrease its thickness. The color intensity at the test line was inversely proportional to the Salmonella concentration, and the limit of detection for Salmonella in milk was determined to be 103 CFU mL−1 by the naked eye.
2. Experimental
2.1 Materials
Iron(III) chloride hexahydrate (FeCl3·6H2O), sodium citrate tribasic dihydrate, urea, polyacrylamide, gold(III) chloride trihydrate (HAuCl4·3H2O), sodium borohydride (NaBH4), (3-aminopropyl)triethoxysilane (APTES), hydroxylamine hydrochloride (NH2OH·HCl), potassium phosphate monobasic (KH2PO4), potassium phosphate dibasic (K2HPO4), tris(2-carboxyethyl)phosphine hydrochloride (TCEP), bovine serum albumin (BSA), and Tween 20 were purchased from Sigma-Aldrich (St. Louis, MO, USA) and used as received. Polyclonal Salmonella antibody (ab35156) was purchased from Abcam (Cambridge, UK). Amicon ultra-0.5 centrifugal filters (UFC501096), NC membranes (card HF075MC100), and absorbent pads (SA3J645H9) were purchased from Millipore (Billerica, MA, USA). Permanent magnets were purchased from Seoul Magnet (Seoul, Korea). Deionized (DI) water (18.3 MΩ cm) was obtained using a reverse osmosis water system (Human Science, Korea) and used to prepare phosphate buffer (PB).2.2 Synthesis of gold-coated Fe3O4 magnetic nanoparticle clusters (Au/MNCs)
Fe3O4 MNCs were synthesized using a hydrothermal method.14 Briefly, 1.08 g of iron(III) chloride hexahydrate, 2.35 g of sodium citrate tribasic dihydrate, and 0.72 g of urea were dissolved in 80 mL of DI water; 0.4 g of polyacrylamide was then added into the solution. The solution was stirred for 1 h at room temperature (RT), transferred to a Teflon-lined autoclave, heated for 10 h at 200 °C, removed from the autoclave, and allowed to cool naturally to RT. The precipitate was washed several times with DI water. To synthesize Au/MNCs, 8 mg of MNCs dispersed in ethanol was added to 40 mL of 1% APTES to produce amine groups on the surfaces of the MNCs. Gold nanoparticles (Au NPs) were synthesized as seeds;15 briefly, 2 mL of 1 wt% sodium citrate tribasic dihydrate and 1 mL of 1 wt% HAuCl4·3H2O were dissolved in 80 mL of DI water, and 1 mL of 0.075 wt% sodium borohydride was then added to the solution. The reaction was allowed to continue for 5 min under vigorous stirring. Finally, the solution was stored at 4 °C until the next step. The synthesized Au NPs were added to the APTES-coated MNCs. The reaction was allowed to proceed for 5 h under shaking. The particles were washed several times with DI water. To increase the Au size, 100 μL of 1 wt% HAuCl4·3H2O and 100 μL of 160 mM hydroxylamine hydrochloride were added to the Au-coated MNCs and the reduction reaction was allowed to continue for 40 min under shaking.2.3 Preparation of antibody-functionalized Au/MNCs
To immobilize Salmonella antibody with the desired orientations on Au/MNCs, half-antibody fragments were obtained by adding 10 μL of 5 mM TCEP to 400 μL of PB containing 40 μg of Salmonella antibody.16 The reaction was allowed to proceed for 1 h at RT, and the half-antibody fragments were then purified five times with PB using an Amicon ultra-0.5 centrifugal filter. The as-prepared half-antibody fragments were immediately added to 2 mL of 0.5 mg mL−1 Au/MNCs to immobilize the antibodies on the Au nanoparticles via Au–S bonds. The solution was incubated for 1 h at RT under gentle shaking, and 100 μL of 1% BSA was then added to the solution to prevent nonspecific binding. Finally, the particles were washed with PB.2.4 Preparation of lateral flow filters
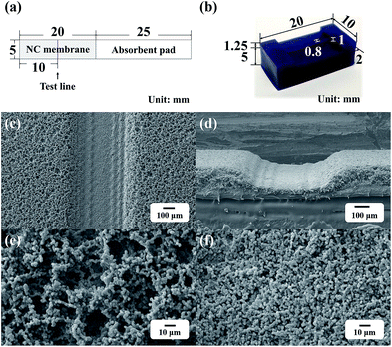
Fig. 1a shows the structure of a lateral flow filter. Each filter was prepared by overlapping an absorbent pad on an NC membrane. As it was important to form the pressed test line with a constant width and depth to obtain reproducible results, the test line was formed by pressing the NC membrane using a 3D-printed line presser with a protruded line structure that was 1 mm high and 0.8 mm wide (Fig. 1b). Fig. 1c and d show the scanning electron microscopy (SEM) images of the membrane after stamping. The width of the pressed line on the NC membrane was ∼0.8 mm, corresponding to the width of the line presser. The magnified SEM images in Fig. 1e and f show that the pressed membrane had substantially smaller pores than the initial membrane. The pores with reduced sizes at the test line blocked the flow of free Au/MNCs and produced changes in color.2.5 Detection of Salmonella using a lateral flow filter with a pressed test line
Fig. 2 illustrates the detection of Salmonella using a lateral flow filter with a pressed test line and antibody-functionalized Au/MNCs. Salmonella antibody-functionalized Au/MNCs (50 μL, 0.2 mg mL−1) were added to 15 mL of milk spiked with Salmonella typhimurium at 0 to 106 CFU mL−1. The samples were incubated for 3 h at RT under gentle shaking. After incubation, the samples containing Salmonella–Au/MNC complexes and free antibody-functionalized Au/MNCs were isolated magnetically, washed three times with PB, and then re-suspended in 150 μL of 0.1% Tween 20. The concentrated samples were placed in a 96-well plate, and one end of the lateral flow filter was immersed in the sample solution for 3 min. Images of the lateral flow filter were recorded using a digital camera and analyzed using ImageJ software (National Institutes of Health, USA).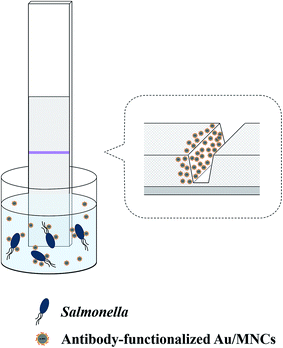 | ||
| Fig. 2 Schematic of the detection of Salmonella using a lateral flow filter with a pressed test line. | ||
3. Results and discussion
Fig. 3a and b show the SEM images of MNCs and Au/MNCs, respectively. The mean diameters of the MNCs and Au/MNCs were 160 and 180 nm, respectively, and both had narrow size distributions. The bright spots on the Au/MNCs correspond to Au nanoparticles, which have an average size of ∼14 nm. The absorption spectrum of the MNCs is shown in Fig. 3c. The absorption of the MNCs decreased monotonically with increasing wavelength. In contrast, the spectrum of the Au/MNCs (Fig. 3c) showed a peak at 534 nm, which is a signature of Au.17–19 This result indicates that the Au/MNCs were well coated with Au nanoparticles. The thiol chemistry allows the immobilization of half-antibody fragments on the Au nanoparticles in Au/MNCs in one step;20 this simplified procedure for antibody functionalization assures the appropriate orientation of the antibodies for efficient binding to target molecules. Fig. 3d shows a transmission electron microscopy (TEM) image of two Salmonella bacteria that are conjugated with tens of Au/MNCs. Note that the size of a Salmonella–Au/MNC complex was much larger than that of the free Au/MNCs, which allows us to separate free Au/MNCs from the complexes using lateral flow filters.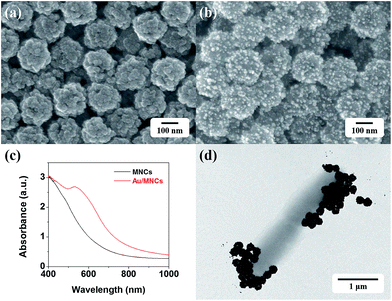 | ||
| Fig. 3 SEM images of (a) MNCs and (b) Au/MNCs. (c) UV-vis absorption spectrum of 0.1 mg mL−1 MNCs (black) and Au/MNCs (red) in DI water. (d) TEM image of Salmonella–Au/MNC complexes. | ||
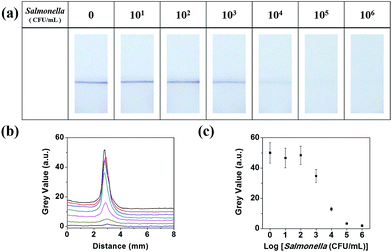
A series of experiments were conducted using various concentrations of Salmonella in milk ranging from 0 to 106 CFU mL−1. After the incubation of antibody-functionalized Au/MNCs in 15 mL of Salmonella-spiked milk, the samples containing Salmonella–Au/MNC complexes and free Au/MNCs were concentrated into 150 μL of 0.1% Tween 20. Upon the immersion of one end of the lateral flow filter into the sample solution, only free Au/MNCs moved up to the test line, and dark lines appeared due to the complex pore structure of the NC membrane relative to the large Salmonella–Au/MNC complexes. Fig. 4a shows the optical images of the lateral flow filters after 3 min of immersion; the color of the test line became paler as the Salmonella concentration increased because the number of free Au/MNCs decreased with increasing Salmonella concentration. For quantitative analysis, ImageJ was used to convert the color at the pressed test line to a gray-scale value;21 this value decreased as Salmonella concentration increased (Fig. 4b and c). The detection limit of this method was 103 CFU mL−1 of Salmonella in milk after 3 min of immersion.
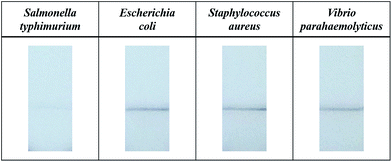
A control experiment was conducted to examine the selectivity of this method. Au/MNCs functionalized with Salmonella antibody were incubated with 15 mL of milk spiked with 105 CFU mL−1Salmonella typhimurium, Escherichia coli, Staphylococcus aureus, and Vibrio parahaemolyticus. The samples were concentrated into 150 μL of 0.1% Tween 20 and dispensed in the wells of a 96-well plate. The lateral flow filters dipped into the Salmonella-spiked sample did not darken at the pressed test line, whereas those treated with E. coli, S. aureus, and V. parahaemolyticus did (Fig. 5). This color change was caused by Au/MNCs functionalized with Salmonella antibody, which could not be conjugated with the non-target bacteria, demonstrating the high selectivity of this detection method.
4. Conclusions
We developed a novel method that uses antibody-functionalized Au/MNCs and lateral flow filters to detect Salmonella in milk. The lateral flow membrane, with pore sizes larger than free Au/MNCs but smaller than Au/MNC–bacteria complexes, allowed only free Au/MNCs to pass through the membrane because the sizes of Au/MNC–bacteria complexes were much greater than those of the free Au/MNCs. The flow of free Au/MNCs was blocked at the test line, which had smaller pores, and the accumulation of free Au/MNCs made the test line darken. The color of the test line was inversely proportional to the Salmonella concentration, and the limit of detection for Salmonella in milk was determined to be 103 CFU mL−1 by the naked eye. Because of its many advantages over conventional LFA and paper filtration, the developed method shows great potential for screening bacteria in drinking water and food samples.Acknowledgements
This work was supported by the Industrial Strategic Technology Development Program (10053302, Development of mesoporous magnetic ceramic material for diagnostics of pathogenic virus and bacteria) funded by the Ministry of Trade, industry & Energy (MI, Korea).References
- Y. Wang, R. Deng, G. Zhang, Q. Li, J. Yang, Y. Sun, Z. Li and X. Hu, J. Agric. Food Chem., 2015, 63, 2172–2178 CrossRef CAS PubMed.
- Y. Zhang and J. Y. Ying, Anal. Chem., 2015, 87, 10193–10198 CrossRef CAS PubMed.
- N. A. Taranova, A. N. Berlina, A. V. Zherdev and B. B. Dzantiev, Biosens. Bioelectron., 2015, 63, 255–261 CrossRef CAS PubMed.
- S. M. Z. Hossain and J. D. Brennan, Anal. Chem., 2011, 83, 8772–8778 CrossRef CAS PubMed.
- A. M. López Marzo, J. Pons, D. A. Blake and A. Merkoçi, Anal. Chem., 2013, 85, 3532–3538 CrossRef PubMed.
- C. Liu, Q. Jia, C. Yang, R. Qiao, L. Jing, L. Wang, C. Xu and M. Gao, Anal. Chem., 2011, 83, 6778–6784 CrossRef CAS PubMed.
- D. Tang, J. C. Sauceda, Z. Lin, S. Ott, E. Basova, I. Goryacheva, S. Biselli, J. Lin, R. Niessner and D. Knopp, Biosens. Bioelectron., 2009, 25, 514–518 CrossRef CAS PubMed.
- M. Zangheri, F. Di Nardo, L. Anfossi, C. Giovannoli, C. Baggiani, A. Roda and M. Mirasoli, Analyst, 2015, 140, 358–365 RSC.
- Z. Zhang, D. Wang, J. Li, Q. Zhang and P. Li, Anal. Methods, 2015, 7, 2822–2829 RSC.
- B. Chung, G. W. Shin, W. Choi, J. Joo, S. Jeon and G. Y. Jung, Electrophoresis, 2014, 35, 3283–3289 CrossRef CAS PubMed.
- H. J. Chung, C. M. Castro, H. Im, H. Lee and R. Weissleder, Nat. Nanotechnol., 2013, 8, 369–375 CrossRef CAS PubMed.
- J. Joo, C. Yim, D. Kwon, J. Lee, H. H. Shin, H. J. Cha and S. Jeon, Analyst, 2012, 137, 3609–3612 RSC.
- D. Kwon, S. Lee, M. M. Ahn, I. S. Kang, K. 'H. Park and S. Jeon, Anal. Chim. Acta, 2015, 883, 61–66 CrossRef CAS PubMed.
- W. Cheng, K. Tang, Y. Qi, J. Sheng and Z. Liu, J. Mater. Chem., 2010, 20, 1799–1805 RSC.
- L. Wang, J. Bai, Y. Li and Y. Huang, Angew. Chem., Int. Ed., 2008, 47, 2439–2442 CrossRef CAS PubMed.
- H. Sharma and R. Mutharasan, Anal. Chem., 2013, 85, 2472–2477 CrossRef CAS PubMed.
- J. Lin, W. Zhou, A. Kumbhar, J. Wiemann, J. Fang, E. E. Carpenter and C. J. O'Connor, J. Solid State Chem., 2001, 159, 26–31 CrossRef CAS.
- S. V. Salihov, Y. A. Ivanenkov, S. P. Krechetov, M. S. Veselov, N. V. Sviridenkova, A. G. Savchenko, N. L. Klyachko, Y. I. Golovin, N. V. Chufarova, E. K. Beloglazkina and A. G. Majouga, J. Magn. Magn. Mater., 2015, 394, 173–178 CrossRef CAS.
- H. Xu, J. Chen, J. Birrenkott, J. X. Zhao, S. Takalkar, K. Baryeh and G. Liu, Anal. Chem., 2014, 86, 7351–7359 CrossRef CAS PubMed.
- G. K. Kouassi and J. Irudayaraj, Anal. Chem., 2006, 78, 3234–3241 CrossRef CAS PubMed.
- M. S. Khan, T. Pande and T. G. M. van de Ven, Colloids Surf., B, 2015, 132, 264–270 CrossRef CAS PubMed.
Footnote |
| † Electronic supplementary information (ESI) available. See DOI: 10.1039/c6ra05446c |
| This journal is © The Royal Society of Chemistry 2016 |

