Visible light-driven photocatalytic degradation performance for methylene blue with different multi-morphological features of ZnS
Hanbing Rao†
a,
Zhiwei Lu†a,
Xin Liua,
Hongwei Gea,
Zhaoyi Zhanga,
Ping Zoua,
Hua Heb and
Yanying Wang*a
aCollege of Science, Sichuan Agricultural University, Sichuan Ya’An 625014, People’s Republic of China. E-mail: wangyy@sicau.edu.cn; Tel: +86-835-2886155
bAnimal Genetics and Breeding Institute of Sichuan Agricultural University, Sichuan Ya’An 625014, People’s Republic of China
First published on 25th April 2016
Abstract
In this study, four different sphere structures of zinc sulfide (ZnS) materials, dandelion-ZnS, raspberry-ZnS, ball-ZnS and flower-ZnS, were synthesized via a hydro-thermal method. Afterwards, the photocatalytic performances of the produced ZnS powders were investigated using methylene blue (MB) visible light induced photodegradation. X-ray diffraction (XRD), scanning electronic microscopy (SEM), Brunauer–Emmett–Teller (BET), Fourier transform infrared spectroscopy (FT-IR) and UV-visible diffuse reflectance spectroscopy (UV-vis-DRS) were used for characterization of the as-prepared ZnS powders. The specific surface areas of dandelion-ZnS, raspberry-ZnS, ball-ZnS and flower-ZnS were found to be 112, 119, 5.89 and 37.4 m2 g−1, respectively. The MB photodegradation by ZnS fitted well with a pseudo-first-order model. The high specific surface areas, unique morphology, porous structures and high hydrophilicity contribute to the photocatalytic abilities of ZnS. However, it shows that ZnS with simple structures has better reusability.
1. Introduction
Environmental pollution has been brought into public focus.1–3 Pollutants, especially those from industrial effluents, pose severe problems. The bio-degradation of these pollutants is generally very difficult and conventional treatments are mostly ineffective and not environmentally friendly.2 So, simple, safe, cheap, and green techniques are in urgent demand to degrade these pollutants. There are various processes for the purification of pollutants. At present, using semiconductor materials as photocatalysts in advanced oxidation processes has been studied extensively, due to their peculiar and fascinating physicochemical properties.3–6 Among various oxide semiconductor photocatalytic materials, zinc sulfide (ZnS), an important direct wide-bandgap semiconductor material, has two polymorphs, i.e. cubic zinc blende (ZB) structure and hexagonal wurtzite (WZ) structure.7,8 Among these, the ZB structure with a bandgap energy of 3.72 eV is stable at room temperature while the WZ structure with a bandgap energy of 3.77 eV is a thermodynamically metastable phase formed at a high-temperature of 1020 °C.9 The WZ structure ZnS is preferable due to its excellent optical properties compared with those of the ZB ZnS structure, as indicated earlier.10ZnS has received considerable attention in photocatalysis because of its tunable electric and proper band potentials, which could provide the thermodynamic conditions for the photocatalytic redox reaction and turn ZnS into a highly efficient photocatalyst. In the past few years, ZnS has showed efficient UV light irradiated photocatalytic dye degradation activity, and compared with the hazardous nature of UV radiation, visible light driven photocatalytic activity is preferred. In tropical regions of China like Hainan Province and Yunnan Province, etc. sunlight is abundantly available throughout the year as a natural energy source for visible light, which can be conveniently used for photocatalytic dye degradation and thereby the cost will be reduced. Therefore, ZnS research has aroused widespread attention in photocatalysis and it has better photocatalytic activity under visible light in recent years.11,12
The photocatalytic activity of materials has a strong connection with morphology,1,13 particle size14–16 and surface structure.17,18 Researchers have barely explored the photocatalytic degradation efficiency of different three dimensional (3D) structured morphologies of ZnS materials. In the past decades, much effort has been devoted to the controlled preparation of ZnS nanostructures with various morphologies, such as nanoparticles,19 nanorods,20 nanowires21 and nanosheets,22 etc. Although these low dimensional nanomaterials exhibit lots of special properties, compared to them, the complex 3D architectures constructed by nanoscale building blocks possibly possess more new properties due to their novel structures and thus have been attracting broad attention in materials science.23–25 Moreover, the complex 3D architectures may have high photocatalytic degradation efficiency due to a large surface-to-volume ratio.26
So in this study, four different 3D structures of ZnS were prepared by a simple, fast and low temperature hydro-thermal method and characterized in detail in terms of their morphological, structural and photocatalytic properties by X-ray diffraction, SEM, BET, FT-IR and UV-vis-DRS measurements. The as-synthesized ZnS materials were used as photocatalysts for the degradation of methylene blue (MB) under visible light-driven irradiation in air at room temperature. The efficiency of the morphological effect on the photocatalytic performance of synthesized ZnS structures was compared. The results indicated that the obtained dandelion-like ZnS samples exhibited remarkable photocatalytic performance. The special morphologies and structures for ZnS are helpful for improving the photocatalytic activity. These non-toxic, stable, inexpensive nanocrystalline photocatalysts can be efficiently used for waste water treatment in the dye industry. Moreover, due to their non-dissolving nature in aqueous media, these photocatalysts can be easily recovered after use.
2. Experimental
2.1. Materials
Zinc acetate dehydrate (Zn(CH3COO)2·2H2O, ≥99.0%), zinc nitrate hexahydrate (Zn(NO3)2·6H2O, ≥99.0%), thiourea (CH4N2S, ≥99.0%), cetyltrimethyl ammonium bromide (CTAB, ≥99.0%), ethylenediamine (EN, ≥98.0%), ethanolamine (EMA, ≥98.0%), and methylene blue (MB, ≥98.5%) were purchased from the KeLong chemical reagent factory of Chengdu. All the chemicals were used without further purification and all aqueous solutions were prepared with distilled water (DW).2.2. Sample preparation
ZnS samples were prepared by a hydrothermal method.25,27 The products were denoted as samples S1–S4, respectively (Table 1). The fabrication process of sample dandelion-like ZnS (dandelion-ZnS) is described as follows. 10 mmol Zn(NO3)2·6H2O and 10 mmol CH4N2S were dissolved in 20 mL of a binary solvent system composed of 17.5 mL of EN and 2.5 mL of DW. The solution above was stirred for 10 min, and this solution was transferred to a Teflon-lined stainless steel autoclave, sealed and maintained at 140 °C for 8 h in an oven before cooling to room temperature naturally. The obtained white precipitate was collected and washed with ethanol and DW several times to remove impurities, then dried in a vacuum at 50 °C.| Sample name | Sulphur source (amount) | Zinc source (amount) | Solvent system | Template | Method | Morphology |
|---|---|---|---|---|---|---|
| S1 | Thiourea (10 mmol) | Zinc nitrate hexahydrate (10 mmol) | Binary solvent (EN![[thin space (1/6-em)]](https://www.rsc.org/images/entities/char_2009.gif) : :![[thin space (1/6-em)]](https://www.rsc.org/images/entities/char_2009.gif) DW = 7 DW = 7![[thin space (1/6-em)]](https://www.rsc.org/images/entities/char_2009.gif) : :![[thin space (1/6-em)]](https://www.rsc.org/images/entities/char_2009.gif) 1) 1) |
Without | Hydrothermal method | Dandelion-like |
| S2 | Thiourea (20 mmol) | Zinc nitrate hexahydrate (10 mmol) | Binary solvent (EN![[thin space (1/6-em)]](https://www.rsc.org/images/entities/char_2009.gif) : :![[thin space (1/6-em)]](https://www.rsc.org/images/entities/char_2009.gif) DW = 1 DW = 1![[thin space (1/6-em)]](https://www.rsc.org/images/entities/char_2009.gif) : :![[thin space (1/6-em)]](https://www.rsc.org/images/entities/char_2009.gif) 1) 1) |
Without | Hydrothermal method | Raspberry-like |
| S3 | Thiourea (10 mmol) | Zinc acetate dehydrate (10 mmol) | DW (35 mL) | CTAB | Hydrothermal method | Ball-like ZnS |
| S4 | Thiourea (3 mmol) | Zinc acetate dehydrate (5 mmol) | Ternary solvent (EN![[thin space (1/6-em)]](https://www.rsc.org/images/entities/char_2009.gif) : :![[thin space (1/6-em)]](https://www.rsc.org/images/entities/char_2009.gif) EMA EMA![[thin space (1/6-em)]](https://www.rsc.org/images/entities/char_2009.gif) : :![[thin space (1/6-em)]](https://www.rsc.org/images/entities/char_2009.gif) ethanol = 3 ethanol = 3![[thin space (1/6-em)]](https://www.rsc.org/images/entities/char_2009.gif) : :![[thin space (1/6-em)]](https://www.rsc.org/images/entities/char_2009.gif) 3 3![[thin space (1/6-em)]](https://www.rsc.org/images/entities/char_2009.gif) : :![[thin space (1/6-em)]](https://www.rsc.org/images/entities/char_2009.gif) 4) 4) |
Without | Solvothermal method | Flower-like |
The synthesis method of the raspberry-like ZnS (raspberry-ZnS) sample was similar to that of the dandelion-ZnS sample, except that the volume ratio of the binary solvent system became 1![[thin space (1/6-em)]](https://www.rsc.org/images/entities/char_2009.gif) :
:![[thin space (1/6-em)]](https://www.rsc.org/images/entities/char_2009.gif) 1 and the amount of CH4N2S was 20 mmol.
1 and the amount of CH4N2S was 20 mmol.
Sample ball-like ZnS (ball-ZnS) was synthesized as follows, 10 mmol Zn(CH3COO)2·2H2O and 10 mmol CH4N2S were dissolved in 35 mL of DW and stirred at room temperature until dissolved, then 0.228 g of CTAB was added into the solution above with high-speed magnetic stirring. After the solution was stirred for 3 h, the solution was transferred to the Teflon-lined stainless steel autoclave, sealed and maintained at 150 °C for 18 h in an oven. After cooling down to room temperature naturally, the obtained white precipitate was washed with ethanol and DW several times to remove impurities, then dried in a vacuum at 50 °C.
Flower-like ZnS (flower-ZnS) was synthesized as follows: 5 mmol Zn(CH3COO)2·2H2O and 3 mmol CH4N2S were dissolved in 100 mL of a ternary solution composed of EN, EMA and ethanol with a volume ratio of 3![[thin space (1/6-em)]](https://www.rsc.org/images/entities/char_2009.gif) :
:![[thin space (1/6-em)]](https://www.rsc.org/images/entities/char_2009.gif) 4
4![[thin space (1/6-em)]](https://www.rsc.org/images/entities/char_2009.gif) :
:![[thin space (1/6-em)]](https://www.rsc.org/images/entities/char_2009.gif) 3. After stirring, the mixture was transferred to a Teflon-lined stainless steel autoclave, sealed and maintained at 160 °C for 24 h in an oven. After cooling down to room temperature naturally, the obtained white precipitate was washed with ethanol and DW several times to remove impurities, and then dried in vacuum at 50 °C.
3. After stirring, the mixture was transferred to a Teflon-lined stainless steel autoclave, sealed and maintained at 160 °C for 24 h in an oven. After cooling down to room temperature naturally, the obtained white precipitate was washed with ethanol and DW several times to remove impurities, and then dried in vacuum at 50 °C.
2.3. Characterization
The morphological features of these synthesized powders were studied by scanning electron microscopy (SEM, JEOLJSM 7500F). The crystalline structure of ZnS was characterized by powder X-ray diffraction (XRD), and XRD data were collected on a D/Max-RA Diffractometer (DX-2600, Dan-Dong China) with Cu Kα-radiation (λ = 0.1548 nm) operated at 40 kV and 100 Ma. The amount of degradation of MB was measured using a visible spectrophotometer (v-1100D) at a wavelength of 664 nm against a blank of DW. UV-vis absorption spectra of the synthesized samples dispersed in DI water were recorded in the range 200–800 nm with a double beam UV-vis spectrophotometer (model: SPECORD® 200 PLUS, analytik Jena). The Fourier transform infrared spectra of samples were performed by the KBr pellet technique on a Fourier transform infrared spectrometer (IR Nicolet PerkinElmer Co.). Meanwhile, the specific surface area (SSA) was measured by nitrogen adsorption–desorption according to the BET method using the QUADRASORB SI automated surface area and pore size analyzer (Quantachrome Instruments, USA). The UV-vis diffuse reflectance spectra of the samples were obtained by using a Agilent Cary-100 UV-vis spectrophotometer, which was equipped with an integrating sphere, and BaSO4 was used as a reflectance standard.2.4. Photocatalytic activity tests
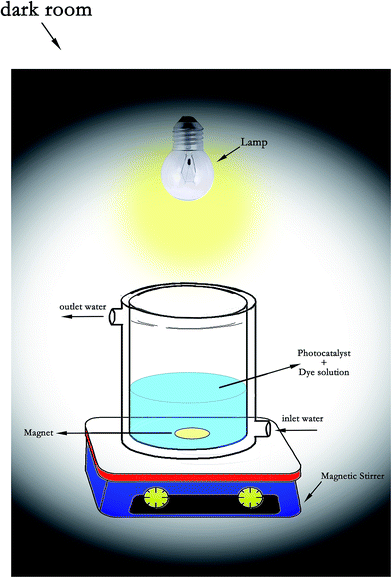
The photocatalytic reactor (Fig. 1) is a cylindrical Pyrex-glass cell with 100 mL capacity. A 300 W halogen lamp as the visible light source (emission range of 400–800 nm) was placed in a quartz lamp holder which was above the photoreactor cell. Photocatalytic activity of the obtained products was investigated by photodegradation of the MB dye in an aqueous medium, which is an aromatic compound (C16H18N3ClS). Typically, a photocatalytic reactor with a 100 mL capacity was loaded with 0.005 g L−1 MB dye and 0.05 g L−1 (0.5 g per 100 mL) of photocatalyst samples. The temperature of the reactor was controlled throughout the experiments by circulating water in the jacketed wall reactor. The adsorption behavior of the MB dye with the synthesized sample was studied first. For the absorption measurements, the dye solution loaded with the photocatalyst was stirred continuously in the dark for 50 min, then 3 mL of the suspension was taken out at regular times and centrifuged to remove the photocatalyst, the absorbance of the sample was measured at the maximum absorbance wavelength of 664 nm.28For visible light photocatalysis, the solution was magnetically stirred for 0.5 h in the dark to ensure the establishment of an adsorption–desorption equilibrium between the catalyst surface and the MB dye before irradiation. Then, the solution was exposed under visible irradiation from a 300 W halogen lamp under continuous stirring to ensure that the suspension was uniform during the reaction. The distance between the reactor and the lamp was maintained at 10 cm. At regular time intervals, the suspension was centrifuged to remove the photocatalyst. UV-vis absorption spectra were monitored at the characteristic absorption peak wavelength of 664 nm of the MB dye, then the absorbance of the sample was measured. All the experiments were conducted at room temperature.
According to the Beer–Lambert law, the percentage of degradation efficiency of MB (D (%)) is calculated as follows in eqn (1):11,28
 | (1) |
3. Results and discussion
3.1. Phase structure study
The XRD patterns of the obtained products are illustrated in Fig. 2. It could be readily indexed that the dandelion-ZnS, raspberry-ZnS and flower-ZnS samples possess typical hexagonal wurtzite phase crystal structures (JCPDS Card no. 75-1534). And the diffraction peaks of ball-ZnS can be perfectly confirmed as cubic zinc blende (JCPDS Card no. 05-0566). The sharp and narrow diffraction peaks suggest good crystallinity of the ZnS microspheres. There are no other peaks for impurity observed in all the samples except the flower-ZnS sample, revealing the high purity of the as-synthesized ZnS whereas some impure peaks found in the flower-ZnS sample are probably caused by the existence of an organic polymer.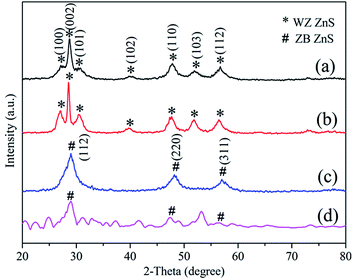 | ||
| Fig. 2 The XRD patterns of the as obtained products: (a) dandelion-ZnS, (b) raspberry-ZnS, (c) ball-ZnS and (d) flower-ZnS. | ||
3.2. Morphology
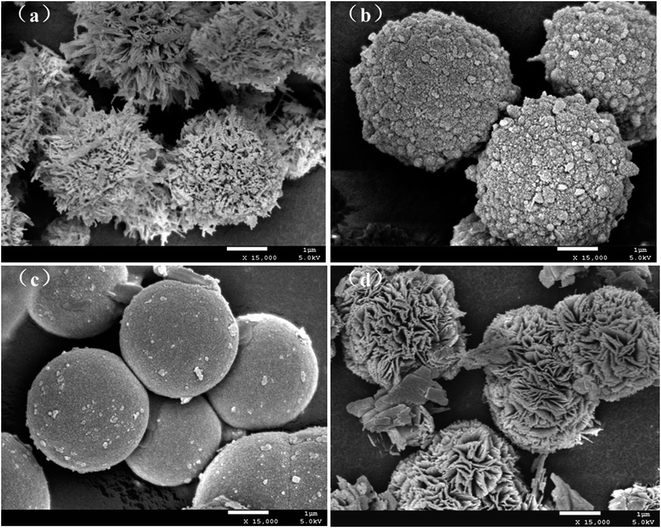
The surface topography features of the synthesized ZnS was carried out by SEM. In Fig. 3a–d, dandelion-ZnS, raspberry-ZnS, ball-ZnS and flower-ZnS all show 3D microspherical structures. Fig. 3a is the SEM micrograph of the dandelion-like ZnS samples, and the microspherical structure of the dandelion-ZnS sample is assembled by an inter-twisting wire network with diameters in the range of 2–4 μm. The microspherical structure of raspberry-like ZnS is composed of nearly particles with diameter distributions of about 3–4 μm (Fig. 3b). The surface of the ball-like ZnS sample is very fine smooth with diameters of about 3–4 μm (Fig. 3c). The SEM image in Fig. 3d of the sample shows flower-like ZnS microspheres assembled with aligned high-density nanosheets with diameters of about 3 μm.3.3. Fourier transform infrared spectroscopy (FT-IR)
Further evidence for the surface properties of the samples was gathered using FT-IR spectroscopy. The FTIR spectra of different morphologies of ZnS nanocrystal powder are shown in Fig. 4 respectively. As shown in the IR spectra, there are four peaks of th eZnS nanocrystal at 1115, 988, 618 and 495 cm−1 in Fig. 4, respectively. They result from the Zn–S vibration.29 On the other hand, the broad band appearing at the wave from 3200 to 3650 and at 1632 cm−1 are ascribed to the stretching vibration of the O–H bond and the bending vibration of the H–O–H bond from water molecules on the external surface of the products, respectively.26 Meanwhile flower-ZnS samples show other adsorption characteristic peaks (Fig. 4d) which are probably caused by the existence of an organic polymer impurity. These are in agreement with XRD results.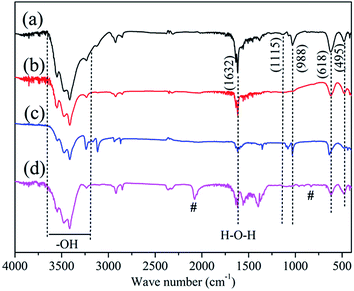 | ||
| Fig. 4 FT-IR spectra of the ZnS samples: (a) raspberry-ZnS, (b) dandelion-ZnS, (c) ball-ZnS and (d) flower-ZnS. | ||
3.4. BET specific surface area analysis
Fig. 5 shows nitrogen adsorption–desorption isotherms of different morphologies of ZnS samples. From Fig. 5, the dandelion-ZnS sample can be classified as a type-II isotherm, which is characteristic of macropore materials. The nitrogen adsorption–desorption isotherms of the raspberry-ZnS sample show a type-IV isotherm26,30 with a type H2 hysteresis loop, which is typical of mesoporous materials. While the adsorption–desorption isotherms of the flower-ZnS sample can be classified as type-III, with the conical macropore. The isotherms of the ball-ZnS sample can be ascribed to the combination of type-I, and this sample is a pore-free material. These results are in agreement with the SEM results.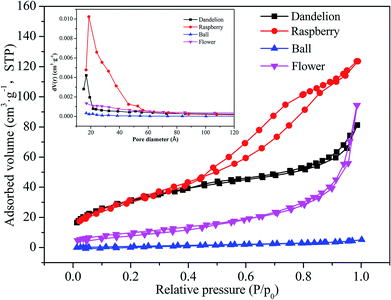 | ||
| Fig. 5 Typical nitrogen adsorption–desorption isotherms of ZnS samples with different morphologies. Inset: pore size distribution curve of different morphologies of ZnS samples. | ||
Pore size distribution curve of ZnS samples with different morphologies are shown in the inset of Fig. 5. To further study the texture and surface properties of ZnS, the specific surface area and pore volume were analyzed according to the BJH method (inset of Fig. 5) and are summarised in Table 2. The special surface areas of the raspberry-ZnS, dandelion-ZnS, ball-ZnS and flower-ZnS samples are 112 m2 g−1, 119 m2 g−1, 5.89 m2 g−1 and 37.4 m2 g−1, respectively. This change is a consequence of different pore structures.
| Sample | L (μm) | SBET (m2 g−1) | Vp (cm3 g−1) |
|---|---|---|---|
| Dandelion-ZnS | 3–4 | 119 | 0.191 |
| Raspberry-ZnS | 3–4 | 112 | 0.126 |
| Ball-ZnS | 3–4 | 5.89 | 0.008 |
| Flower-ZnS | 3 | 37.4 | 0.146 |
3.5. Optical absorption properties
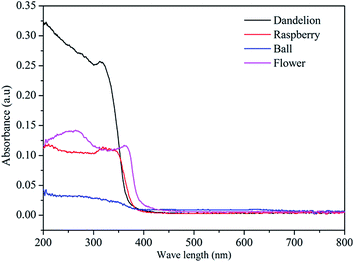
The optical properties of as-prepared ZnS were investigated by UV-visible diffuse reflectance spectra. Fig. 6 shows the UV-vis diffuse reflectance spectra of the samples. As can be seen, the dandelion-ZnS sample has a stable shoulder peak observed at 315 nm, while the raspberry-ZnS sample has a sharp adsorption peak at around 321 nm, and the absorbance peak intensity of the raspberry-ZnS sample is lower than that of dandelion-ZnS. The ball-ZnS sample has a lower absorbance in the ultraviolet region. The flower-ZnS sample has a broad absorption band centered at around 264 nm and a small but sharp peak at 363 nm with a slight red shift compared with that of the raspberry-ZnS, dandelion-ZnS and ball-ZnS samples. In addition, the dandelion-ZnS, raspberry-Zn and ball-ZnS samples have an absorption edge at about 380 nm, while the flower-ZnS sample has broader absorption with an absorption edge of around 420 nm. The wavelength distribution of the absorbed light is an important property of photocatalysts.31,32 These samples show similar absorbance in the ultraviolet region which is located at about 390 nm. The higher absorbance indicates better photoactivity as shown in Fig. 8.The band gap of the semiconductor can be deduced from the equation below:33,34
| αhv = A(hv − Eg)n/2 | (2) |
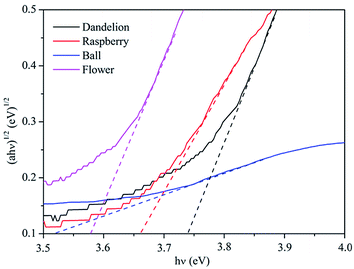 | ||
| Fig. 7 Plot of (αhv)1/2 versus energy (hv) for the band gap energy of ZnS samples with different morphologies. | ||
| Sample | Band gap (eV) | Transition type | Structure |
|---|---|---|---|
| Dandelion-ZnS | 3.74 | Direct transition | Hexagonal wurtzite |
| Raspberry-ZnS | 3.66 | Direct transition | Hexagonal wurtzite |
| Ball-ZnS | 3.52 | Direct transition | Cubic zinc blende |
| Flower-ZnS | 3.57 | Direct transition | Hexagonal wurtzite |
3.6. Photocatalytic performance
The experimentally obtained absorption spectra for the MB dye are shown in Fig. 9, which was in the presence of the raspberry-ZnS sample and taken at different irradiation times. It is found that the intensity of the adsorption peak at 664 nm is gradually diminished with increasing irradiation time. There is no new adsorption band appearing which indicates that the MB dye has been completely photodegraded. Upon visible light irradiation, the colour of the MB dye solution is rapidly degraded with time, and the corresponding digital photographs are shown in the inset of Fig. 9.
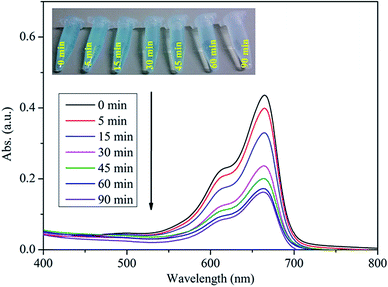 | ||
| Fig. 9 UV-vis absorption spectra of the MB dye solution collected at different time intervals after addition of the raspberry-ZnS sample and after irradiation by visible light. | ||
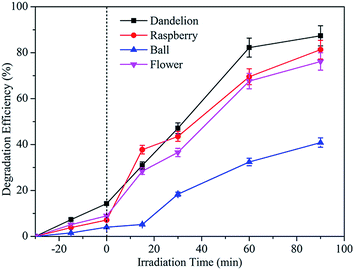
As shown in Fig. 9, it is clear that the MB dye solution becomes almost colourless after irradiation for only 90 min with a degradation efficiency of ∼88%, indicating the superior performance of the synthesized ZnS (raspberry-ZnS sample) for photo-degradation of MB dye.
 | (3) |
For low concentrations of dyes (k2C ≪ 1), neglecting k2C, the equation above can be simplified to the pseudo-first-order kinetic model equation as follows in eqn (4):26,37
 | (4) |
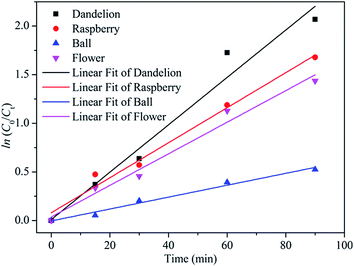
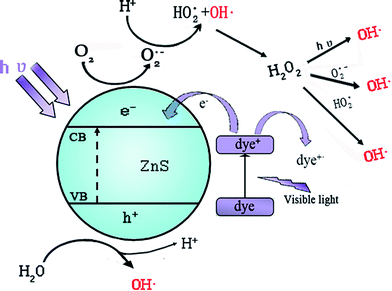
Fig. 10 gives the Langmuir–Hinshelwood kinetics for photocatalytic degradation of MB for four different morphologies of ZnS samples. The rate constants (K) were determined from the linear relationship of ln(C0/Ct) versus irradiation time. Hence, the obtained rate constants (K) and corresponding coefficients (R2) were calculated and are presented in Table 4. From this, the R2 values for linear from pseudo-first-order reaction kinetic are higher than 0.96, indicating a rather good correlation between kinetics for ZnS degradation of MB and the pseudo-first-order reaction kinetics. The photodegradation rate constants (K) of MB for the dandelion-ZnS, raspberry-ZnS, ball-ZnS and flower-ZnS samples are 0.018 min−1, 0.024 min−1, 0.006 min−1 and 0.016 min−1, respectively. It can be seen that the K value for MB degradation over the raspberry-ZnS sample is the highest, which is about 1.5 times and 4 times that of the ball-ZnS and flower-ZnS sample, respectively. The results above indicated that the K value for MB degradation over the raspberry-ZnS samples is higher than that of the others. It is generally known that a higher K value means a higher degradation ratio. From the result of the experiment above, the dandelion-ZnS and raspberry-ZnS samples have higher surface areas. The photocatalytic process is related to the adsorption and desorption of pollutant molecules on the surface of catalysts. Hence, a large specific surface area is beneficial to absorb more light and could increase more unsaturated surface coordination sites to improve the photocatalytic performance.26,38 In addition, for the dandelion-ZnS and raspberry-ZnS samples, the large specific surface area can also offer more opportunities for the diffusion and mass transportation of pollutants in the photochemical degradation reaction.39 A slightly lower specific surface area and pore-free structure of the ball-ZnS sample leads to a little lower degradation rate constant than those of the dandelion-ZnS and raspberry-ZnS samples. The results have clearly established a better efficacy of the material with a high specific surface area and porous structure. As shown in Table 2, the specific surface area of the raspberry-ZnS sample is determined to be 112 m2 g−1, higher than that of the others. Hence, the higher photocatalytic activity of the raspberry-ZnS sample can be attributed to the large specific surface area. The results are consistent with the conclusions from the photocatalytic degradation curves presented in Fig. 8. Furthermore, there are hydroxyl groups attaching on the surface of all the samples as shown in Fig. 4. The hydrophilic hydroxyl groups at the surface can afford excellent water solubility for the samples which is favorable for adsorbing more pollutants, which lead to high photocatalytic efficiencies.26
| Sample | D% | SBET (m2 g−1) | R2 | K (min−1) |
|---|---|---|---|---|
| Dandelion-ZnS | 88 | 119 | 0.980 | 0.018 |
| Raspberry-ZnS | 82 | 112 | 0.961 | 0.024 |
| Ball-ZnS | 41 | 5.89 | 0.980 | 0.006 |
| Flower-ZnS | 77 | 37.4 | 0.975 | 0.016 |
4. Conclusions
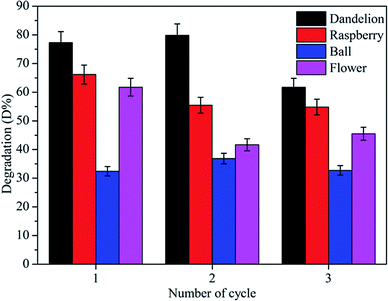
In this work we have synthesized four morphologies of ZnS microstructures by the hydro-thermal method. Photocatalytic abilities of ZnS were investigated by measuring MB photodegradation under visible light. The porous ZnS microstructures show higher degradation efficiency than the smooth microspheres after 90 min. There is a good correlation between mechanism of visible light driven dye degradation activity in our synthesized samples and the pseudo-first-order reaction kinetics. The remarkable photocatalytic abilities of the samples may be due to the high specific surface areas, unique morphology, porous structures and high hydrophilicity. The reusability of the smooth microspheres is better. The porous ZnS microstructures may be damaged during the degradation process. In addition, the present investigation has provided a simple route for the synthesis of 3D architectures of ZnS nanocrystals with controllable morphologies and potential photocatalytic dye degradation activity in environmental remediation applications.Acknowledgements
This work was supported by a grant from the Two-Way Support Programs of Sichuan Agricultural University (Project No. 03570113), the Education Department of Sichuan Provincial, PR China (Grant No. 16ZA0039). We are very grateful to Prof. Xianying Zeng and Dr Xianxiang Wang for revising the language of the article.References
- A. Kajbafvala, H. Ghorbani, A. Paravar, J. P. Samberg, E. Kajbafvala and S. K. Sadrnezhaad, Superlattices Microstruct., 2012, 51, 512–522 CrossRef CAS
.
- D. Chatterjee and S. Dasgupta, J. Photochem. Photobiol., C, 2005, 6, 186–205 CrossRef CAS
.
- A. Fujishima, T. N. Rao and D. A. Tryk, J. Photochem. Photobiol., C, 2000, 1, 1–21 CrossRef CAS
.
- J. Liqiang, Q. Yichun, W. Baiqi, L. Shudan, J. Baojiang, Y. Libin, F. Wei, F. Honggang and S. Jiazhong, Sol. Energy Mater. Sol. Cells, 2006, 90, 1773–1787 CrossRef
.
- M. R. Hoffmann, S. T. Martin, W. Choi and D. W. Bahnemann, Chem. Rev., 1995, 95, 69–96 CrossRef CAS
.
- N. Morales-Flores, U. Pal and E. Sánchez Mora, Appl. Catal., A, 2011, 394, 269–275 CrossRef CAS
.
- X. Fang, T. Zhai, U. K. Gautam, L. Li, L. Wu, Y. Bando and D. Golberg, Prog. Mater. Sci., 2011, 56, 175–287 CrossRef CAS
.
- S. A. Acharya, N. Maheshwari, L. Tatikondewar, A. Kshirsagar and S. K. Kulkarni, Cryst. Growth Des., 2013, 13, 1369–1376 CAS
.
- X. Yu, J. Yu, B. Cheng and B. Huang, Chem.–Eur. J., 2009, 15, 6731–6739 CrossRef CAS PubMed
.
- B. Subhajit and K. Soumitra, Nanotechnology, 2008, 19, 045710 CrossRef PubMed
.
- A. K. Kole, C. S. Tiwary and P. Kumbhakar, CrystEngComm, 2013, 15, 5515–5525 RSC
.
- J.-S. Hu, L.-L. Ren, Y.-G. Guo, H.-P. Liang, A.-M. Cao, L.-J. Wan and C.-L. Bai, Angew. Chem., 2005, 117, 1295–1299 CrossRef
.
- D. Li and H. Haneda, Chemosphere, 2003, 51, 129–137 CrossRef CAS PubMed
.
- K. Kočí, L. Obalová, L. Matějová, D. Plachá, Z. Lacný, J. Jirkovský and O. Šolcová, Appl. Catal., B, 2009, 89, 494–502 CrossRef
.
- N. Soltani, E. Saion, W. M. M. Yunus, M. Erfani, M. Navasery, G. Bahmanrokh and K. Rezaee, Appl. Surf. Sci., 2014, 290, 440–447 CrossRef CAS
.
- Q. Wan, T. H. Wang and J. C. Zhao, Appl. Phys. Lett., 2005, 87, 083105 CrossRef
.
- F. Lu, W. Cai and Y. Zhang, Adv. Funct. Mater., 2008, 18, 1047–1056 CrossRef CAS
.
- Z.-G. Chen, L. Cheng and J. Zou, CrystEngComm, 2011, 13, 5885–5890 RSC
.
- Y. Zhao, Y. Zhang, H. Zhu, G. C. Hadjipanayis and J. Q. Xiao, J. Am. Chem. Soc., 2004, 126, 6874–6875 CrossRef CAS PubMed
.
- S. Biswas, S. Kar and S. Chaudhuri, J. Phys. Chem. B, 2005, 109, 17526–17530 CrossRef CAS PubMed
.
- Q. Xiong, G. Chen, J. D. Acord, X. Liu, J. J. Zengel, H. R. Gutierrez, J. M. Redwing, L. C. Lew Yan Voon, B. Lassen and P. C. Eklund, Nano Lett., 2004, 4, 1663–1668 CrossRef CAS
.
- S. H. Yu and M. Yoshimura, Adv. Mater., 2002, 14, 296–300 CrossRef CAS
.
- H. Li, D. Zhang, P. Maitarad, L. Shi, R. Gao, J. Zhang and W. Cao, Chem. Commun., 2012, 48, 10645–10647 RSC
.
- X. Du, D. Zhang, L. Shi, R. Gao and J. Zhang, Nanoscale, 2013, 5, 2659–2663 RSC
.
- M. Li, F. Wang, Z. Wang, M. Zubair Iqbal, Q.-U.-A. Javed, Y. Lu, M. Xu and Q. Li, Mater. Lett., 2013, 112, 81–83 CrossRef CAS
.
- F. Chen, Y. Cao and D. Jia, Chem. Eng. J., 2013, 234, 223–231 CrossRef CAS
.
- J. Zhao, J. Yin and M. Yang, J. Alloys Compd., 2013, 579, 45–49 CrossRef CAS
.
- R. Chauhan, A. Kumar and R. Pal Chaudhary, J. Lumin., 2014, 145, 6–12 CrossRef CAS
.
- H. Yang, J. Zhao, L. Song, L. Shen, Z. Wang, L. Wang and D. Zhang, Mater. Lett., 2003, 57, 2287–2291 CrossRef CAS
.
- S. Ge, K. Zhao and L. Zhang, J. Nanopart. Res., 2012, 14, 1–11 CrossRef
.
- S. A. Ansari, M. M. Khan, M. O. Ansari, J. Lee and M. H. Cho, J. Phys. Chem. C, 2013, 117, 27023–27030 CAS
.
- M. Li, F. Wang, Z. Wang, M. Zubair Iqbal, Q.-U.-A. Javed, Y. Lu, M. Xu and Q. Li, Mater. Lett., 2013, 112, 81–83 CrossRef CAS
.
- J. Zeng, H. Wang, Y. Zhang, M. K. Zhu and H. Yan, J. Phys. Chem. C, 2007, 111, 11879–11887 CAS
.
- H. Cheng, B. Huang, Y. Dai, X. Qin and X. Zhang, Langmuir, 2010, 26, 6618–6624 CrossRef CAS PubMed
.
- T. Trindade, P. O’Brien and N. L. Pickett, Chem. Mater., 2001, 13, 3843–3858 CrossRef CAS
.
- S. Xiong, B. Xi, C. Wang, D. Xu, X. Feng, Z. Zhu and Y. Qian, Adv. Funct. Mater., 2007, 17, 2728–2738 CrossRef CAS
.
- H. Pouretedal and M. Keshavarz, Int. J. Phys. Sci., 2011, 6, 6268–6279 CAS
.
- Y. Qiu, M. Yang, H. Fan, Y. Zuo, Y. Shao, Y. Xu, X. Yang and S. Yang, CrystEngComm, 2011, 13, 1843–1850 RSC
.
- F. Dong, H. Liu, W.-K. Ho, M. Fu and Z. Wu, Chem. Eng. J., 2013, 214, 198–207 CrossRef CAS
.
- H. R. Pouretedal, A. Norozi, M. H. Keshavarz and A. Semnani, J. Hazard. Mater., 2009, 162, 674–681 CrossRef CAS PubMed
.
- T. Aarthi, P. Narahari and G. Madras, J. Hazard. Mater., 2007, 149, 725–734 CrossRef CAS PubMed
.
- N. Daneshvar, D. Salari and A. R. Khataee, J. Photochem. Photobiol., A, 2003, 157, 111–116 CrossRef CAS
.
- M. Sharma, T. Jain, S. Singh and O. P. Pandey, Sol. Energy, 2012, 86, 626–633 CrossRef CAS
.
Footnote |
| † The authors wish it to be known that, in their opinions, Hanbing Rao and Zhiwei Lu should be regarded as joint First Authors. |
| This journal is © The Royal Society of Chemistry 2016 |

