DOI:
10.1039/C6RA08683G
(Paper)
RSC Adv., 2016,
6, 46291-46298
Investigation of various fluorescent protein–DNA binding peptides for effectively visualizing large DNA molecules†
Received
5th April 2016
, Accepted 4th May 2016
First published on 5th May 2016
Abstract
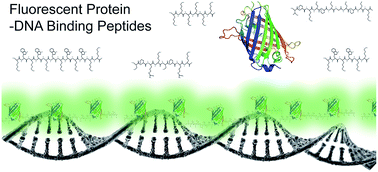
Large DNA molecules were visualized with novel fluorescent protein–DNA binding peptides (FP–DBPs). We constructed FP–DBPs by linking fluorescent protein to the N- or C-terminal of one or two peptides. We designed these DNA binding peptides from various DNA binding motifs such as oligo-lysine (K) and Lys-Trp (KW) repeats, TPKRPRGRPKK from high mobility group (HMG) chromosomal protein, and Ser-Pro-Arg-Lys (SPRK) from histone protein. We demonstrated the use of FP–DBP to stain large DNA molecules, and then analysed the fluorescence brightness and their binding affinity to double stranded DNA. This investigation provided HMG-tagged FP–DBP as the best DNA staining reagent in terms of fluorescence intensity, signal-to-noise ratio, and DNA binding affinity (Kd = 586 nM). Furthermore, we measured elongation of FP–DBP-stained DNA molecules tethered on the surface in order to evaluate FP–DBP-induced structural deformation.
Introduction
Recent advances in genome analysis technology have achieved a remarkable breakthrough to make DNA sequencing affordable in numerous biological applications.1 Although massive parallel short-read DNA sequencing technology opened up new vistas in the life sciences, enormous efforts are still required to overcome the limitations of short-read length, in order to resolve the issues of repeated sequences and haplotyping.2 Therefore, there is a pressing need for developing new technology for the analysis of extremely long DNA molecules in a cell. In this context, large DNA molecules are a promising platform for genomic analysis by visualizing entire DNA backbones under a fluorescence microscope.3 In genomics, large elongated DNA molecules have been utilized for genome-mapping platforms along with high-throughput sequencing technology.4,5 Alternatively, the visualization of large DNA molecules has been utilized for the study of DNA damage,6–8 DNA–protein interactions,9,10 and protein dynamics on DNA backbone.11 Furthermore, visualization of proteins associated with large DNA molecules, such as chemically modified histones and DNA binding proteins, is promising for the study of epigenomics.12–14
For visualization under a fluorescent microscope, large DNA molecules have to be stained with fluorescent dyes. Most experiments primarily utilize bis-intercalating dye of oxazole yellow homodimer (YOYO-1) or other TOTO series dyes depending on excitation wavelengths.15 These dyes only fluoresce when they bind DNA molecules, thereby achieving high contrast images. In addition, there are many alternative organic fluorescent dyes for visualization of DNA, such as EtBr, DAPI, and SYTO. However, these organic dyes have fundamental drawbacks such as cytotoxicity, structural deformation, and light-induced photocleavage, which limit their use for in vivo and in vitro applications.16 In particular, these issues are more critical for single DNA molecule experiments since intercalating dyes, under laser illumination, form reactive oxygen species, which often induce single or double strand breaks in the DNA.17 Therefore, laser power should be limited and anti-bleaching agent or enzyme-based oxygen scavenger should be added in DNA solution.
Given these concerns, we recently developed fluorescent protein–DNA binding peptide (FP–DBP) to visualize large DNA molecules without the limitations associated with using organic intercalating dyes.17 Our first FP–DBP consisted of FP linked with small DNA binding peptides at both ends (KWKWKKA-FP-AKKWKWK). Among the different colours of FPs available, we demonstrated green and red colour DNA staining using eGFP and mCherry, respectively. Although the first FP–DBP was a successful demonstration for DNA staining in in vivo and in vitro applications, there are numerous possibilities to construct novel FP–DBP variants using diverse DNA binding motifs available from DNA binding proteins. For example, high mobility group (HMG) chromosomal proteins contain three consensus-sequences of highly conserved DNA binding domain (TPKRPRGRPKK), which is known to bind preferentially to the minor groove with electrostatic interactions.18,19 As another example, histone proteins have a DNA binding motif (SPRK repeats) that specifically binds to the minor groove.20,21
In this paper, we investigated the characteristics of several newly constructed FP–DBPs. We utilised lysine oligomer, and varied the number of lysine–tryptophan repeats. In addition, we linked two HMG motifs, and two SPRK motifs to eGFP for DNA staining in order to evaluate their binding capabilities. From this screening, we found that HMG peptide-tagged eGFP (TPKRPRGRPKK-GGSGG-eGFP-GGSGG-KKPRGRPRKPT) was the best because it had the brightest fluorescence intensity and the highest DNA binding affinity (Kd = 586 nM), which was two-order stronger than the first FP–DBP. Moreover, we confirmed very little structural deformation induced by FP–DBP binding from measuring stretches of FP–DBP stained DNA molecules.
Experimental
Chemicals and materials
All DNA primers and oligonucleotides were from Bioneer (Daejeon, Korea). All enzymes were purchased from New England Biolabs (Ipswich, MA) and NeutrAvidin was from Pierce (Rockford, IL). T4 GT7 DNA (165
644 bp) was purchased from Nippon Gene (Tokyo, Japan) and λ DNA (48.5 kb) was from Bioneer (Daejeon, Korea). Escherichia coli strains DH5a and BL21 (DE3) were purchased from Yeastern (Taipei, Taiwan). Ni-NTA agarose resin and disposable column (empty gravity column) were purchased from Qiagen (Venlo, Netherlands). mPEG–succinimidyl valerate and biotin–PEG–succinimidyl carbonate (both MW 5000) were from Laysan Bio (Arab, AL). Epoxy was purchased from Devcon (Riviera Beach, FL). N-Trimethoxymethylsilylpropyl-N,N,N-trimethylammonium chloride in 50% methanol was purchased from Gelest (Morrisville, PA) and N-[3-(trimethoxysilyl)propyl]ethylene diamine was from Sigma (St. Louis, MO).
Microscope
An inverted microscope (Zeiss Observer A1, AG, Germany) equipped with a 63× Zeiss Plan-Neofluar oil immersion objective illuminated by a solid-state laser (Coherent Sapphire 488, Santa Clara, CA) was used to view images. The laser light was focused into the multimode optical fibre (BFH-22-550, Thorlabs, Newton, NJ) and passed through a holographic notch filter for 488 nm (Semrock, Rochester, NY) that was installed to prevent 488 laser light from reaching the electron multiplying charge coupled device digital camera (Evolve EMCCD, Roper Scientific, Tucson, AZ). Fluorescence images were captured by an EMCCD camera and stored as 16 bit TIFF format generated by software Image Pro Plus (Media Cybernetics, Rockville, MD). ImageJ was utilized with Java plug-in developed in our lab for image analysis.
Protein construction and purification
Molecular cloning and protein purifications were performed as previously described.17 Using pET-15b (Novagen, Germany) and its restriction sites NdeI and BamHI, typical restriction subcloning was done. For tagging DNA binding peptide, the following PCR primers were used with pEGFP-N1 (Clontech, Mountain View, CA): forward primer 5′-ATG TTG CAT ATG – inserted amino acid codon and linkers – ATG CGT GAG CAA GGG CGA GGA GC-3′, and reverse primer 5′-ATG TTG GGA TCC TTA – inserted amino acid anticodon and linkers – CTT GTA CAG CTC GTC CAT GCC-3′. Constructed pET-FP(eGFP)-DBP were transformed into DH5α and BL21 strains. BL21 cells were cultured until confluency reached over OD600 2.0, induced with IPTG of final concentration 1 mM, cultured overnight, and purified with 6× His-tag resin. After affinity chromatography, no further protein purification was performed. Purified proteins glowed in green colour, buffer-exchanged by 1× PBS (phosphate-buffered saline: 137 mM NaCl, 2.7 mM KCl, 10 mM Na2HPO4, 1.8 mM KH2PO4, pH 7.4), and stored at 4 °C.
Glass surface preparation
The glass surface was prepared according to a previously described method.22 The glass coverslips were soaked in piranha etching solution (30
:
70 v/v H2O2/H2SO4) for 2 hours. After rinsing the coverslips thoroughly with deionized water, two types of derivatised surfaces were made. To adhere the positive charges on the surface, 200 μL of N-trimethoxymethyl silylpropyl-N,N,N-trimethylammonium chloride in 50% methanol was added to 200 mL of deionized water. The glass coverslips were incubated in this solution for 12 hours at 65 °C, followed by rinsing with ethanol. To add primary amine groups, 2 mL of N-[3-(trimethoxysilyl)propyl] ethylenediamine was added to 200 mL of methanol and 10 mL of glacial acetic acid. The glass coverslips were incubated in this solution for 30 minutes, sonicated for 15 minutes, incubated again for 3–12 hours at room temperature, and rinsed with methanol and ethanol. These derivatised glass surfaces were used within 2 weeks of their preparation. Furthermore, aminosilanized glass was coated with PEG. 80 mg of mPEG–succinimidyl valerate and 1–2 mg of biotin–PEG–succinimidyl carbonate were added in freshly made 0.1 M sodium bicarbonate. The solution was completely mixed and briefly centrifuged. 50 μL of PEG solution was dropped on a clean slide glass, covered with aminosilanized glass for 3 hours to overnight, and rinsed with water.
Microchannel preparation
Fabrication of polydimethylsiloxane (PDMS) microfluidic devices followed standard rapid prototyping procedures as previously described.17 The patterns on a silicon wafer for microchannels (3 μm high and 100 μm wide) were fabricated using soft lithography. The Cr mask was obtained from Amed Inc. (Seoul, Korea). SU-8 2005 photoresist (Microchem, Newton, MA) was spin-coated onto the silicon wafer to make a 3 μm high photoresist layer. After spin coating, the baked wafer was exposed to 350 nm radiation. The patterned wafer was baked again and developed using an SU-8 developer. The height was measured by a profilameter (Dektak XT, Bruker). The PDMS pre-polymer mixed with curing agent (10
:
1 weight ratio) was cast on the patterned wafer and cured at 65 °C for 4 hours or longer. Cured PDMS was peeled off from the patterned wafer, and the PDMS devices were treated in an air plasma generator for 30 s with 100 W (Femto Science Cute Basic, Korea) to make the PDMS surface hydrophilic. PDMS devices were stored in water and air-dried before use.
Flow chamber
A flow chamber was prepared by placing a cover slip on the acrylic holder with a spacing of 100 μm between the two, using a double-sided tape as previously described.23 The inlet and outlet holes of the acrylic holder were fabricated using custom laser cutting. A yellow pipette tip was installed in the inlet port and a tubing line was connected to the outlet port with an epoxy bonding that was cured at room temperature for 5 minutes. Further, the cover slip was fixed on the glass slide using a double-sided 3 M tape. The dimensions of the flow chamber were 3 × 17 × 0.1 mm (L × W × H) and the total volume of the flow chamber was 5.1 μL. A syringe pump, NE-1000 (New Era Pump Systems Inc., Wantagh, NY), was used to control the buffer delivery into the flow cell. After the preparation of PEGylated surfaces, 25 μg mL−1 of NeutrAvidin in T50 solution (10 mM Tris, 50 mM NaCl, pH 8.0) was loaded and kept at room temperature for 5 minutes. One micromolar λ DNA overhang oligo (5′-pGGGCGGCGACCT-TEG-biotin-3′) was loaded into the flow cell, and kept at room temperature for 5 minutes. The λ DNA, T4 DNA ligase, and the reaction buffer were added and kept at room temperature for 30 minutes. After washing the residual enzyme mixture, the diluted DNA staining molecules (YOYO-1 for 1 μM in 1× TE, fluorescent proteins for ∼100 nM in 1× TE) flowed into the channels resulting in the visualization of the tethered DNA. Stained DNA molecules were visualized under a continuous flow of the diluted molecules with a flow rate maintained at 100 μL min−1.
Electrophoretic mobility shift assay
A 52-mer random sequence oligonucleotide (5′-CTA CTA GCA CAA TCG ACT GTA CGG ACC GAT CGA GTC ACT AGC AGT CTA GCA A-3′) and its complementary sequence oligonucleotide are hybridized into double stranded DNA. The same molar concentrations of two oligonucleotides in a microcentrifuge tube were soaked in boiled water, followed by cooling down to the room temperature. Hybridized double strands DNA oligo was used at final concentration of 50 nM. Each protein was diluted with 1× TE for corresponding molar concentrations. The diluted proteins, DNA oligomer, and 1× TE buffer to adjust total reaction volume (20 μL) were added to each sample tube. Each sample was loaded into 4% agarose gel. After running 45 minutes at 130 V constant, the gel was stained with SYBR Gold for 30 minutes. Images of retarded DNA were captured with CCD camera (WGD-20, Daihan Scientific Co., Korea) on UV transilluminator (WUV-M20, Daihan Scientific Co., Korea). Fraction bounds of each lane were represented as intensity profiles of bound proteins/free DNA, and analysed with ImageJ Gel Analyze. Apparent dissociation constants of protein concentrations were calculated as Kd = ((1 − f)/f) × [protein]total where f is the bound fraction.
Finite element analysis for tethered DNA in a shear flow
COMSOL Multiphysics (Burlington, MA, USA) was used to analyse DNA stretching numerically with considering drag force24 and structure deformation induced by flow. The numerical model was solved by using the “fluid–structure interaction (FSI)” module.25 In this numerical study, a 2D model was used to study DNA molecule stretching in flow field and the model involved a DNA molecule and a microchannel. In detail, the diameter of DNA and the full length of completely stretched DNA were 2 nm and 16.3 μm, respectively, and the total height of the microchannel was 100 μm. An angle of slope between the DNA molecule and the bottom wall of microchannel was set to be 1.8° to match microscopic focal depth of 0.5 μm. The fluid flow in the channel was described by the incompressible Navier–Stokes equations for the velocity field, u, and the pressure, p, in the spatial moving coordinate system: |
 | (1) |
here, I denotes the unit diagonal matrix, and F, η, ρ and T are the volume force affecting the fluid, the dynamic viscosity and density of the fluid, and the absolute temperature of system, respectively. Assume that no gravitation or other volume forces affect the fluid, so that F = 0. The structural deformations were solved using a linear elastic formulation. The DNA molecule was considered to be fixed on the bottom of the fluid channel. All other object boundaries experience a load from the fluid, given by |
FT = −n(−pI + η(∇u + (∇u)T))
| (3) |
where n is the normal vector to the boundary. This load represents a sum of pressure and viscous forces. The fluid–structure interaction (FSI) module combined fluid flow with solid mechanics to analyse the interaction between two phases. For the flow interface, the flow in microchannel was considered as laminar flow and no slip on the microchannel wall. Hence the components of the velocity field u in a flow chamber are: |
ux = umax(1 − y2/h2), uy = 0
| (4) |
where umax, ux, uy, y and h are the maximum velocity in the middle of the laminar flow, the x-component and y-component of u, the distance from the middle of the channel and half of the channel height, respectively. In the simulation, umax was set to be 7 mm s−1, which was experimentally determined by imaging moving fluorescent beads. Solution density was 103 kg m−3 and its viscosity was set to be 1 cP (10−3 Pa s). For DNA, Young's modulus was 2 × 10⁹ Pa, Poisson's ratio 0.4, and its density was 1.7 × 10³ kg m−3.26–28
Results and discussion
Various FP–DBPs to visualize large DNA molecules
Fig. 1 presents T4 DNA molecules (166 kbps, 55.8 μm) stained with seven FP–DBPs that we designed. First, we utilized a well-known DNA binding motif of Lys-Trp-Lys in N-terminal (KWK: KWKKA-eGFP).29 Second, we increased the number of Lys-Trp (KW) repeats to pentamer such as (KW)5 in N-terminal only and 2(KW)5 for both N- and C-terminals. Third, we prepared lysine hexamer (2K6) to see the positive charge effect. Fourth, we adapted DNA binding motifs from high mobility group (HMG) chromosomal protein (TPKRPRGRPKK). HMG-1 peptide sequence (TPKRPRGRPKK), with six positively charged basic amino acid residues (Lys and Arg), is known as a minor groove binder.18 The last design of 2(SPRK)2 was originated from histone H1 as repeated Ser-Pro-Arg-Lys (SPRK) motifs.21 Each FP–DBP was mixed with T4 DNA and then loaded into microchannel (100 μm × 3 μm), where capillary force elongated and then deposited DNA molecules onto positively charged glass surface.30 Five out of seven FP–DBPs successfully visualized the entire DNA backbones.
 |
| Fig. 1 Large, single-molecule T4 DNA (166 kbp) stained by different FP–DBPs compared with YOYO-1. Single DNA molecules were stretched within a microfluidic channel of 100 μm (width) × 3 μm (height), and deposited onto positively charged glass surfaces. Full amino acid sequences of DNA binding peptides are denoted in the right column. Scale shows 90 μm with 10 μm ticks, and 55.8 μm represents T4 DNA length of 166 kbp. | |
On the contrary, KWK and 2(KW)5 were not successful in visualizing the DNA backbones. Although KWK is a well-known DNA binding motif,29 association of 200 μM FP–DBP (KWKKA-eGFP) to DNA was not observed in the gel shift assay (Fig. 2 and see ESI† for gel electrophoresis results). Thus, the binding affinity of KWKKA-eGFP might not be strong enough to stain DNA molecules. In contrast, 2(KW)5 showed strong affinity to DNA (Kd = 4.26 μM), which was even smaller than 2(KW)2 (Kd = 14.6 μM) and 2(SPRK)2 (Kd = 18.2 μM). Hence, the reason why 2(KW)5 could not visualize DNA backbone given its relatively high binding affinity cannot be simply explained. A possible explanation is that the density of eGFP may not be high enough to visualize DNA backbone on an epifluorescence microscope due to two long DNA binding peptides such as (KW)5KKA-eGFP-AKK(WK)5. Another notable characteristic for 2(KW)5 was that its binding curve was cooperative as shown in Fig. 2B; that is, n = 2 for Hill equation
|
θ/θmax = [FP:DBP]n/(Kdn + [FP:DBP]n)
| (5) |
 |
| Fig. 2 Dissociation constants (Kd) for various FP–DBPs. (A) Bars show dissociation constants for FP–DBPs. Kd values for FP–DBPs are as follows: 0.586 ± 76 μM for 2HMG, 1.28 ± 0.38 μM for 2K6, 2.93 ± 0.60 μM for (KW)5, 4.26 ± 1.18 μM for 2(KW)5, 14.6 μM ± 1.51 for 2(KW)2, and 18.2 ± 2.77 μM for 2(SPRK)2. (B) Fraction bounds for each FP–DBPs according to molar concentrations. These values were determined by gel shift assay using 52-mer random sequence double stranded DNA. FP–DBPs are 2HMG ( ), 2K6 ( ), (KW)5 ( ), 2(KW)5 ( ), 2(KW)2 ( ), 2(SPRK)2 ( ), and KWK ( ). Gel electrophoresis experiments were conducted 3–5 times; error bars represent the minimum and maximum values. Fraction bounds were analysed using ImageJ software, and Kd was calculated by the least square method for each average value. Each plot was fitted using Hill eqn (5) with parameters Vmax = 1, n = 1 for 2HMG, 2(KW)2, and 2(SPRK)2, n = 2 for (KW)5, 2(KW)5, and 2K6. | |
This cooperative binding suggested that the association of 2(KW)5 to the DNA caused local conformational changes to facilitate the binding on neighbouring sites further.31
Comparing the other FP–DBPs, 2HMG showed the best image quality in terms of brightness and contrast. Moreover, as depicted in Fig. 2 (see ESI† for gel binding images), 2HMG had the highest binding affinity (Kd = 586 ± 76.4 nM) to double stranded DNA as measured by the gel shift assay. It was also notable that 2HMG had two-order stronger affinity than the first FP–DBP of 2(KW)2 (Kd = 14.7 μM) that we previously reported.17
Fluorescence intensity for brightness and contrast
The characteristic of a good DNA staining reagent is that it should provide clear, high-contrast images of the DNA molecule. To achieve this, two features are important: the first is the fluorescence intensity per pixel and the second is the signal-to-noise (S/N) ratio. Fig. 3A compares intensity per pixel for FP–DBPs and YOYO-1, which illustrated that 2HMG, 2(KW)2, and 2K6 produced higher brightness than YOYO-1. It is known that the quantum yield for eGFP (0.66) is a little bit higher than YOYO-1 (0.52).32,33 However, the relative brightness, expressed as the product of extinction coefficient (ε) and quantum yield (QY) is 37
000 M−1 cm−1 for eGFP34 and 43
680 M−1 cm−1 for YOYO-1 respectively.35
 |
| Fig. 3 Fluorescence intensity per pixel. (A) Bars represent averaged intensity per pixel, which was obtained from the middle of stretched DNA in order to ignore wrapped molecular ends. Each data point represents more than 400 pixels (around 100 μm, 4 pixels = 1 μm). (B) Bars show background noises per pixel from the same data of (A) and (B). These data were obtained from DNA deposited onto the positively charged glass surfaces, and analysed without any adjustments of images. (C) S/N ratio: bars show intensity of stained molecules of (A) divided background noises of (B). | |
Although they possess the same eGFP fluorophore, the brightness of FP–DBPs differed (Fig. 3A). For example, 2(KW)5 and 2(SPRK)2 showed only half intensity compared to the other FP–DBPs. The observed intensity for 2(SPRK)2 could be explained by its low binding affinity (Fig. 2), leading to low density on DNA backbones. Meanwhile, half fluorescence intensity for (KW)5-stained DNA seemed more complicated. This was probably because (KW)5 shares similar structure of 2(KW)5, which may also be related to our observation that 2(KW)5 could not visualize DNA backbone.
In addition to fluorescence intensity per pixel, it is important to achieve high signal-to-noise ratio to obtain clear DNA images. Fig. 3C shows that YOYO-1 has a higher S/N ratio than any other FP–DBPs. This observation could be attributed to the fact that YOYO-1 only fluoresces when it intercalates DNA.36 In contrast, FP–DBPs might constantly generate background noise since their fluorescence intensity is independent on DNA binding. Nevertheless, there were considerable S/N ratio differences between FP–DBPs, varying from 3.3 to 6.2. These values might depend on the number of FP–DBPs randomly bound onto the glass surface, which might increase noise signals, though we attempted to wash unbound FP–DBPs from the surface. Among the FP–DBPs developed so far, 2HMG was the best in terms of brightness and S/N ratio.
In addition, we analysed fluorescence intensity profiles for FP–DBP stained DNA backbones as shown in Fig. 4. If FP–DBP had A/T or C/G preference, λ DNA image would show sequence dependence, since the λ genome has a C/G-rich region in the front and A/T-rich region in the middle.6 Moreover, KW repeat and HMG were reported to have sequence selectivity such as A/T preferences.37,38 As depicted in Fig. 4, YOYO-1-stained DNA showed a smoother profile than FP–DBP-stained DNA that was a little bit more fluctuating.
 |
| Fig. 4 Fluorescence intensity profile along DNA backbones. Microscopic images and their intensity profiles represent elongated λ DNA (48.5 kbp) monomer stained with YOYO-1 and various FP–DBPs. Each intensity profile of λ DNA is shown with single molecule DNA image, compared to in silico A/T frequency. Scale bar = 10 μm. | |
Nonetheless, only (KW)5 showed a little bit enhanced region in the middle, though not significant. Therefore, FP–DBPs developed so far show almost homogenous staining without sequence preference.
Structural integrity for FP–DBP-stained DNA molecules
One of the critical advantages of FP–DBPs is that they do not distort B-form DNA structure, while most of the intercalating dyes such as EtBr and YOYO-1 are known to severely distort the DNA structure, resulting in the increase of full contour length.16,17 However, DNA binding peptide may affect the DNA structure with positive charges of lysine and arginine residues and tryptophan intercalation. In order to characterize the degree of structural deformation, we measured the length of surface-tethered DNA molecules within continuous shear flow, where DNA polymer chains were highly extended.39,40 Fig. 5 shows that the lengths of FP–DBP-stained DNA molecules are relatively uniform with some deviation. The longest stretch was 14.6 ± 0.8 μm (89%) by 2(KW)2 and the shortest stretch was 13.4 ± 0.8 μm (82%) by 2HMG and these stretches were a little bit smaller (82–89%) compared to the contour length of B-form λ DNA 16.3 μm (48
502 × 0.337 nm). These variations were likely associated with different number of positively charged amino acid residues (lysine and arginine), structural bending,41 and intercalations by tryptophan indole ring.29
 |
| Fig. 5 Length of elongated λ DNA (16.3 μm = 0.337 nm × 48 502 bp) molecules. Single-tethered DNA polymers were stretched within a microfluidic flow chamber. Each data point represents more than 150 molecules and error bars shows standard deviations for measured lengths. The stretched lengths are as follows: 21.8 ± 0.7 μm for YOYO-1, 14.6 ± 0.8 μm for 2(KW)2, 14.3 ± 0.6 μm for 2(SPRK)2, 14.0 ± 0.7 μm for 2K6, 13.8 ± 0.6 μm for (KW)5, and 13.4 ± 0.8 μm for 2HMG (see ESI Fig. S2† for histograms). | |
In order to understand how much FP–DBPs caused structural deformations, we determined the difference in stretching lengths between intrinsic DNA and FP–DBP-stained DNA under the same conditions. Unfortunately, most other studies for tethered DNA molecules so far only used YOYO-1-stained DNA molecules, which caused a considerable increase in the contour length of DNA due to the widened base-to-base distance induced by dye intercalation.39,42 Another critical issue is that it is controversial to define the full contour length for fully saturated YOYO-1-stained DNA. For example, Murade et al. reported 70% increase from B-form DNA (27.7 μm for λ DNA),43 and Gunther et al. reported 50% increase (24.5 μm for λ DNA).44 Our measurement for YOYO-1 stained λ DNA was 21.8 ± 0.72 μm, similar to previous reports.23,45 However, based on these two different full contour lengths, 21.8 μm can vary from 79 to 89% stretches.
Alternatively, we attempted to interpret our observation of DNA stretching by considering dragging force applied to DNA molecule. For intrinsic DNA without labelling, Bustamante et al. confirmed the following equation using optical trapping experiments.40
|
 | (6) |
where
p is the persistence length (53 nm),
X is the stretch, and
L is the contour length. According to
eqn (6), our measurement from 82% to 89% stretch (
X/
L) corresponds to 0.63 pN to 1.74 pN.
Hence, the next question was how much force actually was acting on DNA in parabolic shear flow (vmax = 7 mm s−1) in the flow chamber (100 μm high and 3 mm wide). For conceptual understanding of dragging force, we used stem and flower model proposed by Brochard-Wyart.46 Her theory described tethered DNA polymer as “stem and flower” regime, where “stem” is the completely stretched region of DNA and “flower” is the region where flow forces are actually applied. Therefore, forces onto stem are negligible and stretching is only related with the size of the flower, which can be considered as a blob. If DNA segment size in the blob were assumed as 3 μm long to make 0.24 μm radius (r),47 the stretch would be 13.8 μm (= 16.3 − 3 + 2 × 0.24), corresponding to one of our observations. A parabolic shear flow velocity in a flow chamber is given by v = vmax(1 − y2/h2), where vmax = 7 mm s−1 and h is a half of channel height (50 μm). Since whole λ DNA molecules were always in the microscopic focus, we assumed that both ends of λ DNA should be within 0.5 μm focal depth for 63× oil immersion objective. Therefore, the maximum dragging force (F) on the blob would be 0.63 pN from Stokes' law (F = 6πηrv) where η = 1 cP, and v = 0.14 mm s−1 from y = 50 − 0.5 = 49.5 μm. This force predicts 82% stretch from eqn (6). More specifically, DNA segment sizes were assumed to be 2.1–3.4 μm long to explain our observations (X) of 13.4–14.6 μm. The force ranged from 0.51–0.68 pN, which predicted 80–83% stretches from eqn (6). To be more accurate, we performed finite element analysis to calculate the force by solving the numerical model for 16.3 μm long and 2 nm diameter DNA chain using the “fluid–structure interaction (FSI)” module (see method for details).24,25,48 This numerical calculation provided 0.79 pN that suggested 84% stretch according to eqn (6). This calculated prediction also agreed with a previous study reported by Doyle et al., in which tethered DNA stretched only 75% when Weissenberg number (Wi) = 80, and 83% even under high Wi = 380.42 From our experimental condition, Wi (=
τ) was 125 from τ = 0.45 s for tethered λ DNA49 and
= Δv/Δy where Δv = 0.14 mm s−1 and Δy = 0.5 m.
All measurements for DNA stretching agreed reasonably with theoretical prediction of 84% within error ranges. Nonetheless, a possible explanation for the longest stretching by 2(KW)2 of 89% could be attributed to the fact that partial intercalation of multiple tryptophan residues might increase the contour length a little bit.50 Accordingly, FP–DBPs seemed to affect DNA structures, but their effects were not significant. More importantly, 2HMG, the best FP–DBP in this study, showed DNA stretching of 82 ± 5% that agreed very well with the maximum theoretical prediction of 84%.
Conclusions
In this study, we developed and analysed the characteristics of a series of novel FP–DBPs using various DNA binding peptide motifs, such as different repeating number of lysine and tryptophan (KW), repeated lysine (K6), high mobility group (HMG: TPKRPRGRPKK) from chromosomal protein, and SPRK from histone protein. Compared with YOYO-1 intercalating dyes, these FP–DBPs showed notable features. First, the binding affinities to DNA were in micromolar ranges. The lowest Kd value was 0.59 μM for 2HMG. Second, brightness of FP–DBPs was comparable to YOYO-1. Third, FP–DBP-bound DNA molecules showed little disturbance in DNA structure, which is superior to YOYO-1 because its intercalation increases the contour length by 50–70%. Since FB–DBPs are versatile fluorescent molecules for visualizing DNA molecules in vivo and in vitro applications, the development and characterization for novel FP–DBP would provide fundamental information for prospective genome analysis applications.
Acknowledgements
This work was supported by the National Research Foundation of Korea (NRF) grant funded by the Ministry of Education, Science and Technology (MEST) [2014R1A2A2A04003870].
Notes and references
- Y. Erlich, Genome Res., 2015, 25, 1411–1416 CrossRef CAS PubMed.
- J. Shendure and E. L. Aiden, Nat. Biotech., 2012, 30, 1084–1094 CrossRef CAS PubMed.
- J. Lee, Y. Kim, S. Lee and K. Jo, Electrophoresis, 2015, 36, 2057–2071 CrossRef CAS PubMed.
- A. Gupta, M. Place, S. Goldstein, D. Sarkar, S. G. Zhou, K. Potamousis, J. Kim, C. Flanagan, Y. Li, M. A. Newton, N. S. Callander, P. Hematti, E. H. Bresnick, J. Ma, F. Asimakopoulos and D. C. Schwartz, Proc. Natl. Acad. Sci. U. S. A., 2015, 112, 7689–7694 CrossRef CAS PubMed.
- S. Zhou, S. Goldstein, M. Place, M. Bechner, D. Patino, K. Potamousis, P. Ravindran, L. Pape, G. Rincon, J. Hernandez-Ortiz, J. F. Medrano and D. C. Schwartz, BMC Genomics, 2015, 16, 644 CrossRef PubMed.
- J. Lee, H. S. Park, S. Lim and K. Jo, Chem. Commun., 2013, 49, 4740–4742 RSC.
- S. Zirkin, S. Fishman, H. Sharim, Y. Michaeli, J. Don and Y. Ebenstein, J. Am. Chem. Soc., 2014, 136, 7771–7776 CrossRef CAS PubMed.
- J. Lee, Y. Kim, S. Lim and K. Jo, Analyst, 2016, 141, 847–852 RSC.
- T. Yeom, J. Lee, S. Lee, S. Kang, K. R. Kim, B. Han, H. S. Lee and K. Jo, Analyst, 2014, 139, 2432–2439 RSC.
- D. Duzdevich, M. D. Warner, S. Ticau, N. A. Ivica, S. P. Bell and E. C. Greene, Mol. Cell, 2015, 58, 483–494 CrossRef CAS PubMed.
- J. Y. Lee, I. J. Finkelstein, L. K. Arciszewska, D. J. Sherratt and E. C. Greene, Mol. Cell, 2014, 54, 832–843 CrossRef CAS PubMed.
- T. Matsuoka, B. C. Kim, J. Huang, N. J. Douville, M. D. Thouless and S. Takayama, Nano Lett., 2012, 12, 6480–6484 CrossRef CAS PubMed.
- G. Nifker, M. Levy-Sakin, Y. Berkov-Zrihen, T. Shahal, T. Gabrieli, M. Fridman and Y. Ebenstein, ChemBioChem, 2015, 16, 1857–1860 CrossRef CAS PubMed.
- M. Levy-Sakin, A. Grunwald, S. Kim, N. R. Gassman, A. Gottfried, J. Antelman, Y. Kim, S. O. Ho, R. Samuel, X. Michalet, R. R. Lin, T. Dertinger, A. S. Kim, S. Chung, R. A. Colyer, E. Weinhold, S. Weiss and Y. Ebenstein, ACS Nano, 2014, 8, 14–26 CrossRef CAS PubMed.
- H. S. Rye, S. Yue, D. E. Wemmer, M. A. Quesada, R. P. Haugland, R. A. Mathies and A. N. Glazer, Nucleic Acids Res., 1992, 20, 2803–2812 CrossRef CAS PubMed.
- A. S. Biebricher, I. Heller, R. F. Roijmans, T. P. Hoekstra, E. J. Peterman and G. J. Wuite, Nat. Commun., 2015, 6, 7304 CrossRef CAS PubMed.
- S. Lee, Y. Oh, J. Lee, S. Choe, S. Lim, H. S. Lee, K. Jo and D. C. Schwartz, Nucleic Acids Res., 2016, 44, e6 CrossRef PubMed.
- R. Reeves and M. S. Nissen, J. Biol. Chem., 1990, 265, 8573–8582 CAS.
- E. Fonfria-Subiros, F. Acosta-Reyes, N. Saperas, J. Pous, J. A. Subirana and J. L. Campos, PLoS One, 2012, 7, e37120 CAS.
- M. E. Churchill and M. Suzuki, EMBO J., 1989, 8, 4189–4195 CAS.
- M. Suzuki, EMBO J., 1989, 8, 797–804 CAS.
- E. T. Dimalanta, A. Lim, R. Runnheim, C. Lamers, C. Churas, D. K. Forrest, J. J. de Pablo, M. D. Graham, S. N. Coppersmith, S. Goldstein and D. C. Schwartz, Anal. Chem., 2004, 76, 5293–5301 CrossRef CAS PubMed.
- Y. Kim and K. Jo, Chem. Commun., 2011, 47, 6248–6250 RSC.
- L. H. Yeh, M. Zhang, S. W. Joo and S. Qian, Electrophoresis, 2012, 33, 3458–3465 CrossRef CAS PubMed.
- F. B. Tian, H. Dai, H. Luo, J. F. Doyle and B. Rousseau, J. Comput. Phys., 2014, 258, 451–469 CrossRef CAS PubMed.
- M. A. Smialek, N. C. Jones, S. V. Hoffmann and N. J. Mason, Phys. Rev. E: Stat., Nonlinear, Soft Matter Phys., 2013, 87, 060701 CrossRef PubMed.
- K. S. Bloom, Chromosoma, 2008, 117, 103–110 CrossRef PubMed.
- H. Teng, Multi-scale multi-level homogenization for simulation of DNA molecules, ProQuest, 2008 Search PubMed.
- J. J. Toulme, M. Charlier and C. Helene, Proc. Natl. Acad. Sci. U. S. A., 1974, 71, 3185–3188 CrossRef CAS.
- E. T. Dimalanta, A. Lim, R. Runnheim, C. Lamers, C. Churas, D. K. Forrest, J. J. de Pablo, M. D. Graham, S. N. Coppersmith and S. Goldstein, Anal. Chem., 2004, 76, 5293–5301 CrossRef CAS PubMed.
- C.-H. Yang, K.-C. G. Jeng, W.-H. Yang, Y.-L. Chen, C.-C. Hung, J.-W. Lin, S.-T. Chen, S. Richardson, C. R. H. Martin, M. J. Waring and L. Sheh, ChemBioChem, 2006, 7, 1187–1196 CrossRef CAS PubMed.
- R. Hein and R. Y. Tsien, Curr. Biol., 1996, 6, 178–182 CrossRef.
- S. Gurrieri, K. S. Wells, I. D. Johnson and C. Bustamante, Anal. Biochem., 1997, 249, 44–53 CrossRef CAS PubMed.
- N. C. Shaner, R. E. Campbell, P. A. Steinbach, B. N. G. Giepmans, A. E. Palmer and R. Y. Tsien, Nat. Biotechnol., 2004, 22, 1567–1572 CrossRef CAS PubMed.
- G. T. Hirons, J. J. Fawcett and H. A. Crissman, Cytometry, 1994, 15, 129–140 CrossRef CAS PubMed.
- A. N. Glazer and H. S. Rye, Nature, 1992, 359, 859–861 CrossRef CAS PubMed.
- D. P. Mascotti and T. M. Lohman, Biochemistry, 1993, 32, 10568–10579 CrossRef CAS PubMed.
- R. Reeves and M. S. Nissen, J. Biol. Chem., 1990, 265, 8573–8582 CAS.
- T. T. Perkins, D. E. Smith, R. G. Larson and S. Chu, Science, 1995, 268, 83–87 CAS.
- C. Bustamante, J. Marko, E. Siggia and S. Smith, Science, 1994, 265, 1599–1600 CAS.
- J. L. Dimicoli and C. Helene, Biochemistry, 1974, 13, 714–723 CrossRef CAS PubMed.
- P. S. Doyle, B. Ladoux and J. L. Viovy, Phys. Rev. Lett., 2000, 84, 4769–4772 CrossRef CAS PubMed.
- C. U. Murade, V. Subramaniam, C. Otto and M. L. Bennink, Nucleic Acids Res., 2010, 38, 3423–3431 CrossRef CAS PubMed.
- K. Gunther, M. Mertig and R. Seidel, Nucleic Acids Res., 2010, 38, 6526–6532 CrossRef PubMed.
- T. T. Perkins, S. R. Quake, D. E. Smith and S. Chu, Science, 1994, 264, 822–826 CAS.
- F. Brochard-Wyart, Europhys. Lett., 1995, 30, 387–392 CrossRef CAS.
- D. E. Smith, T. T. Perkins and S. Chu, Macromolecules, 1996, 29, 1372–1373 CrossRef CAS.
- B. Lu, D. P. Hoogerheide, Q. Zhao and D. Yu, Phys. Rev. E: Stat., Nonlinear, Soft Matter Phys., 2012, 86, 011921 CrossRef PubMed.
- B. Ladoux and P. S. Doyle, Europhys. Lett., 2000, 52, 511–517 CrossRef CAS.
- G. Desoye and D. Porschke, Biophys. Chem., 1993, 46, 283–294 CrossRef CAS PubMed.
Footnote |
† Electronic supplementary information (ESI) available. See DOI: 10.1039/c6ra08683g |
|
This journal is © The Royal Society of Chemistry 2016 |
Click here to see how this site uses Cookies. View our privacy policy here.