Experimental and theoretical approach to account for green luminescence from Gd2Zr2O7 pyrochlore: exploring the site occupancy and origin of host-dopant energy transfer in Gd2Zr2O7:Eu3+

Santosh K. Gupta*a, P. S. Ghoshb, C. Reghukumarc, N. Pathaka and R. M. Kadama
aRadiochemistry Division, Bhabha Atomic Research Centre, Trombay, Mumbai-400085, India. E-mail: santufrnd@gmail.com; santoshg@barc.gov.in; Fax: +91-22-25505151; Tel: +91-22-25590636
bMaterials Science Division, Bhabha Atomic Research Centre, Trombay, Mumbai-400085, India
cInstitute of Science Education and Research Centre, Santiniketan, West Bengal-731235, India

Received 26th February 2016 , Accepted 15th April 2016

First published on 18th April 2016


Abstract

Pure and Eu3+-doped Gd2Zr2O7 pyrochlore was synthesized using a gel combustion method using citric acid as a fuel. Samples of Gd2Zr2O7 pyrochlore were characterized systematically using X-ray diffraction (XRD), Fourier transform infrared spectroscopy (FTIR), scanning electron microscopy (SEM), energy-dispersive spectroscopy (EDS) and time-resolved photoluminescence spectroscopy (TRPLS). On irradiating the undoped Gd2Zr2O7 pyrochlore with Ultraviolet (UV) light, an intense green emission was observed. Photoluminescence lifetime measurements and X-ray photoelectron spectroscopy (XPS) showed the presence of oxygen vacancies in the pyrochlore sample, which were responsible for the intense green emission in Gd2Zr2O7. Calculations based on density functional theory (DFT+U) of the electronic density of states in the presence of charged oxygen defects qualitatively explained the origin of the green emission in undoped Gd2Zr2O7. The emission spectrum of Eu3+ revealed that it was distributed at both Gd3+ and Zr4+ sites in Gd2Zr2O7, which was also confirmed using lifetime measurements. DFT-based calculations of cohesive energy also showed that doping with Eu is almost equally favorable at Gd and Zr sites. Based on DFT calculations, it is proposed that the distribution of f and d states of Eu3+ atoms matches well with the total density of states (DOS) of ordered Gd2Zr2O7 (o-Gd2Zr2O7), which signifies efficient transfer of photon energy from the host to the Eu3+ dopant. The actual site symmetry of europium ions in gadolinium zirconate was also determined based on the Stark splitting pattern and was found to be D2d, although it is Oh for Gd3+ in Gd2Zr2O7. Calculations of the Judd–Ofelt parameters revealed that Ω2 > Ω4, which indicates high covalency and low symmetry around Eu3+, which is in agreement with the results of emission spectroscopy. The high intensity of the red emission corresponding to the 5D07F2 transition and good fluorescence yields (51%) highlight the unexplored potential of Gd2Zr2O7:Eu3+ as a promising red phosphor.

1. Introduction

Among current materials of interest, A2B2O7 pyrochlores have advantages over others owing to their potential applications in the chemisorption of CO2,1 magnetism,2 electro/photocatalysis,3 as a topological Mott insulator,4 in nuclear waste storage,5 as a photoluminescence host material,6 etc. Pyrochlore oxides, which exist in various crystalline phases, exhibit interesting physicochemical properties, which make them potential hosts for chemical substitution.

As far as other scientific and technological applications are concerned, rare-earth-based zirconate (Re2Zr2O7) pyrochlores have been found to be potential candidates for TBCs (thermal barrier coatings) and high-temperature heating devices, as well as for luminescence host and high-temperature sensor probes.7 It is reported that two kinds of different crystal structure exist for Re2Zr2O7: the pyrochlore structure and the fluorite structure.8

Luminescent materials based on inorganic hosts are preferred sources of illumination because of various advantages they possess such as color tunability, low power consumption environment-friendliness, etc.9 In our laboratory, based on the various kinds of luminescence application, different inorganic hosts have been studied such as spinels,10 hexagonal perovskite,11 orthorhombic perovskite/double perovskite,12 molybdate/tungstate,13 silicate/phosphate,14 etc. Recently, pyrochlore oxides have been given a lot of attention as new luminescence hosts because of their physical and chemical stability, as well as their resistance to oxidizing environments.9

Among these, gadolinium zirconate (Gd2Zr2O7) stands out as a material with distinctively low thermal conductivity and high phase stability.15 It has also been reported that Gd2Zr2O7 may be an excellent candidate for potential photoactive materials.16

Rare-earth ions have been extensively employed as activators for various phosphors and other organic and inorganic luminescent materials because they offer high color purity, long luminescence lifetime, emit the entire range of colors (depending on their energy levels) and exhibit a narrow emission profile, because the optically active 4f electrons are strongly shielded from the rest of the ion by the 5s and 5p shells.

Among the entire lanthanide series, the Eu3+ ion is preferred as a dopant ion for structural probes, as well as for the synthesis of phosphors that emit intense red light. In the case of Eu3+ ions, luminescence mostly arises from the 5D0 state, which is a single level, and this prevents the convolution of overlapping emission peaks from different levels; as a result, it is the most useful spectroscopic probe.17 An example of a hypersensitive transition is the 5D07F2 transition of Eu3+ ions. In the last decade or so, our groups, as well as other scientific researchers, have worked extensively on the investigation of the europium ion as a structural probe because of its symmetry-sensitive emission.18–24

Pyrochlores (A2B2O7) can exist in both the ideal pyrochlore and the defect fluorite structure depending upon the difference in size between the A and B ions. The ideal pyrochlore structure is composed of two types of cation polyhedra: AO8, which are oriented in the form of scalenohedra (distorted cubes) consisting of equally spaced anions (O atoms) at a slightly shorter distance from the central cations. On the other hand, BO6 polyhedra are oriented within trigonal antiprisms, in which all six anions are at equal distances from the central cations.25 Among all inorganic structures, pyrochlore oxides are the most uneven structures that possess excellent crystal chemical flexibility.

Gd2Zr2O7, which contains eight-coordinate Gd3+ ions and six-coordinate Zr4+ ions, belongs to the class of ordered pyrochlore structures owing to the optimum difference in size between (A) Gd3+ and (B) Zr4+. But it is reported to be a borderline compound that exhibits both pyrochlore and defect fluorite structures.26 Substitution with a dopant ion (lanthanide, actinide or transition metal) at both Gd3+ and Zr4+ sites can lead to changes in the local structure (symmetry, local chemical composition, etc.) due to mismatches in ionic size and ionic radii. Thus, doping creates various kinds of charge-compensating defects such as cation and anion/oxygen vacancies, which can alter the band gap of the material (and thereby its photophysical characteristics). In particular, these materials can accommodate lanthanide ions at either Gd3+ sites or Zr4+ sites or these can be distributed over both Gd3+ sites and Zr4+ sites. Therefore, doping with an aliovalent ion in such oxides can not only enable their use as structural probes but such substitution can also induce significant changes in their photophysical behavior.

Moreover, the incorporation of suitable dopant ions in materials with wide band gaps such as Gd2Zr2O7 can create new optical phenomena and is known to be one of the main strategies for developing materials with improved optoelectronic properties. In fact, Ca2+-doped Gd2Zr2O7 was recently found to be an excellent ionic conductor owing to the creation of a large defect density of oxygen vacancies.27

It was also observed that Yb3+-doped Gd2Zr2O7 exhibited improved performance as a thermal barrier.28 However, the role of the rare earth (RE) in Gd2Zr2O7 is not clear and is still being discussed. Doping has proven to be an efficient means for tuning the electrical,29 optical,30 thermal,31 etc. properties of Gd2Zr2O7-type oxide-based pyrochlore structures.

We chose the europium ion as a dopant for obvious reasons, as explained earlier. The study of the local structures around europium ions doped in a Gd2Zr2O7-type host and understanding their implications for the optical properties and defect chemistry of the Eu:Gd2Zr2O7 system, however, has never been undertaken in scientific research. Solving these problems only via experimental study is particularly challenging because of the low concentration of dopant ions and the localized nature of the structural distortions induced by the mismatches in size and charge between the lanthanide ions and the Gd3+ and Zr4+ host ions. Localized displacements of atoms induced by a low dopant concentration are, however, accessible via theoretical simulations.32

Time-resolved photoluminescence spectroscopy (TRPLS) is a non-destructive as well as sensitive technique for studying the local environment and oxidation states of various fluorescent ions due to its triple resolution, namely excitation, emission and PL lifetime resolution. In view of this, TRPLS investigations of ions incorporated in the gadolinium zirconate pyrochlore can yield interesting results in understanding the speciation of the metal ions, which in turn can predict the behavior of lanthanide ions in the pyrochlore matrix.

As far as photophysical studies of europium-doped Gd2Zr2O7 are concerned, very few reports exist in the literature.16,30,33,34 However, none of these tried to study the changes in the local structure around the dopant europium ions in the Gd2Zr2O7 matrix or to evaluate the photophysical properties (such as the radiative and non-radiative lifetimes, branching ratio, quantum efficiency, Judd–Ofelt parameters, etc.). Moreover, the calculation of the Judd–Ofelt parameters is important as it gives an indication of the local covalency and symmetry around the dopant Eu3+ ions.

This study is the first report on the detailed photoluminescence (PL) properties of pure Gd2Zr2O7 using experimental techniques and calculations based on density functional theory (DFT). In this work, the synthesis of Gd2Zr2O7 was performed using a gel combustion technique assisted by citric acid. Characterization of the phase purity, functional groups, morphology and composition of this material was carried out using X-ray diffraction (XRD), Fourier transform infrared (FTIR) spectroscopy, scanning electron microscopy (SEM) and energy-dispersive X-ray spectroscopy (EDS), respectively. The spectroscopic aspects of the PL properties were also investigated in an undoped sample to assess its applicability as a rare-earth-free phosphor material. The photophysical properties of europium ions, as well as their local site occupancy, were also investigated for applications as a red-emitting luminescent material. In addition, first-principles calculations based on DFT were performed to study the structural stabilities of pure Gd2Zr2O7 and Eu3+-doped Gd2Zr2O7 in which Eu3+ ions were doped selectively at Gd and Zr positions. The electronic density of states (DOS) was calculated to explain the feasibility of energy transfer from the host to the dopant ion. Moreover, the DOS of Gd2Zr2O7 was calculated in the presence of oxygen vacancies (neutral and charged) to propose a suitable mechanism that can qualitatively explain the origin of green emissions in pure Gd2Zr2O7.

2. Experimental

2.1. Synthesis: gel combustion method

Gd2Zr2O7 was prepared by the method of sol–gel combustion. Gadolinium oxide [Gd2O3], zirconyl nitrate [ZrO(NO3)2·H2O] and citric acid [C6H8O7·H2O] were used as the precursor materials. Stoichiometric compositions of the metal oxide, metal nitrate and fuel were calculated based upon propellant chemistry. Firstly, all three precursor components were dissolved in quartz double-distilled (QDD) water separately. Then, they were mixed together in a glass beaker with a capacity of 100 mL. The resulting solution was kept over a magnetic stirrer at 80 °C for 6–7 h to obtain a homogeneous solution. With continuous stirring, the mixed solution yielded an opal gel. This gel was dried under an infrared (IR) lamp, which led to dehydration and resulted in the formation of a highly condensed porous network. Then, the beaker was transferred into a furnace and heated to 400 °C for 2–3 h. This resulted in the formation of fluffy black masses. These were crushed to a fine powder with a mortar and pestle and placed in alumina crucibles to be heat-treated at 800 °C for 6 h. The resulting pure white powder was used for further characterization. For the synthesis of a Eu-doped sample, appropriate quantities of europium oxide (in nitrate form) were used at the initial stage.

2.2. Instrumentation

X-ray diffraction (XRD) patterns of powdered undoped and europium-doped Gd2Zr2O7 samples were recorded using a Rigaku Miniflex 600 diffractometer operating in the Bragg–Brentano focusing geometry. A Cu Kα radiation source (λ = 1.5406 Å) was used as the X-ray source. The operating voltage and current of the instrument were kept at 40 kV and 30 mA, respectively. The XRD patterns were obtained at a scan rate of 1° per minute. Fourier transform infrared (FTIR) spectra of films were recorded using a Bruker spectrometer (Vertex 80 V) in reflectance mode at a resolution of 4 cm−1. PL data were recorded on an Edinburgh CD-920 unit equipped with M300 monochromators. Data acquisition and analysis were carried out by F-900 software provided by Edinburgh Analytical Instruments (UK). A xenon flash lamp with a frequency range of 10–100 Hz was used as the excitation source. The emission spectra of a particular sample were recorded at a lamp frequency of 100 Hz. Multiple scans (at least five) were carried out to minimize fluctuations in peak intensity and maximize the S/N ratio. Fluorescence lifetime measurements were based on the well-established time-correlated single-photon counting (TCSPC) technique.

The lifetime in the case of the undoped sample was recorded using a PDL 800B pulsed diode laser because of limitations of the xenon flash lamp in going below 8 μs (pulse width 6–7 μs).

2.3. Computation methodology

All the electronic structure calculations were performed using spin-polarized plane-wave-based density functional theory (DFT) as implemented in the Vienna ab initio simulation package (VASP).35,36 The interactions between electrons and ions were described using the projector augmented wave (PAW) method,37 including the valence states of Gd (5s, 5p, 4f, 5d, 6s: 18 valence electrons), Zr (4s, 4p, 5s, 4d: 12 valence electrons), Eu (5p, 6s, 5d: 9 valence electrons) and O (2s, 2p: 6 valence electrons). The generalized gradient approximation (GGA) was used for the exchange–correlation potential in the Perdew–Burke–Ernzerhof (PBE) form.38 The Hubbard U correction was introduced using the method proposed by Dudarev et al.,39 in which the U parameter (which reflects the strength of on-site Coulomb interactions) and the J parameter (which adjusts the strength of exchange interactions) are combined into a single parameter Ueff = UJ to allow for the Coulomb repulsions between localized f-electrons. The value that we employed was Ueff(Gd) = 6.9 eV, as proposed by Losovyj et al.40 A Monkhorst–Pack41 k-space sample of 7 × 7 × 7 in reciprocal space for the Brillouin zone integration and a cutoff energy (Ecut) of 600 eV for the plane wave basis set were used. For a cubic unit cell of the ideal pyrochlore Gd2Zr2O7 (GZO), optimization was carried out with respect to Ecut and the k-point mesh to ensure convergence of the total energy to within a precision of 0.1 meV per atom. We considered the unit cell of the ideal pyrochlore (Fd[3 with combining macron]m), which contained 88 atoms in the pure system, and a Eu-doped system was prepared by replacing one Gd and one Zr atom (out of 16 Gd and Zr atoms) separately by a Eu ion to study the effects of site-selective doping. The total energy of GZO was optimized with respect to its volume (or lattice parameters) and atomic positions. Conjugate gradient algorithms were used for relaxation of the unit cells until the residual forces and stresses in the equilibrium geometry were of the order of 0.005 eV Å−1 and 0.01 GPa, respectively. The final calculations of the total electronic energy and density of states (DOS) were performed using the tetrahedron method with Blöchl corrections.42

3. Results and discussion

3.1. Phase purity: powder X-ray diffraction

Fig. 1 shows the XRD patterns of undoped and Eu-doped Gd2Zr2O7. There are five main diffraction peaks due to (111), (200), (220), (311) and (222) planes. These are in agreement with the reflections of the defect fluorite structure. The product doped with europium exhibits a similar pattern compared with that of the undoped Gd2Zr2O7 sample. This indicates that the doping of Eu into Gd2Zr2O7 does not change the crystal structure or has not distorted the crystal lattice. From Fig. 1, no other impurity phases such as Gd2O3 or Eu2O3 are detected, which also indicates that Eu has been properly doped at the lattice position of Gd3+.
image file: c6ra05113h-f1.tif
Fig. 1 X-ray diffraction patterns of pure and Eu3+-doped Gd2Zr2O7.

3.2. Structural characterization

The Fourier transform infrared (FTIR) spectrum of as-prepared Gd2Zr2O7 is displayed in Fig. 2. In the FTIR spectrum there is a strong absorption band observed at approximately 1540 cm−1, which is believed to be due to the asymmetric stretching vibration of COO, typically found in the salts of carboxylic acids such as citric acid, which corresponds to the coordination of a carboxylate ion to a Gd ion.43 The broad band around 1400 cm−1 could be a result of overlapping symmetric stretching vibrations of COO, as well as O–H deformation vibrations.44 The corresponding O–H stretching vibration is observed in the region of ∼3500–3300 cm−1. The broad peak at about 620 cm−1 is attributed to the stretching vibration of the M–O bond (M = Gd or Zr), which demonstrates that a strong chemical interaction exists between the metal and the oxygen ions, which is responsible for molecular-level dispersion in combustion synthesis.43 The characteristic absorption bands at 3410 and 1449 cm−1 that can be seen in Fig. 2 are ascribed to the Gd–O vibration, and the bands at 1564 and 1071 cm−1 are attributed to the absorption of ZrO2.
image file: c6ra05113h-f2.tif
Fig. 2 FTIR spectrum of Gd2Zr2O7.

3.3. Morphology and compositional characterization: SEM and EDS

Fig. 3a shows an SEM micrograph of Gd2Zr2O7 pyrochlore synthesized using the gel combustion method, which involved the grinding of a voluminous carbonaceous mass. The average sizes of the particles as depicted in the micrograph are in the range of 2–3 microns. Morphological analysis reveals large flat facets with plate-like morphology, which may vary depending upon the time and extent of grinding. This is typical of inorganic materials made by citric acid-assisted combustion synthesis because of the large volume of gas evolved in the combustion reaction, such as CO2, CO, NOx, etc. The non-uniformity in the thickness of the plates is due to an inhomogeneous distribution of temperature and mass flow in the combustion flame.
image file: c6ra05113h-f3.tif
Fig. 3 (a) SEM micrograph and (b) EDS spectrum of Gd2Zr2O7. The inset of (b) shows the elemental composition of Gd2Zr2O7 determined using EDS.

EDS was performed to further confirm the composition of the obtained compound. EDS analysis of gadolinium zirconate nanocrystals (Fig. 3b) indicates that Gd2Zr2O7 are composed of gadolinium, zirconium and oxygen with a molar ratio of Gd/Zr/O of ≈2[thin space (1/6-em)]:[thin space (1/6-em)]2[thin space (1/6-em)]:[thin space (1/6-em)]7, which gives an approximate stoichiometric formula of Gd2Zr2O7. The peak due to C in the spectrum is attributed to the latex in the SEM sample holder.

3.4. PL measurements on undoped and europium-doped Gd2Zr2O7

3.4.1. PL properties of undoped Gd2Zr2O7. Fig. 4a shows the emission spectrum of the undoped Gd2Zr2O7 pyrochlore sample (as prepared) at an excitation wavelength of 375 nm. The emission spectrum displays a broad spectral feature that peaks at around 530 nm in the green region of the electromagnetic spectrum. CIE color coordinates are very important parameters for qualifying materials for applications as phosphors. The CIE chromaticity diagram for the Gd2Zr2O7 pyrochlore sample is shown in Fig. 4b. The values of the CIE coordinates obtained for the undoped Gd2Zr2O7 pyrochlore were found to be 0.31 and 0.42, which shows it to be a strong green emitter. Such a strong green emission in a rare earth is a significant development in the field of phosphor research because it is very difficult to find a suitable green phosphor, as a wide band gap is required, and in the green spectral region the sensitivity of the naked eye is quite low. Such an intense emission in a material without any activator ions can be attributed to the presence of a defect or defect cluster. Based on the preparation methodology, thermal treatment, pH conditions, etc., materials are thought to contain different kinds of structural defects such as cation vacancy, cation antisite, oxygen vacancy, oxygen antisite, cation interstitial, and oxygen interstitial. Furthermore, oxygen vacancies can be categorised into three different types: neutral (F-centre), singly ionized (F+ centre) and doubly ionized (F2+ centre), depending upon the number of electrons they have trapped (0, 1 or 2).
image file: c6ra05113h-f4.tif
Fig. 4 (a) Emission spectrum, (b) CIE chromaticity diagram and (c) figurative model of probable mechanisms responsible for the observed emission of Gd2Zr2O7.

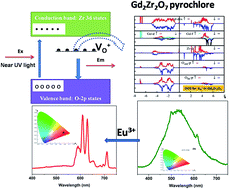
We expect that such an intense green emission may arise in undoped Gd2Zr2O7 from the transition of an electron that is excited during photon irradiation near to the conduction band (CB) to a singly ionized oxygen vacancy centre (VO+). This is a similar kind of phenomenon to that we observed in undoped LaPO4, where we proposed that the emission arises from a recombination process in which an excited electron from the conduction band (CB) loses its energy and reoccupies the energy level of an electron hole in the valence band (VB) through the localized defect levels.14 A schematic diagram of defect-induced emission is shown in Fig. 4c.

To exactly identify the species responsible for the green emission in the Gd2Zr2O7 sample, a luminescence decay profile corresponding to the green emission from the sample was recorded and is shown in Fig. 5. The PL decay curve was fitted using a bi-exponential model using eqn (1):

 
image file: c6ra05113h-t1.tif(1)
where I(t) is the intensity, τ1 and τ2 are the emission decay times, and A1 and A2 are their relative weightings. The decay curve shows two different lifetime values of 0.42 and 1.84 ns with magnitudes of 51% and 49%, respectively, with an average value of 1.12 ns. The bi-exponential decay is an indication of the presence of multiple defect centres in the Gd2Zr2O7 pyrochlore sample. The lifetime value of the order of 1–2 ns is typical of oxygen vacancy-related defects.45


image file: c6ra05113h-f5.tif
Fig. 5 PL decay profile of Gd2Zr2O7 under excitation by a pulsed diode laser at 375 nm and emission at 530 nm. The line at t = 0 represents an instrumental response function (IRF).

To support the analogy that the intense green emission in gadolinium zirconate is in fact due to an oxygen vacancy or a related defect, we carried out X-ray photoelectron spectroscopy on a Gd2Zr2O7 sample. Fig. 6 shows the O 1s core-level peak of the XPS spectrum for the Gd2Zr2O7 sample. The O 1s core-level peak displays a slightly asymmetric peak at ∼532 eV and is fitted with three symmetric Gaussian curves, which represent the Oa, Ob and Oc peaks. The peak at low binding energy Oa is associated with lattice oxygen atoms localized at regular positions.46 The intense Ob peak at 532 eV is attributed to oxygen-related defects such as oxygen vacancies (VO) and oxygen interstitials (Oi).47 The peak at higher binding energy (Oc) may arise due to chemisorbed oxygen.47


image file: c6ra05113h-f6.tif
Fig. 6 XPS core-level spectrum of oxygen 1s in Gd2Zr2O7.
3.4.2. Theoretical model of the origin of photoluminescence in undoped Gd2Zr2O7: density functional theory (DFT) calculations. In the pyrochlore-based oxide Gd2Zr2O7, the Gd and Zr atoms occupy the (16d) 1/2,1/2,1/2 and (16c) 0,0,0 sites, respectively, with cations alternating in the FCC sublattice in rows along the 〈110〉 direction. The anion sublattice consists of three different oxygen sites, two of which are occupied, (8b) 3/8,3/8,3/8 and (48f) x,1/8,1/8, and the third site, (8a) 1/8,1/8,1/8, is vacant. The equilibrium lattice parameters, atomic positions and bond lengths are summarized in Table 1 along with their experimentally determined values (by Rietveld refinement). Table 1 clearly shows that our values calculated via GGA+U agree well with previous experimentally determined values48,49 within a deviation of less than 1.5%.
Table 1 Equilibrium lattice parameters, atomic positions, bond lengths and band gaps calculated via GGA+U along with previous experimental measurements
  a0 (Å) x Gd–O8b (Å) Gd–O48f (Å) Zr–O48f (Å) Band gap (eV)
Theory 10.67252 0.339 2.31 2.55 2.11 2.86
Experiment 10.527(6),48 10.54 (ref. 49) 0.334 (ref. 49) 2.483 (ref. 49) 2.11 (ref. 49)


Our PL decay curve and XPS study clearly show the presence of oxygen defect-related states in the samples and their effect on the PL properties. Therefore, we calculated the electronic density of states (DOS) of ideal Gd2Zr2O7 and the change in the electronic DOS in the presence of oxygen vacancies (neutral and charged). To generate defect structures, one oxygen atom was removed from the 88-atom ideal unit cell and the total energy of the ideal unit cell of the Gd2Zr2O7 pyrochlore (containing 88 atoms), as well as that of structures containing oxygen vacancies (neutral and charged), were optimized with respect to their volume (or lattice parameters) and atomic positions.

Fig. 7a presents the total and orbital angular momentum-resolved density of states (DOS) for Gd2Zr2O7 in which the Fermi level was set to 0 eV. In Gd2Zr2O7, the valence band (VB) is mainly composed of O 2p orbitals hybridized with Zr 4d orbitals along with a slight contribution from Gd 4f states. The conduction band (CB) is mainly composed of Gd 4d states (in the majority spin component), Gd 4f states (in the minority spin component) and Zr 4d states. Zr 4d states contribute solely to the lower part of the conduction band. Finally, our electronic band-gap calculated via GGA+U of 2.86 eV demonstrates the insulating character of this material.


image file: c6ra05113h-f7.tif
Fig. 7 GGA+U calculated total and angular momentum decomposed DOS of (a) ideal pyrochlore Gd2Zr2O7 (o-GZO) as well as ideal pyrochlore o-GZO with (b) neutral oxygen vacancy (V0O) (c) oxygen vacancy of charge +1 (V1+O) (d) oxygen vacancy of charge +2 (V2+O).

Fig. 7b presents the total and angular momentum-decomposed DOS due to the presence of a neutral O vacancy. The spin-up and spin-down components are shown separately in the upper and lower panels, respectively. The overall nature of the VB remains unaltered, but an impurity band appears 1.8 eV above the VB maximum in the band gap and below the Fermi level. This impurity band is mainly composed of Gd d and f states. In this case, the difference in energy between the VB maximum and the CB minimum (electronic band gap) is now 2.8 eV.

Fig. 7c presents the total and angular momentum-decomposed DOS due to the presence of an O vacancy with a charge of +1 (V1+O). The spin-up and spin-down components are shown separately in the upper and lower panels, respectively. The overall nature of the VB remains unaltered but two impurity bands appear above the VB maximum in the band gap. These impurity bands are composed of d states of Zr in the spin-up and spin-down components. The impurity states that are generated due to the spin-up components are filled with electrons, as they are situated just below the Fermi level, and the impurity states that are generated due to the spin-down components are empty. The impurity bands that appear just below the CB minimum are similarly composed of d states of Zr. The presence of defect states just below the CB minimum reduces the band gap by 0.1 eV. In this case, the difference in energy between the VB maximum and the CB minimum (electronic band gap) is now 2.76 eV.

Fig. 7d presents the total and angular momentum-the decomposed DOS due to the presence of an O vacancy with a charge of +2 (V2+O). The overall nature of the VB remains unaltered but an impurity band appears above the VB maximum in the band gap. The Fermi level is situated just above the VB maximum. Impurity states are present just below the CB minimum. The impurity states are composed of d and f states of Gd and d states of Zr in the spin-up and spin-down components. In this case, the difference in energy between the VB maximum and the CB minimum (electronic band gap) is 2.4 eV, i.e., the reduction in the electronic band gap is greater in this case compared with the other types of oxygen vacancy.

Removing one electron from a neutral VO leads to a V1+O defect. For this defect, the band gap from the VB to the CB is 2.76 eV, but the band gap from the occupied defect state to the bottom of the CB is 2.48 eV. The removal of one more electron from VO+ (the formation of a VO2+ site) results in no defect states in the band gap, but impurity states are generated at the bottom of the CB. These defect states extend deeply into the band gap, which results in a reduction in the band gap by 0.46 eV (see Fig. 7d) compared with that of ideal Gd2Zr2O7. The calculated values of the formation energy of the vacancy indicate that the formation of V1+O and V2+O defects is favoured near the valence band compared with that of neutral oxygen defects, which indicates that oxygen vacancies have a tendency to donate electrons or behave as an n-type defect. Therefore, the electronic transitions between defect states (which arise due to V1+O defects) and the CB, as well as impurity states at the bottom of the CB, can lead to emissions in the green region, as described for the PL emission spectrum.

3.4.3. PL properties of Eu3+-doped Gd2Zr2O7. The excitation spectrum of Eu3+ doped in Gd2Zr2O7 is shown in Fig. 8a. The excitation spectrum was recorded at an emission wavelength of 613 nm, which corresponds to the 5D07F2 transition. The spectrum shows a broad band in the range of 200–290 nm peaking at 230 nm. This particular band is ascribed to the charge-transfer transition from O2+ to Eu3+. Weaker lines in the region of 300–450 nm can also be seen, which are attributed to 4f → 4f interconfigurational transitions of the Eu3+ ions in the Gd2Zr2O7 host. Among these, the most intense line is at 395 nm, which is ascribed to the 7F05L6 transition of europium ions.
image file: c6ra05113h-f8.tif
Fig. 8 (a) Excitation spectrum, (b) emission spectrum and (c) CIE chromaticity diagram of Eu3+-doped Gd2Zr2O7.

Upon excitation at λ = 230 nm (charge-transfer band, CTB), the emission spectrum (Fig. 8b) exclusively consisted of very strong bands corresponding to the 5D07F1 (592 nm), 5D07F2 (613 nm), 5D07F3 (653 nm), and 5D07F4 (704 nm) transitions. As no emission from the host was observed, the transfer of energy from the host group to the Eu3+ ions was efficient.

The orange emission at λ = 592 nm relates to the magnetic-dipole (MD) 5D07F1 transition of Eu3+, which hardly varies with the strength of the crystal field (CF). The red emission at λ ≈ 613 nm is ascribed to the electric-dipole (ED) 5D07F2 transition of Eu3+, which is very sensitive to the local environment around the Eu3+ ion and depends on the symmetry of the crystal field.

That europium in the pyrochlore structure occupying a site of D3d symmetry would result in splitting of the 5D07F1 line (MDT), whereas this remained unsplit for europium in the defect fluorite structure occupying a site of Oh symmetry.16 The fact that the 5D07F1 line was not split and was a single line indicates that the local symmetry of Eu3+ is not D3d (see Section 3.4.5.) and Gd2−xEuxZr2O7 has a defect fluorite structure, which is consistent with our XRD results.

In general, the intensity ratio of ED to MD transitions has been used to measure the symmetry of the local environment of trivalent 4f ions. The greater is the intensity of the ED transition, the greater is the asymmetry. In our present study, the 5D07F2 (ED) transition of Eu3+ ions at 613 nm is much more intense than the 5D07F1 (MD) transition, which indicates that Eu3+ occupies an asymmetric site without inversion symmetry in Gd2Zr2O7.

We know that the coordination numbers of Gd and Zr ions are 8 and 6, respectively. In Gd2Zr2O7, the Gd3+ ions are in an Oh crystal field with inversion symmetry. Because the difference in ionic size between 8-coordinated Gd3+ (105.3 pm) and 8-coordinated Eu3+ (106.6 pm) is very small, Eu3+ ions that occupy Gd3+ sites will not lead to a large distortion in the lattice and, if the associated defect due to a difference in charge is at a great distance, the local site will exhibit inversion symmetry. On the other hand, 6-coordinated Eu3+, which has an ionic size of 94.7 pm, when occupying a 6-coordinated Zr4+ site (ionic size 72 pm) gives rise to a larger difference in size and can lead to distortion in the octahedral, which results in a local site without inversion symmetry. Thus, the observed spectra, in which the 5D07F2 (ED) transition of Eu3+ ions at 613 nm is much more intense than the 5D07F1 (MD) transition, can be attributed to majority of Eu3+ ions occupying Zr4+ sites without inversion symmetry, although oxygen vacancies are introduced in the vicinity to ensure local charge compensation. The presence of an MDT indicates that europium also occupies Gd3+ sites with inversion symmetry. The slight mismatch in ionic size between Gd3+ and Eu3+ may also lead to distortion of the original lattice and breaks the Oh inversion symmetry.

To study the performance of the material in coloured luminescent emission, CIE chromaticity coordinates were determined by adopting standard procedures for the Gd2Zr2O7:Eu3+ system. Normally, the colour of any light source can be represented as an (x, y) coordinate in this colour space. The prominent wavelength is defined as the single monochromatic wavelength that appears to be the same colour as the light source. The calculation of the CIE chromaticity coordinates for a system requires the multiplication of its spectral power at each wavelength by a weighting factor for each of the three colour-matching functions. The addition of these contributions gives three values, which are called the tristimulus values, from which the chromaticity coordinates can be derived. The values of the x and y coordinates for the Gd2Zr2O7:Eu3+ system were calculated to be 0.57 and 0.24, respectively. This is pictorially represented in Fig. 8c, in which the (x, y) point is denoted by an asterisk. The CIE index for the present phosphor system is very close to the ‘red’ line. Thus, it can be inferred that this particular Eu3+-doped Gd2Zr2O7 phosphor system may be a potential red-emitting phosphor material.

Fig. 9 shows the total and partial DOS calculated via GGA+U of GZO doped with Eu in the Gd and Zr positions, respectively. According to Fig. 9, doping with Eu at the Gd and Zr sites creates either a slight change or hardly any change in the overall DOS of o-GZO. The dominant contribution of f states of Eu3+ mainly lies in the upper part of the VB and a very small (or almost negligible) contribution in the lower part of the CB. The d states of Eu contribute strongly to the lower part of the CB. Moreover, the distribution of f and d states of Eu atoms matches well with the total DOS of o-GZO, which signifies efficient transfer of photon energy from the host to the Eu dopant. Close observation also reveals that d states of Eu contribute strongly to the lower part of the CB (for doping in Zr positions), which enables the transfer of energy in regions of slightly higher wavelength. On the other hand, d states of Eu contribute strongly to the upper part of the CB (for doping in Gd positions), which enables the transfer of energy in regions of slightly lower wavelength. This is in agreement with our measurements of PL decay lifetimes, which clearly indicate the presence of two emitting species: T1 (from a symmetric environment with inversion symmetry) and T2 (from an asymmetric environment without inversion symmetry).


image file: c6ra05113h-f9.tif
Fig. 9 Total and angular momentum-decomposed DOS calculated via GGA+U of Eu-doped o-GZO in which Eu was doped in Gd positions (a) and Zr positions (b).
3.4.4. PL lifetime spectroscopy of Eu3+-doped Gd2Zr2O7. The room-temperature decay curves of the PL emission (Fig. 10) exhibited a non-exponential shape with two slopes. Therefore, we applied double exponential fitting similar to eqn (1), which takes into account both the fast and the slow component of the decay. From these data, the average lifetime (τav) can be calculated according to the following equation:
 
image file: c6ra05113h-t2.tif(2)

image file: c6ra05113h-f10.tif
Fig. 10 PL decay profile of Gd2Zr2O7:Eu3+ at λex = 230 nm and λem = 613 nm.

Decay curves that display two lifetimes (0.747 ms, 52% and 2.55 ms, 48%) indicate the presence of Eu3+ ions in two different chemical environments.

In general, analysis of the lifetime showed the presence of two components: a shorter one and a longer one. The values of the lifetime were ∼747 μs (short component, T1, 52%) and 2.55 ms (long component, T2, 48%), which can be indicative of the presence of two emitting species or states. Assuming the concept of phonon frequency, a relatively longer fluorescence lifetime should be attributed to a more symmetrically oriented site, because in that case the f–f transition becomes highly forbidden, whereas a shorter lifetime is often associated with an asymmetrically oriented site owing to relaxation of the Laporte selection rules. Based on the above analogy, it can be said that species T2 (2.55 ms) arises because of Eu3+ ions occupying 8-coordinated Gd3+ sites with inversion symmetry, whereas species T1 (747 μs) can be ascribed to Eu3+ ions occupying 6-coordinated Zr4+ sites without inversion symmetry. These results also corroborate our emission and DFT studies, in which we observed that Eu3+ ions occupy both Zr4+ and Gd3+ sites. Almost equal populations of europium ions at Gd3+ (48%) and Zr4+ (52%) sites are also implied in the following discussion based on DFT calculations of the energetics and supercell volume for the site-selective doping of Eu ions in Gd2Zr2O7.

In order to understand the structural stability of the site-selective doping of Eu in o-GZO, the cohesive energies (E0) and equilibrium volumes (V0) of Eu-doped o-GZO were calculated after full structural relaxation as described in the Computational details section. In our calculations, we considered a level of doping of Eu3+ of 1/88 (1.136%) in o-GZO and the results are shown in Table 2. Our calculations using DFT of differences in the cohesive energy of doped supercells (doped in Gd and Zr positions, respectively) show very similar values, with a difference of 10 meV per atom. This difference in energy is almost equivalent to the room-temperature thermal vibrational energy (kBT in meV per atom). Therefore, occupation by a Eu atom is equally probable in both Gd and Zr sites from our energies calculated using DFT.

Table 2 Energetics and supercell volume calculated using DFT for site-selective doping of Eu ions in o-Gd2Zr2O7. ΔEcohesive represents the difference in cohesive energy in site-selective doping with respect to the most energetically stable configuration
Position of Eu doping ΔEcohesive in eV Supercell volume in Å3
Gd position 0 1191.55
Zr position 0.86 1184.01


3.4.5. Point group symmetry of the Eu3+ site in Gd2Zr2O7: study of the electric-dipole transition (ΔJ = ±2 and ±4). Based on the number of crystal field components observed for the 5D07FJ transitions the point group symmetry of the Eu3+ site can be determined. Among the transitions of the europium ion, 5D07F1, which is a magnetic-dipole transition, is unaffected by the local environment, whereas 5D07F2 (hypersensitive electric-dipole transition) is strongly influenced by the local surroundings. The other electric-dipole transition 5D07F4 is also affected by environmental factors but is not hypersensitive. We considered the spectral patterns of 5D07F2 and 5D07F4 to determine the point group symmetry of Eu3+ in Gd2Zr2O7. Fig. 11 shows a slow-scan recording of the emission spectrum in selective 5D07F2 and 5D07F4 regions.
image file: c6ra05113h-f11.tif
Fig. 11 Stark splitting patterns of electric-dipole transitions corresponding to ΔJ = ±2 and ±4 of Eu3+ in Gd2Zr2O7.

The substitution of Gd3+ by Eu3+ may not result in substantial lattice distortion because of their similar ionic sizes and charges, but distortion still takes place because europium occupies a 6-coordinated Zr4+ site. The substitution of Zr4+ by Eu3+ results in significant lattice distortion because of mismatches in size and charge. From the Stark splitting pattern shown in Fig. 11, two peaks for the 5D07F2 ED transition (hypersensitive, ΔJ = ±2) and three lines for the 5D07F4J = ±4) ED transition of Eu3+ were resolved for Gd2Zr2O7:Eu3+ (1.0 mol%). According to the branching rules of various point groups,50 it is inferred that the actual site symmetry of Eu3+ in gadolinium zirconate is reduced from the original Oh/D3d for Gd3+/Zr4+ (ref. 51) to D2d.

3.5. Photophysical properties and Judd–Ofelt analysis of Eu3+-doped Gd2Zr2O7

Based on the emission spectra (corrected with respect to the source, monochromator and detector) of europium-doped inorganic phosphors, various optical properties such as their radiative and non-radiative lifetimes, quantum yield, branching ratio, etc. can be determined. For lanthanide ions other than Eu3+ there are no pure MDTs and therefore absorption spectrum data are needed for such analyses, unlike with europium ions. A detailed procedure for all these calculations is mentioned in our earlier report.14,52 Other than this, among the most important optical parameters are the Judd–Ofelt (JO) intensity parameters, ΩJ (J = 2, 4), which are calculated via classical calculations based on Judd–Ofelt theory.53,54 These classical parameters give information about the local symmetry, covalency and polarizability around lanthanide ions. The short-range parameter Ω2 gives information about local properties such as the degree of covalency and polarizability of the chemical environment experienced by a Ln3+ ion in an inorganic host. On the other hand, the long-range parameter Ω4 gives information about bulk properties such as the viscosity and rigidity of inorganic crystals.14,52

For all the calculations, spectra corrected with respect to the source, monochromator and detector that correspond to the excitation wavelength of the charge-transfer band are used. Because the 5D07F1 transition of the Eu3+ ion, which is known to be a magnetic-dipole transition, is not influenced much by environmental factors its transition rate is constant with an approximate value of 50 s−1.55 For Gd2Zr2O7, we adopted a value of the index of refraction of 2.90 (ref. 56) for calculations.

The JO parameters and other photophysical values are listed in Table 3.

Table 3 J–O intensity parameters and radiative properties of Eu3+ in Gd2Zr2O7
Transition ARed (s−1) ARmd (s−1) ΩJ (10−21 cm2) βJ (%) η (%) τR (ms) τNR (s)
5D07F1 0 50 19.4 50.9 3.88 (AR = 258 s−1) 4.02 (ANR = 258 s−1)
5D07F2 150 0 4.63 58.3
5D07F4 57.6 0 3.57 22.3


In the case of Gd2Zr2O7:Eu, the value of Ω2 was found to be greater than that of Ω4, which indicates high covalency and low symmetry around the europium ion, which is also observed from the emission spectrum, in which the 5D07F2 transition (EDT) dominates the 5D07F1 transition (MDT). This is fully in agreement with the high value of asymmetry (EDT/MDT ∼ 2.99) of Eu3+ in gadolinium zirconate. The calculated radiative transition rate (AR) for the excited 5D0 level of the Eu3+ ion was found to be 258 s−1, which is almost equal to the non-radiative transition rate (ANR = 257.7 s−1). The ANR can be attributed to non-radiative decay via different channels. There are many factors that contribute to non-radiative transitions, such as the presence of defects, oscillators with low vibration, surface inhomogeneity, etc. The presence of OH, CO, and COO is also evident in the FTIR spectrum. The trend in the branching ratio suggests that the greatest part of the radiative energy (58.3%) is released in the 5D07F2 transition and the least part (19.4%) in the 5D07F1 transition. This is also observed from the emission spectrum, in which the 5D07F2 transition is much more intense than the 5D07F1 transition. The quantum efficiency of this particular phosphor, which is defined as the ratio of the experimental lifetime to the calculated radiative lifetime of the 5D0 level, is good at around 50.9%. The high purity of the red emission coupled with good fluorescence quantum yields highlight the unexplored potential of Gd2Zr2O7 as a promising phosphor.

4. Conclusion

The Gd2Zr2O7 pyrochlore was synthesized at 800 °C using a simple and highly efficient gel combustion method. As prepared Gd2Zr2O7 gadolinium zirconate was characterized by various techniques such as XRD, FTIR, SEM, EDS and TRPLS. The emission spectrum of pure Gd2Zr2O7 displayed an intense band at 530 nm in the green region. The green emission peak at 530 nm was attributed to the presence of defects. XPS and lifetime measurements showed that the presence of oxygen vacancies in the Gd2Zr2O7 pyrochlore was responsible for its intense green emission. First-principles calculations were performed to calculate the electronic density of states (DOS) of ideal Gd2Zr2O7 and the change in the electronic DOS in the presence of oxygen vacancies (neutral and charged) using projector augmented wave potentials and the generalized gradient approximation with the Hubbard U correction. Analysis of the electronic DOS and formation energy of vacancies calculated using DFT showed that the PL emission in the green region was generated via charged oxygen defects. An emission that was characteristic of Eu3+ ions showed the presence of both MD and ED transitions, which is attributed to the distribution of Eu3+ ions over both Gd3+ and Zr4+ sites in Gd2Zr2O7, which was also confirmed using lifetime measurements and DFT calculations. Eu3+ at Gd3+ sites led to an MDT, whereas Eu3+ at Zr4+ sites led to an EDT. Regarding doping with europium, energy was completely transferred from the host to the dopant ion, which was predicted using DFT calculations. Close observation also revealed that d states of Eu3+ contributed strongly to the lower part of the CB (for doping in Zr positions), which enabled the transfer of energy in regions of slightly higher wavelength. On the other hand, d states of Eu3+ contributed strongly to the upper part of the CB (for doping in Gd positions), which enabled the transfer of energy in regions of slightly lower wavelength. The point group symmetry of europium ions in Gd2Zr2O7 was also calculated based on the Stark splitting pattern and was found to be D2d, although it is Oh for Gd3+ in Gd2Zr2O7. Trends in the Judd–Ofelt parameters indicate high covalency and low symmetry around europium ions, which is also observed from the emission spectrum. The high purity of the red emission line along with good fluorescence quantum yields (∼51%) highlight the unexplored potential of Gd2Zr2O7 as a promising phosphor.

Acknowledgements

The authors would like to thank Dr S. P. Koiry (Technical Physics Division, BARC) for FTIR measurements and Santu Kaity (Radio Metallurgy Division, BARC) for SEM and EDS measurements.

References

  1. R. J. Walker, A. Pougin, E. E. Oropeza, I. J. Villar-Gracia, M. P. Ryan, J. Strunk and D. J. Payne, Chem. Mater., 2016, 28, 90 CrossRef CAS.
  2. (a) L. D. Pan, N. J. Laurita, K. A. Ross, B. D. Gaulin and N. P. Armitage, Nat. Phys., 2016, 12, 361 CrossRef CAS; (b) Z. Tian, Y. Kohama, T. Tomita, H. Ishizuka, T. H. Hsieh, J. J. Ishikawa, K. Kindo, L. Balents and S. Nakatsuji, Nat. Phys., 2016, 12, 134 CrossRef CAS; (c) S. T. Bramwell and M. J. P. Gingras, Science, 2001, 294, 1495 CrossRef CAS PubMed.
  3. (a) R. Radha, A. Srinivasan, P. Manimuthu and S. Balakumar, J. Mater. Chem. C, 2015, 3, 10285 RSC; (b) J. Parrondo, M. George, C. Capuano, K. E. Ayers and V. Ramani, J. Mater. Chem. A, 2015, 3, 10819 RSC; (c) M. C. Hsieh, G. C. Wu, W. G. Liu, W. A. Goddard III and C. M. Yang, Angew. Chem., Int. Ed., 2014, 53, 14216 CrossRef CAS PubMed; (d) B. Kiss, C. Didier, T. Johnson, T. D. Manning, M. S. Dyer, A. J. Cowan, J. B. Claridge, J. R. Darwent and M. J. Rosseinsky, Angew. Chem., Int. Ed., 2014, 53, 14480 CrossRef CAS PubMed.
  4. T. Kondo, M. Nakayama, R. Chen, J. J. Ishikawa, E.-G. Moon, T. Yamamoto, Y. Ota, W. Malaeb, H. Kanai, Y. Nakashima, Y. Ishida, R. Yoshida, H. Yamamoto, M. Matsunami, S. Kimura, N. Inami, K. Ono, H. Kumigashira, S. Nakatsuji, L. Balents and S. Shin, Nat. Commun., 2015, 6, 10042 CrossRef PubMed.
  5. C. Fisher, S. Finkeldei, F. Brandt, D. Bosbach and A. Luttage, ACS Appl. Mater. Interfaces, 2015, 7, 17857 Search PubMed.
  6. T. S. Sreena, P. R. Prabhakar, T. F. Linda, A. K. V. Raj and P. S. Babu, Dalton Trans., 2015, 44, 8718 RSC.
  7. (a) J. Wu, X. Wei, N. P. Padture, P. G. Klemens, M. Gell, E. Garcia, P. Miranzo and M. L. Osendi, J. Am. Ceram. Soc., 2002, 85, 3031 CrossRef CAS; (b) B. P. Singh, A. K. Parchur, R. S. Ningthoujam, P. V. Ramakrishna, S. Singh, P. Singh, S. B. Rai and R. Maalej, Phys. Chem. Chem. Phys., 2014, 16, 22665 RSC.
  8. Y. H. Lee, H. S. Sheu, J. P. Deng and H.-C. I. Kao, J. Alloys Compd., 2009, 487, 595 CrossRef CAS.
  9. Y. N. Han, S. Jia, M. Xu, Y. Xu, G. Pang and S. Feng, RSC Adv., 2015, 4, 24142 RSC.
  10. (a) N. Pathak, P. S. Ghosh, S. K. Gupta, S. Mukherjee, R. M. Kadam and A. Arya, J. Phys. Chem. C, 2016, 120, 4016 CrossRef CAS; (b) N. Pathak, S. K. Gupta, K. Sanyal, M. Kumar, R. M. Kadam and V. Natarajan, Dalton Trans., 2014, 43, 9313 RSC.
  11. R. Shukla, S. K. Gupta, V. Grover, V. Natarajan and A. K. Tyagi, Dalton Trans., 2015, 44, 10628 RSC.
  12. (a) S. K. Gupta, P. S. Ghosh, A. K. Yadav, N. Pathak, A. Arya, S. N. Jha, D. Bhattacharyya and R. M. Kadam, Inorg. Chem., 2016, 55, 1728 CrossRef CAS PubMed; (b) R. Phatak, S. K. Gupta, K. Krishnan, S. K. Sali, S. V. Godbole and A. Das, Dalton Trans., 2014, 43, 3306 RSC; (c) S. K. Gupta, P. S. Ghosh, N. Pathak, A. Arya and V. Natarajan, RSC Adv., 2014, 4, 29202 RSC; (d) N. Pathak, S. K. Gupta, P. S. Ghosh, A. Arya, V. Natarajan and R. M. Kadam, RSC Adv., 2015, 5, 17501 RSC.
  13. (a) S. K. Gupta, P. S. Ghosh, K. Sudarshan, R. Gupta, P. K. Pujari and R. M. Kadam, Dalton Trans., 2015, 44, 19097 RSC; (b) S. K. Gupta, M. Sahu, P. S. Ghosh, D. Tyagi, M. K. Saxena and R. Kadam, Dalton Trans., 2015, 44, 18957 RSC; (c) S. K. Gupta, K. Sudarshan, P. S. Ghosh, K. Sanyal, A. P. Srivastava, A. Arya, P. K. Pujari and R. M. Kadam, RSC Adv., 2016, 6, 3792 RSC.
  14. (a) S. K. Gupta, S. Nigam, A. K. Yadav, M. Mohapatra, S. N. Jha, C. Majumder and D. Bhattacharyya, New J. Chem., 2015, 39, 6531 RSC; (b) S. K. Gupta, P. S. Ghosh, M. Sahu, K. Bhattacharyya, R. Tewari and V. Natarajan, RSC Adv., 2015, 5, 58832 RSC.
  15. L. Wang, J. I. Eldridge and S. M. Guo, Scr. Mater., 2013, 69, 674 CrossRef CAS.
  16. K.-J. Hu, Z.-G. Liu, J.-Y. Wang, T. Wang and J.-H. Ouyang, Mater. Lett., 2012, 89, 276 CrossRef CAS.
  17. W. Zheng, P. Huang, D. Tu, E. Ma, H. Zhu and X. Chen, Chem. Soc. Rev., 2015, 44, 1379 RSC ; and references therein.
  18. S. K. Gupta, M. Sahu, K. Krishnan, M. Saxena, V. Natarajan and S. V. Godbole, J. Mater. Chem. C, 2013, 1, 7054 RSC.
  19. S. K. Gupta, M. Mohapatra, S. V. Godbole and V. Natarajan, RSC Adv., 2013, 3, 20046 RSC.
  20. S. K. Gupta, B. Rajeshwari, S. N. Achary, S. J. Patwe, A. K. Tyagi, V. Natarajan and R. M. Kadam, Eur. J. Inorg. Chem., 2015, 2015, 4429 CrossRef CAS.
  21. J.-C. G. Bunzli and C. Piguet, Chem. Soc. Rev., 2005, 34, 1048 RSC.
  22. Q. Liu and X. Y. Chen, Nanotechnology, 2007, 18, 255704 CrossRef.
  23. A. Arakcheeva, D. Logvinovich, G. Chapuis, V. Morozov, S. V. Eliseeva, J. C. G. Bunzli and P. Pattison, Chem. Sci., 2012, 3, 384 RSC.
  24. P. A. Tanner, Chem. Soc. Rev., 2013, 42, 5090 RSC.
  25. X. Yao, Proceedings of the Tenth IEEE International Symposium on Applications of Ferroelectrics ISAF-96, 1996 Search PubMed.
  26. N. R. Sanjay Kumar, N. V. Chandra Shekar and P. C. Sahu, Solid State Commun., 2008, 147, 357 CrossRef.
  27. V. Thampi, P. R. Padala and A. N. Radhakrishnan, New J. Chem., 2015, 39, 1469 RSC.
  28. L. Guo, H. Guo, H. Peng and S. Gong, J. Eur. Ceram. Soc., 2014, 34, 1255 CrossRef CAS.
  29. X. L. Xia, Z. G. Liu, J. H. Ouyang, S. Gao and X. M. Liu, Solid State Sci., 2011, 13, 328 Search PubMed.
  30. M. S. Rabasovic, D. Sevic, J. Krizan, M. Terzic, J. Mozina, B. P. Marinkovic, S. Sevic, M. Mitric, M. D. Rabasovic and N. Romkevic, J. Alloys Compd., 2015, 622, 292 CrossRef CAS.
  31. K. S. Lee, K. I. Jung, Y. S. Heo, T. W. Kim, Y. G. Jung and U. Paik, J. Alloys Compd., 2010, 507, 448 CrossRef CAS.
  32. F. A. Rabuffetti, S. P. Culver, J. S. Lee and R. L. Brutchey, Nanoscale, 2014, 6, 2909 RSC.
  33. M. S. Rabasovic, D. Sevic, J. Krizan, M. M. D. Rabasovic and N. Romkevic, Sci. Sintering, 2015, 47, 269 CrossRef.
  34. M. S. Rabasovic, J. Krizan, P. Gregrocic, M. D. Rabasovic, N. Romkevic and D. Sevic, Opt. Quantum Electron., 2016, 48, 163 CrossRef.
  35. G. Kresse and J. Furthmueller, Phys. Rev. B: Condens. Matter Mater. Phys., 1996, 5, 11169 CrossRef.
  36. G. Kresse and J. Furthmueller, Comput. Mater. Sci., 1996, 6, 15 CrossRef CAS.
  37. P. E. Blöchl, Phys. Rev. B: Condens. Matter Mater. Phys., 1994, 50, 17953 CrossRef.
  38. J. P. Perdew, K. Burke and M. Ernzerhof, Phys. Rev. Lett., 1996, 77, 3685 CrossRef PubMed.
  39. S. L. Dudarev, G. A. Botton, S. Y. Savrasov, C. J. Humphreys and A. P. Sutton, Phys. Rev. B: Condens. Matter Mater. Phys., 1998, 57, 1505 CrossRef CAS.
  40. Y. B. Losovyj, D. Wooten, J. C. Santana, J. M. An, K. D. Belashchenko, N. Lozova, J. Petrosky, A. Sokolov, J. Tang and W. Wang, J. Phys.: Condens. Matter, 2009, 21, 045602 CrossRef PubMed.
  41. H. J. Monkhorst and J. D. Pack, Phys. Rev. B: Condens. Matter Mater. Phys., 1979, 13, 5188 CrossRef.
  42. P. E. Blöchl, O. Jepsen and O. K. Andesen, Phys. Rev. B: Condens. Matter Mater. Phys., 1994, 4, 16223 CrossRef.
  43. L. Ma, W. Ma and X. Sun, Key Eng. Mater., 2013, 544, 8 CrossRef.
  44. L. Kong, I. Karatchevtseva, D. J. Gregg, M. G. Blackford, R. Holmes and G. Triani, J. Eur. Ceram. Soc., 2013, 33, 3273 CrossRef CAS.
  45. N. S. Ham, H. S. Shim, J. H. Seo, S. Y. Kim, S. M. Park and J. K. Song, J. Appl. Phys., 2010, 107, 084306 CrossRef.
  46. M. Chen, X. Wang, Y. H. Yu, Z. L. Pei, X. D. Bai, C. Sun, R. F. Huang and L. S. Wen, Appl. Surf. Sci., 2000, 158, 134 CrossRef CAS.
  47. V. Kumar, V. Kumar, S. Som, J. H. Neethling, E. Olivier, O. M. Ntwaeaborwa and H. C. Swart, Nanotechnology, 2014, 25, 135701 CrossRef PubMed.
  48. B. P. Mandal and A. K. Tyagi, J. Alloys Compd., 2007, 437, 260 CrossRef CAS.
  49. B. P. Mandal, A. Banerji, V. Sathe, S. K. Deb and A. K. Tyagi, J. Solid State Chem., 2007, 180, 2643 CrossRef CAS.
  50. K. Binnemans, Coord. Chem. Rev., 2015, 295, 1 CrossRef CAS.
  51. M. A. Subramanian, G. Aravamudan and G. V. Subba Rao, Prog. Solid State Chem., 1983, 15, 55 CrossRef CAS.
  52. M. Keskar, S. K. Gupta, R. Phatak, S. Kannan and V. Natarajan, J. Photochem. Photobiol., A, 2015, 311, 59 CrossRef CAS.
  53. G. Blasse, Phys. Lett. A, 1968, 28, 444 CrossRef CAS.
  54. B. R. Judd, Phys. Rev., 1962, 127, 750 CrossRef CAS.
  55. G. F. de Sa, O. L. Malta, C. M. Donega, A. M. Simas, R. L. Longo, P. A. Santa-Cruz and E. F. da Silva, Coord. Chem. Rev., 2000, 196, 165 CrossRef CAS.
  56. L. Wang, J. I. Eldridge and S. M. Guo, Scr. Mater., 2013, 69, 674 CrossRef CAS.

This journal is © The Royal Society of Chemistry 2016
Click here to see how this site uses Cookies. View our privacy policy here.