
 Open Access Article
 This Open Access Article is licensed under a
 Creative Commons Attribution 3.0 Unported Licence
“Green” gold nanotriangles: synthesis, purification by polyelectrolyte/micelle depletion flocculation and performance in surface-enhanced Raman scattering†
Ferenc
Liebig
a,
Radwan M.
Sarhan
b,
Claudia
Prietzel
a,
Antje
Reinecke
c and
Joachim
Koetz
*a
aUniversity of Potsdam, Institute for Chemistry, Karl-Liebknecht-Str. 24-25, 14476 Potsdam, Germany. E-mail: koetz@uni-potsdam.de; Fax: +493319775054; Tel: +493319775220
bUniversity of Potsdam, Institute for Physics, Karl-Liebknecht-Str. 24-25, 14476 Potsdam, Germany
cMax Planck Institute of Colloids and Interfaces, Am Mühlenberg 1, 14476 Potsdam, Germany
First published on 24th March 2016
Abstract
The aim of this study was to develop a one-step synthesis of gold nanotriangles (NTs) in the presence of mixed phospholipid vesicles followed by a separation process to isolate purified NTs. Negatively charged vesicles containing AOT and phospholipids, in the absence and presence of additional reducing agents (polyampholytes, polyanions or low molecular weight compounds), were used as a template phase to form anisotropic gold nanoparticles. Upon addition of the gold chloride solution, the nucleation process is initiated and both types of particles, i.e., isotropic spherical and anisotropic gold nanotriangles, are formed simultaneously. As it was not possible to produce monodisperse nanotriangles with such a one-step procedure, the anisotropic nanoparticles needed to be separated from the spherical ones. Therefore, a new type of separation procedure using combined polyelectrolyte/micelle depletion flocculation was successfully applied. As a result of the different purification steps, a green colored aqueous dispersion was obtained containing highly purified, well-defined negatively charged flat nanocrystals with a platelet thickness of 10 nm and an edge length of about 175 nm. The NTs produce promising results in surface-enhanced Raman scattering.
1. Introduction
Monodisperse gold nanoparticles (NPs) are of increasing interest due to their shape and size-dependent optical properties,1,2 which are of enormous interest for many applications in photonics,3 catalysis,4 electronics5 and biomedicine.6 It is already well established from Turkevich et al. that monodisperse spherical NPs can be synthesized by adding sodium citrate as a reducing agent to a highly diluted aqueous gold chloride solution.7 The nucleation process in the presence of sodium citrate was than further refined by Frens, as a bottom up strategy to build up monodisperse spherical NPs of different sizes.8Recently, it was shown that asymmetric shaped NPs are formed by using special reduction agents, like lemongrass,9 or tryptophan.10 Other strategies towards the development of anisotropic nanoparticles include templates,11 such as dendrimers,12 microemulsions,13,14 or polyelectrolyte micelles.15
Current seeding-mediated synthesis methods are very efficient in controlling the size and shape of anisotropic gold nanoparticles and, especially, those of nanorods. Over a decade ago, Jana et al. had already proposed a seed-mediated, surfactant-assisted two-step approach involving the use of the cationic surfactant, CTAB.16 The seed-mediated synthesis, in presence of CTAB, is very sensitive to halide ions,10,17,18 meaning that nanorods are only formed in absence of iodide ions. Furthermore, the shape of gold crystals can be dramatically changed upon addition of trace amounts of iodide ions, resulting in the formation of gold nanoprisms.19 Mirkin and co-workers studied the growth of nanoparticles on CTAC-capped seeds containing iodide ions in the absence or presence of silver cations and reported that the anisotropic growth only occurs in absence of silver cations.20 Kinetically controlled reaction paths are dependent on the addition rate of ascorbic acid. Hong et al. demonstrated that nanoplates are predominantly formed in presence of iodide ions at the lowest addition rate of the mild reducing agent ascorbic acid.21
Nevertheless, an efficient synthetic method to produce exclusively monodisperse anisotropic gold nanoparticles of defined shape is still lacking. As a result, different attempts have been made to separate anisotropic NPs from spherical ones. However, a separation of the anisotropic particles from the spherical ones is not trivial. The most attractive separation approach was initially developed by Park et al. through the application of a method involving depletion-induced shape and size selection of gold nanoparticles.22 These authors were able to show that rod-like NPs preferential aggregate and sediment in the presence of numerous micelles. Scarabelli et al. used this method very successfully to separate and purify gold nanotriangles (NTs) in presence of CTAC micelles.23
In previous work, different template phases, i.e. mixed phospholipid-based vesicles, were used to build up anisotropic gold nanoparticles in a one-step process.24–26 Applying a strongly alternating polyampholyte, i.e., PalPhBisCarb, and through the variation of the reaction conditions and composition of the template phase, more than 60% of the AuNPs were found to be anisotropic gold nanoplatelets.
The mechanism by which the one-step process leads to the formation of nanotriangles on the surface of mixed vesicles remains unknown. Therefore, the present work is focused, on the one hand, on the growth mechanism of triangular gold nanoplatelets on the surface of vesicles in presence of different reducing agents, i.e., polyelectrolytes and low molecular reducing agents. On the other hand, the depletion flocculation process of the nanotriangles was investigated through the addition of the anionic surfactant AOT in excess. As a result of our research, purified negatively charged nanoplatelets with a yield of 99.8% after several purification steps and a polydispersity of 10% were obtained, which can be used for SERS measurements or as a nano-platform for the construction of superstructures, for instance, with oppositely charged spherical nanoparticles.
2. Experimental details
2.1. Materials
The phospholipid PL90G (purity > 97.3%) was obtained from PHOSPHOLIPID GmbH. The surfactant dioctyl sodium sulfosuccinate (AOT) with a purity of 98%, hydrogen tetrachloroaurate(III) trihydrate (HAuCl4·3H2O), 4-nitrothiophenol (4-NTP), the commercially available polymers PDADMAC (<100![[thin space (1/6-em)]](https://www.rsc.org/images/entities/char_2009.gif) 000 g mol−1, 35 wt% in H2O), poly(acrylic acid) sodium salt (PAA) (60000 g mol−1) and alginic acid from brown algae (AlgA) (64000 g mol−1) were purchased from Sigma-Aldrich. Lemon grass oil, lactic acid (≥98%) and L(+)-ascorbic acid (≥99%) were obtained from Roth. Molecular biology grade trisodium citrate dehydrate was obtained from Electran. All chemicals were used as received. The strongly alternating copolymer poly(N,N′-diallyl-N,N′-dimethylammonium-alt-3,5-bis-carboxyphenyl-maleamic carboxylate (PalPhBisCarb) was synthesized by free radical polymerization according to the procedure described by Fechner and Koetz.27 The molecular weight (15000 g mol−1) was determined viscometrically by using available constants of the homopolymer poly(diallyldimethylammonium chloride) (PDADMAC) for the Kuhn–Mark–Houwink–Sakurada equation. Only distilled water, which had passed through a Milli-Q Reference A+ water purification system from Millipore, was used in all of the described experiments.
000 g mol−1, 35 wt% in H2O), poly(acrylic acid) sodium salt (PAA) (60000 g mol−1) and alginic acid from brown algae (AlgA) (64000 g mol−1) were purchased from Sigma-Aldrich. Lemon grass oil, lactic acid (≥98%) and L(+)-ascorbic acid (≥99%) were obtained from Roth. Molecular biology grade trisodium citrate dehydrate was obtained from Electran. All chemicals were used as received. The strongly alternating copolymer poly(N,N′-diallyl-N,N′-dimethylammonium-alt-3,5-bis-carboxyphenyl-maleamic carboxylate (PalPhBisCarb) was synthesized by free radical polymerization according to the procedure described by Fechner and Koetz.27 The molecular weight (15000 g mol−1) was determined viscometrically by using available constants of the homopolymer poly(diallyldimethylammonium chloride) (PDADMAC) for the Kuhn–Mark–Houwink–Sakurada equation. Only distilled water, which had passed through a Milli-Q Reference A+ water purification system from Millipore, was used in all of the described experiments.
2.2. Characterization methods
UV-vis absorption measurements were carried out with an Agilent 8453 UV-vis-NIR spectrometer covering the wavelength range 200 to 1100 nm. The shape and size of the gold nanoparticles were determined by transmission electron microscopy (TEM). Samples were dropped on carbon-coated copper grids. Upon air drying (using a suspension preparation procedure), the samples were examined using either one of two TEMs, mainly with a JEOL JEM-1011 at an acceleration voltage of 80 kV, or with a JEOL JEM-2200 FS to obtain higher resolution TEM (HRTEM) images, at an acceleration voltage of 200 kV. For the statistical evaluation (yield and polydispersity) of each sample more than 600 particles were analysed. The polydispersity was determined regarding the average edge length. The characterization of the thickness of the gold nanotriangles was performed on PicoScan-AFM from Agilent. In order to obtain the zeta potential, the Malvern Nano Zetasizer 3600, based on the principle of electrophoretic light scattering, was employed. In addition to TEM, a Hitachi S-4800 scanning electron microscope (SEM) was used to analyze the coating layer of the silica wafer for the SERS measurements. Raman spectra were recorded using a confocal Raman Microscope alpha300 from WITec equipped with laser excitation at wavelength of 785 nm. The laser beam was focused through a Nikon 20× microscope objective with a NA of 0.4. The spectra were acquired with a thermoelectrically cooled Andor CCD detector DU401A-BV placed behind the spectrometer UHTS 300 from WITec with a spectral resolution of 3 cm−1. The Raman band of a silicon wafer at 520 cm−1 was used to calibrate the spectrometer.2.3. Synthesis of nanotriangles (NTs)
PL90G (0.5 wt%) and AOT (0.5 wt%) in addition to one of the applied added agents (0.01 wt%) were dispersed together in water and stirred for 24 hours at room temperature. The resulting turbid vesicle dispersion was mixed with the freshly prepared aqueous 2 mM tetrachloroaurate precursor solution. The mixtures were stirred at 45 °C for 45 minutes resulting in a purple colored clear dispersion.2.4. Purification of the NTs by depletion flocculation
As a result of the diversity in shape and size, a separation method was considered necessary in order to obtain pure NTs. Such a separation procedure can be achieved through the use of depletion flocculation, in the presence of polymers or micelles. The separation effect is dependent on the amount of surfactant used for the vesicle phase and the reducing agent. Once separation of triangular gold nanoparticles from the spherical ones had occurred, the dispersion was washed by centrifugation.The depletion flocculation was performed in presence of AOT micelles. The results show that only a combined polyelectrolyte/micelle depletion flocculation process leads to a complete separation of the triangles. The optimum concentration of the added AOT solution was found at 0.02 M.
2.5. Preparation of SERS substrate
For the immobilization of the nanotriangles on the substrate, a silicon wafer was purified in a solution of 30 wt% H2O2 and 30 wt% H2SO4 for 1 h. It was rinsed in deionized water and dried before being used. The wafer was immersed in an aqueous solution of 2% 3-MPTMS ethanol for 6 h, rinsed in ethanol and dried. 100 μl of the gold nanotriangles dispersion were assembled on the wafer surface and the unattached nanotriangles were removed by washing the surface with deionized water. The gold nanotriangle-coated silicon wafer was immersed in 10 mM solution of 4-NTP in ethanol overnight. The wafer was washed with ethanol and deionized water before being measured.3. Results and discussion
3.1 Template phase characterization
A turbid dispersion of negatively charged vesicles was generated under the described conditions. Dynamic light scattering (DLS) experiments of this dispersion showed that there was a very broad particle size distribution (ranging from 50 nm to 5000 nm). The intensity plot revealed a maximum at 450 nm and the number plot had a maximum at around 50 nm (Fig. 1A). The corresponding cryo-SEM micrographs (Fig. 1B) highlighted the presence of small unilamellar vesicles (SUV) of about 50 nm in size, which is in good agreement with the number plot obtained from the DLS data, in addition to the significantly larger giant unilamellar vesicles (GUV). A more detailed inspection of the interior of the GUVs by Cryo-SEM (see Fig. 1B) suggests that these are in fact multivesicular vesicles (MVV). Note, that these GUVs, with diameters up to 50 μm, can be visualized by light microscopy, as shown in Fig. 1C.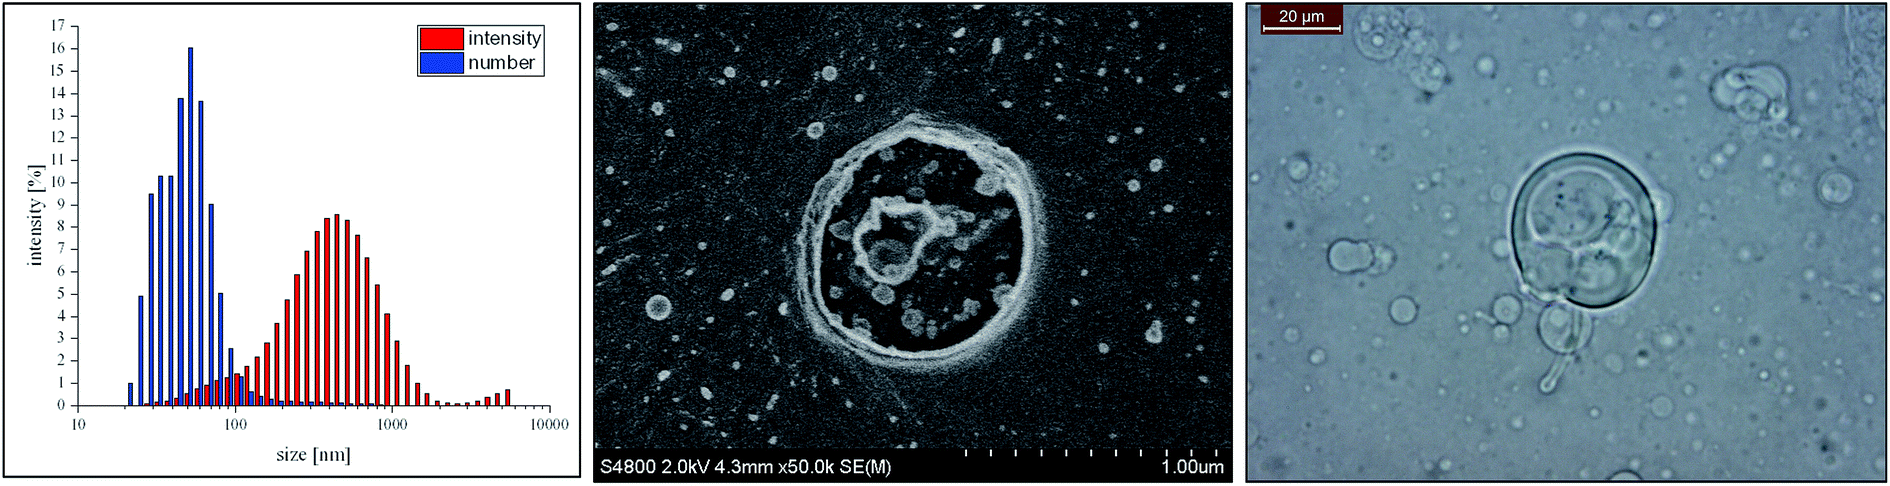 | ||
| Fig. 1 Analysis of the turbid vesicle template phase via DLS intensity and number plot (left), the corresponding Cryo-SEM micrograph (center), and the image of light microscopy (right). | ||
This means that the template phase is a polydisperse vesicle phase containing SUVs that are partly incorporated in GUVs.
3.2. One-step gold nanotriangle formation process
By using the mixed vesicle template phase, in the absence of any additional reducing components, an increase in the UV absorption at higher wavelengths around the peak maximum of 520 nm was observed. The plasmon resonance frequency and, thereby, the position of the localized surface plasmon resonance (LSPR) band is appreciably influenced by the size, shape, dielectric constant of the metal particle and its surroundings. A characteristic plasmon absorption band at about 525 nm can be assigned to spherical gold nanoparticles with a particle diameter between 5 and 40 nm,16 whereas anisotropic nanoparticles like nanorods exhibit two absorption peaks, mainly the transverse plasmon band at 520 nm and the longitudinal band between 700 and 1300 nm, depending on the aspect ratio.28 Asymmetric gold nanoplatelets also absorb in this region, that is between 650 and 1300 nm.9,10,29Applying this knowledge to the UV-vis spectrum shown in Fig. 2, suggests that the formation of anisotropic gold nanoparticles, as well as spherical isotropic gold nanoparticles, has occurred. To get a more detailed understanding about the shape of the nanoparticles, TEM experiments were carried out. In addition to spherical particles of around 20 nm in size, nanotriangles with edge lengths varying between 20 nm and 200 nm were visualized (Fig. 2).
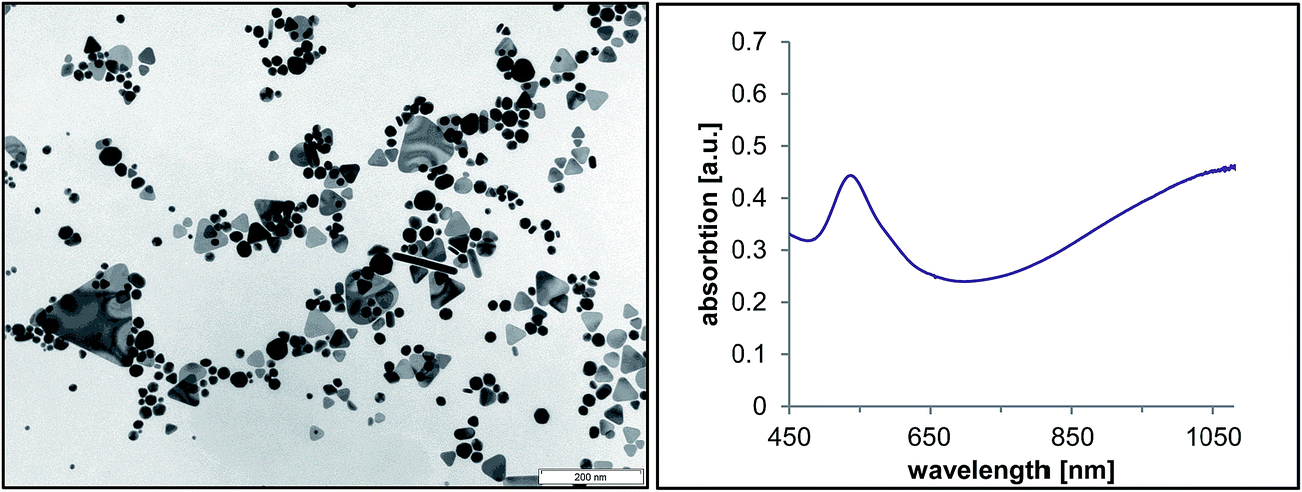 | ||
| Fig. 2 TEM micrograph (left) and corresponding UV-vis spectrum (right) of the gold nanoparticles formed in the template phase without further reducing components. | ||
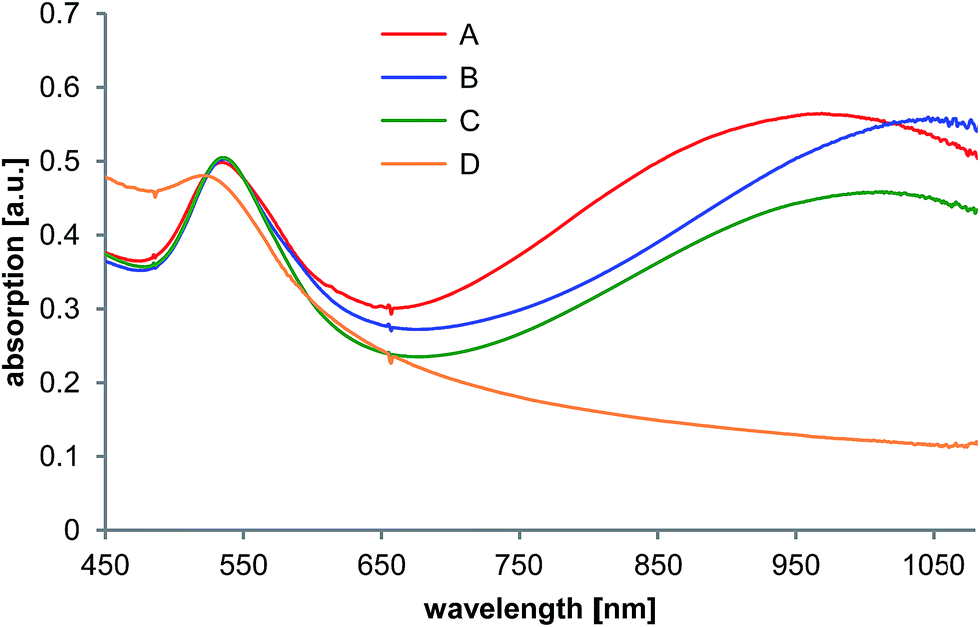 | ||
| Fig. 3 UV-vis absorption spectra of the gold nanoparticles formed in the template phase in presence of PalPhBisCarb (A), PAA (B), AlgA (C) and PDADMAC (D). | ||
When template phases were generated in the presence of macromolecular components, quite different effects were observed.
In case of the polycation PDADMAC, only spherical isotropic gold nanoparticles were formed. This conclusion, based on the TEM micrographs (Fig. S1†) is in good agreement with the corresponding UV-vis spectrum, which showed that there was only a broad peak maximum that was shifted to lower wavelengths (Fig. 3).
By adding the polyanions PAA and AlgA, nanotriangles were formed in addition to spherical nanoparticles. The TEM micrographs as well as the UV-vis spectra indicate an enhancing effect with regard to the formation of NTs. Table 1 shows that the edge length of the NTs increases and the polydispersity decreases, in the same order of magnitude.
| Vesicle phase | Yield (%) | Edge length (nm) | Polydispersity (%) |
|---|---|---|---|
| Without additional compounds | 30 | 44 ± 25 | 56.1 |
| +PalPhBisCarb (A) | 33 | 59 ± 19 | 33.3 |
| +Poly(acrylic acid) (B) | 31 | 90 ± 32 | 35.9 |
| +Alginic acid (C) | 30 | 85 ± 32 | 38.1 |
| +PDADMAC (D) | 0 | — | — |
The use of PalPhBisCarb leads to NTs with an edge length of about 60 nm, representing 33% of all particles, with a slightly lower polydispersity of 33% and a corresponding UV-vis maximum at 950 nm. This can be explained by the fact that PalPhBisCarb behaves like a polyanion at pH 9.
Following experiments in presence of low molecular reducing components containing carboxylic moieties were performed under the same conditions as mentioned before. Table 2 shows the TEM analysis results concerning the triangular structures. The associated TEM micrographs could be found in the ESI (Fig. S2†). Experiments by adding ascorbic acid show that 24% of all particles are triangles permitting a shoulder at 630 nm in the UV-vis spectrum. By replacing ascorbic acid with sodium citrate, larger NTs of about 42 nm in size with a corresponding UV-vis peak at about 720 nm can be observed (Fig. 4). The use of L-lactic acid resulted in the UV-vis maximum being shifted to 820 nm accompanied by the formation of triangles with an average edge length of 68 nm. Under these conditions, deformed nanoplatelets were also generated. In the presence of lemon grass oil, the individual NTs are more uniform with more defined sharp corners resulting in an absorption maximum at 900 nm.
| Vesicle phase | Yield (%) | Edge length (nm) | Polydispersity (%) |
|---|---|---|---|
| +L-Ascorbic acid (E) | 24 | 26 ± 6 | 23.6 |
| +Sodium citrate (F) | 25 | 42 ± 16 | 39.7 |
| +L-Lactic acid (G) | 19 | 68 ± 21 | 31.2 |
| +Lemon grass oil (H) | 27 | 72 ± 18 | 25.1 |
In conclusion, the reducing agents used here show both size and shape-dependent effects. The addition of polyanions, as reducing agents, lead to an increase of nanotriangles, whereas low molecular weight compounds decrease the amount of NTs (Table 2).
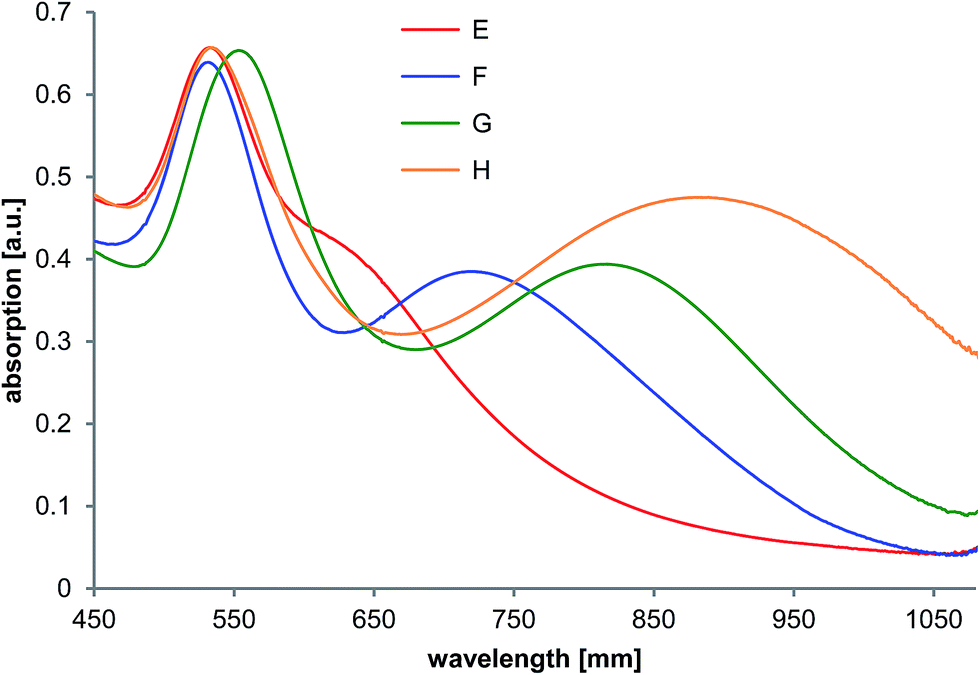 | ||
| Fig. 4 UV-vis absorption spectra of the gold nanoparticles formed in the template phase in presence of L-ascorbic acid (E), sodium citrate (F), L-lactic acid (G) and lemon grass oil (H). | ||
3.3. Mechanism of the NT formation process
To achieve a better understanding of the NT formation process, some additional time-dependent experiments were performed in presence of PalPhBisCarb. Time-dependent UV-vis absorption spectra (Fig. 5) show once a growing peak at 520 nm, which can be directly correlated to the formation of spherical gold nanoparticles, and an appearing peak at 970 nm, which can be attributed to the formation of anisotropic particles. This peak increased over time and shifted towards the resulting absorption maximum at 1050 nm. As a result, the UV short wavelength at 520 nm, as well as the long wavelength absorption at about 1000 nm increased simultaneously with time. Thus, the formation of anisotropic nanotriangles starts isochronously with the formation of isotropic spherical nanoparticles.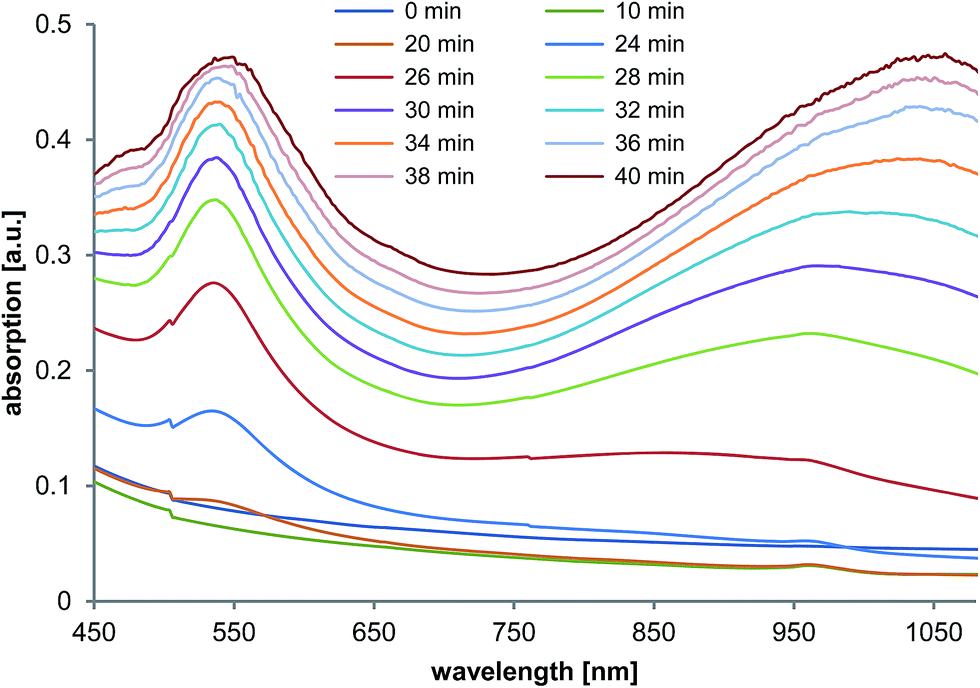 | ||
| Fig. 5 Time-dependent UV-vis measurements during gold nanoparticle synthesis in the presence of PalPhBisCarb. | ||
Additional experiments performed by using light microscopy show a color change to red and green at the same time scale with the rising UV-vis absorption peak. These color effects were detected inside of the giant multivesicular vesicles, where the local concentration of AOT/phospholipon bilayer structures is at its highest.
From a mechanistic point of view one can conclude that one part of the critical nuclei started to grow up until the spherical particles reached a size of about 20 nm in a “classical” nucleation process according to the La Mer diagram. Another part of the critical nuclei grow up until anisotropic NTs were formed due to the symmetry-breaking effects of the template phase, which was influenced by the inner network structure inside of the multivesicular giant vesicles. Recently, we have shown that PalPhBisCarb can transform a mixed AOT vesicle phase into a tubular network structure,30 which is a preferred weak template phase for making nanotriangles. Therefore, one can assume that the nanotriangles are predominantly formed at the junction points inside of the giant multivesicular vesicles.25 Anisotropic crystals can only be formed when the cubic lattice symmetry is interrupted, e.g., by stacking faults. Crystal nuclei with stacking faults can grow to form thin plates with {111} facets on the upper and lower side, e.g., by adding ligands with the affinity for {111} faces. Such ligands can be surfactants as well as polymers. For example alkylated poly(ethyleneimines) and the cationic surfactant CTAB adsorb selective on gold or silver {111} facets.31,32
The growth process of the nanoparticles leads to a decomposition of the giant vesicles and the system becomes optically clear. Attempts to suppress the formation of spherical particles in such a one-step process failed. Therefore, a procedure to separate the anisotropic NTs from the isotropic spherical particles was required.
3.4. Gold nanotriangle separation process
Recently, Scarabelli et al. showed that the initial shape-yield of 50% nanotriangles, produced by a seed-mediated synthesis, can be elevated to 95% by a depletion induced separation process in presence of an excess of CTAC micelles.23 Related experiments with CTAC showed the principal suitability of this procedure to separate our NTs. However, a quantitative and qualitative separation with CTAC micelles was unsuccessful. A reason for that could be the opposite charge of the NTs and CTAC micelles. Therefore, we used in the following experiments an AOT-based depletion flocculation process for our NTs.To verify the quantity and quality of the shape controlled separation process in presence of AOT micelles in excess, TEM analysis and UV-Vis spectroscopy were performed. In the absence of a reducing agent (mixed vesicle template phase without additional components) only an incomplete separation process (NT yield < 50%) was observed. In presence of the low molecular reducing components, the separation procedure proved unsuccessful, too. That means the weak reducing low molecular weight compounds with carboxylic groups do not improve the AOT micelle based depletion flocculation process. Much better results were obtained upon addition of the polyelectrolytes PAA, AlgA, and PalPhBisCarb. The TEM micrographs (Fig. 6) demonstrated that the efficiency of the separation process in the presence of the polyelectrolytes was related to an enforced depletion flocculation. In that case negatively charged NTs with a zeta potential of about −75 mV and non-adsorbing negatively charged polyelectrolytes were combined. Consequently, the AOT micelle-based depletion flocculation process is enhanced by a polymer-based depletion flocculation leading to a quantitative separation of nanoplatelets (NPLs) in the presence of PalPhBisCarb (>99%) and AlgA (>99%), and an almost complete separation in the presence of PAA (96%), taking into account that the amount of well defined nanotriangles with pronounced corners is lower (Table 3). In addition to the NTs, the dispersion contains hexagonal structures, which are incompletely crystallized triangles in different growth phases. UV-vis measurements confirm the TEM analysis, meaning that the peak at around 525 nm, which is usually caused by spherical particles, disappears after three purification (washing and centrifugation) steps (compare Fig. S3†). Compared to the TEM analysis before the separation procedure, the average size of the NTs is increased drastically. This implies that the polyelectrolyte/micelle depletion flocculation affect only the fraction of larger sized NTs.
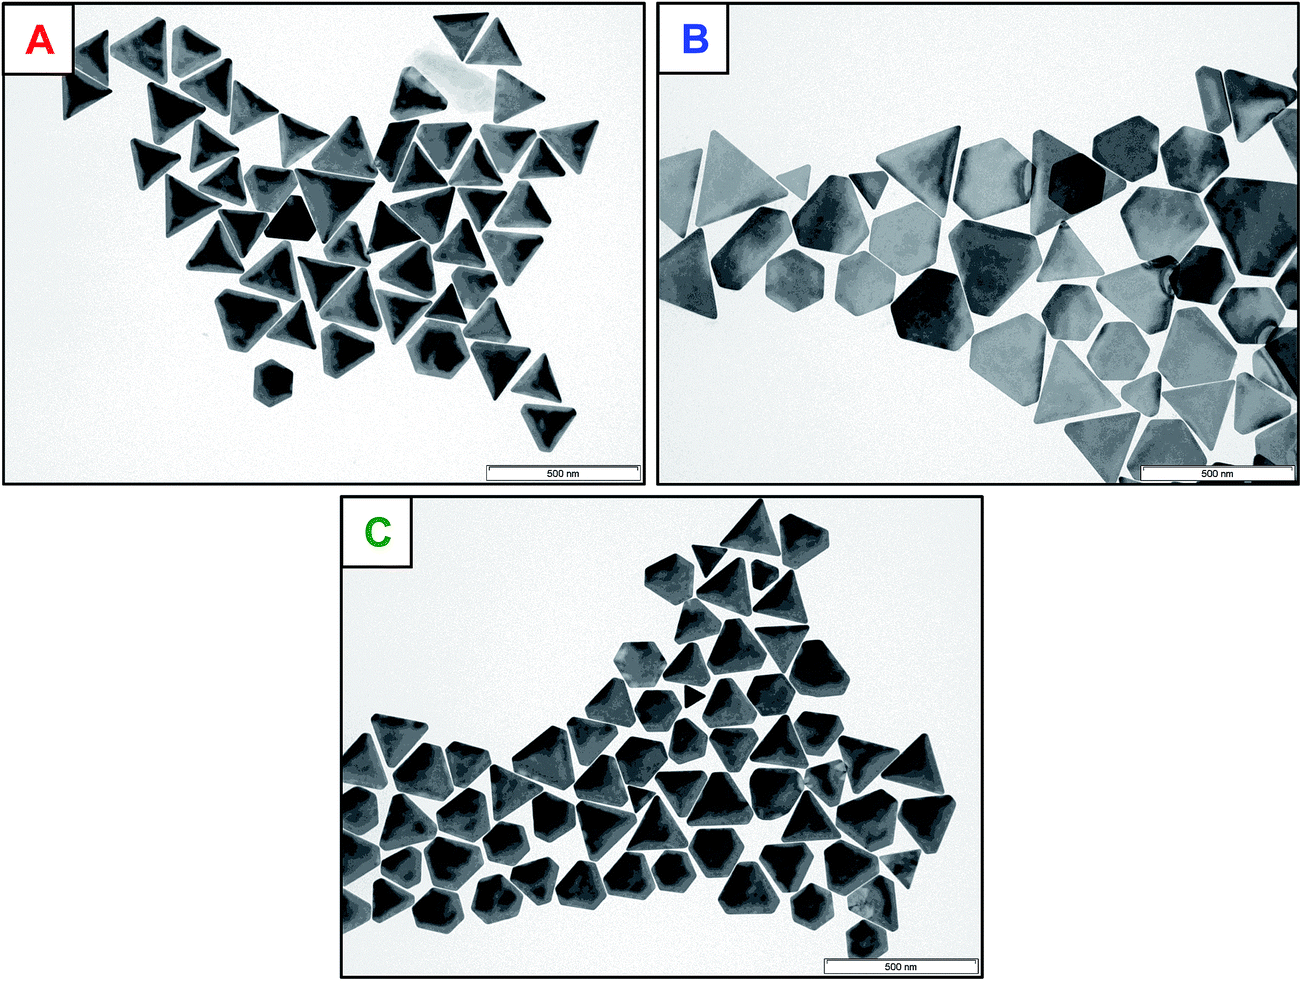 | ||
| Fig. 6 TEM micrographs of the gold nanoparticles in presence of a PalPhBisCarb (A), PAA (B) and AlgA (C). | ||
| Vesicle phase | Yield of NPLs (%) | Yield of NTs (%) | Edge length (nm) | Polydispersity (%) |
|---|---|---|---|---|
| PalPhBisCarb (A) | 99.7 | 79 | 175 ± 17 | 10.1 |
| Poly(acrylic acid) (B) | 96 | 59 | 254 ± 50 | 20.0 |
| Alginic acid (C) | 99.8 | 73 | 169 ± 24 | 14.2 |
The shape-controlled depletion flocculation process showed only efficient results in presence of macromolecules, and seemed to be unaffected by AOT micelles alone. Hence, the depletion flocculation of larger NTs is mainly driven by the polymer, which can act as a reducing agent and is displaced on the particle surface by AOT. By investigating the influence of the molar mass of PAA no significant effect on the NT formation process could be detected.
In summary, our results show that a combined polyelectrolyte/micelle depletion flocculation process is a sensitive and efficient procedure for the separation of larger anisotropic flat nanoplatelets. The highest amount of triangles can be observed in presence of PalPhBisCarb. Surprisingly, the edge length of the isolated NTs (listed in Table 3) is significantly larger in comparison to the initial ones (compare Table 1). Recently, Zhang et al. have shown that the micelle depletion flocculation strongly depends on the type of micelles.29 Therefore, a stepwise flocculation with CTAB and CTAC micelles leads to a size-dependent separation of NTs. Hence, our combined polyelectrolyte/micelle depletion flocculation is even a size-selective process, yielding only the fraction of larger NTs.
3.5. Gold nanotriangle characterization
For a more comprehensive characterization, the resulting green colored dispersions were examined by means of AFM and HRTEM.The AFM measurement in Fig. 7 shows that the nanotriangles were indeed flat nanoplatelets with a thickness of 10 nm. HRTEM micrographs (compare Fig. 8) confirmed the crystalline nature of the flat nanoplatelets with the top and bottom surfaces being composed of {111} facets. The triangles were single crystalline face-centered cubic (fcc) structured and as observed from the fast Fourier transform (FFT) (see inset in the HRTEM micrograph) orientated in the [111] direction. The forbidden 1/3 {422} reflections indicates the presence of twin planes parallel to the (111) surface and perpendicular to the electron beam.33 Thus, the symmetry-braking effects of the AOT/phospholipon bilayer was enhanced in presence of PalPhBisCarb due to the adsorption of the amphoteric polymer on the {111} facets. The special performance of PaPhBisCarb in relation to the polyanions PAA and AlgA can be related to the cationic functional groups of the polyampholyte. The quaternary N-functions may play a similar role to that of the head group of the alkylated PEI samples in the selective adsorption of gold facets.31
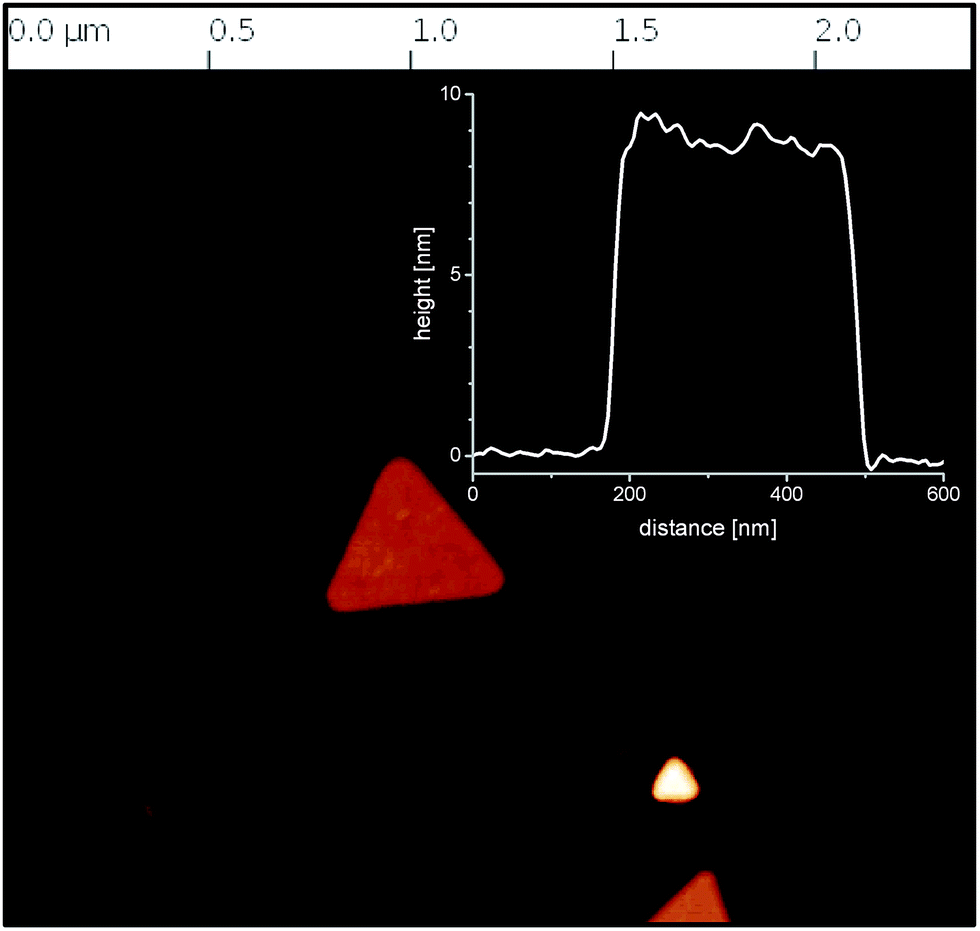 | ||
| Fig. 7 Analysis of the triangle thickness by AFM. | ||
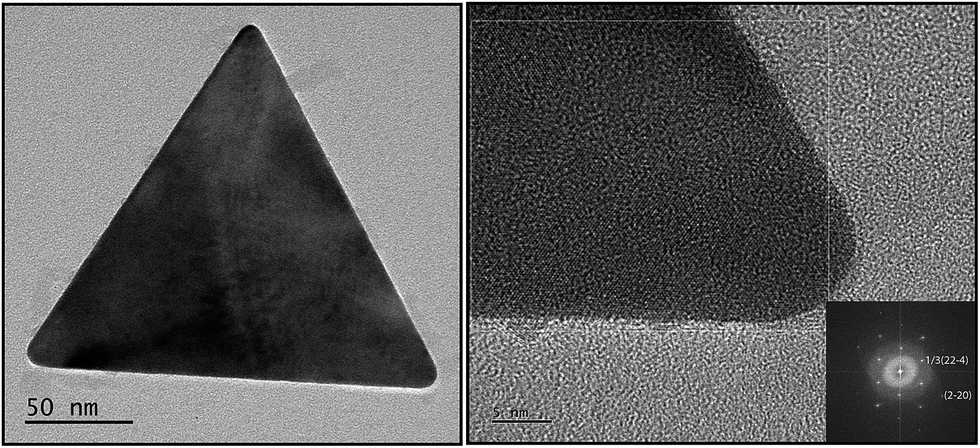 | ||
| Fig. 8 Analysis of the triangle crystallinity by HRTEM; the inset (right) shows the fast Fourier transform (FFT) of the single crystal with the six-fold symmetry of the fcc lattice of gold. | ||
3.6. SERS performance
The SERS effectiveness of the gold nanotriangles synthesized with PalPhBisCarb was studied using 4-nitrothiophenol as a probe, which can be easily chemisorbed on the gold nanoparticles by S–Au covalent bond. First experiments with a highly diluted sample show no significant effect. Therefore, the gold nanotriangle concentration was increased resulting in a completely covered SERS substrate (compare SEM micrograph in Fig. 9). Furthermore, Fig. 9 shows the comparison between Raman spectra of the solid 4-NTP molecules and the adsorbed 4-NTP molecules on SERS substrate. The enhancement of Raman scattering can be directly noticed from the spectra.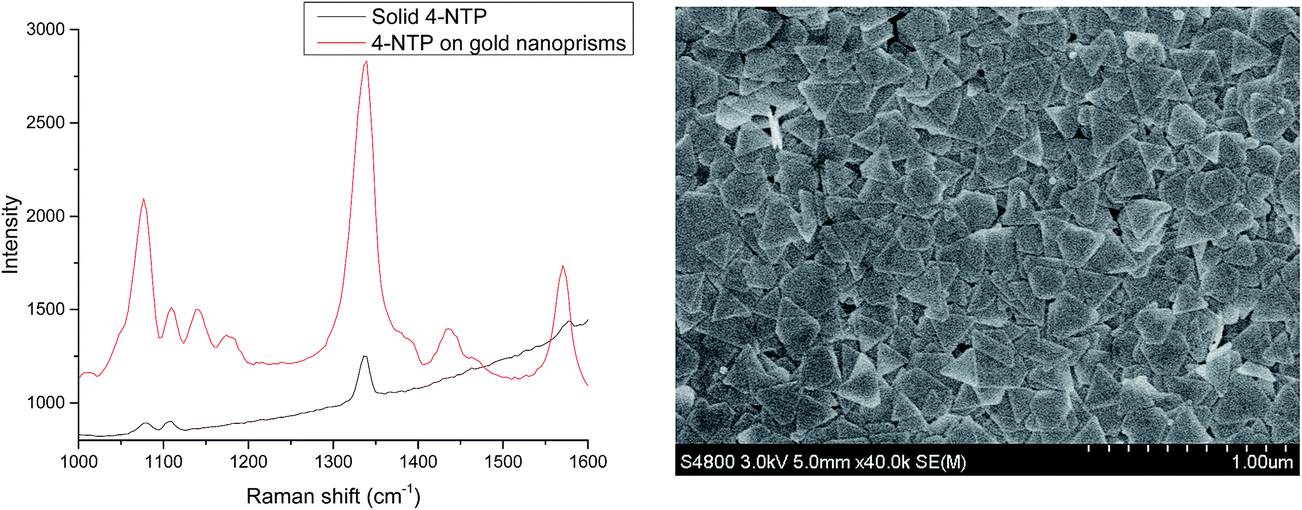 | ||
| Fig. 9 Raman spectrum of 4-nitrothiophenol in absence and presence of gold nanotriangles (left), SEM micrograph of the according substrate (right). | ||
The Raman spectrum of 4-NTP showed the characteristic symmetric stretching of the NO2 group at 1327 cm−1 and the C![[double bond, length as m-dash]](https://www.rsc.org/images/entities/char_e001.gif) C stretching of the phenyl ring at 1568 cm−1.
C stretching of the phenyl ring at 1568 cm−1.
On the gold nanotriangles, new peaks appeared at 1381 cm−1 and 1429 cm−1 due to the plasmon-assisted chemical dimerization of the 4-NTP to 4,4′-dimercaptoazobenzene (DMAB).
The SERS enhancement factor of the 4-NTP on the nanotriangles-fabricated SERS substrate was estimated using the equation:
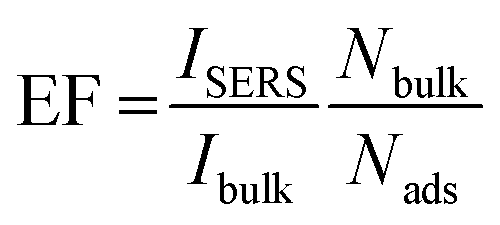
To calculate Nads, formation of a monolayer of 4-NTP on the SERS substrate was assumed.35 Knowing the area occupied by an adsorbed 4-NTP molecule and the laser spot size, the Nads was calculated to be 5.65 × 10⁶. For Nbulk, the irradiated volume was considered as a cylinder with a waist diameter of ∼1.2 μm and a depth of ∼11.5 μm. So Nbulk was calculated to be 1.39 × 10¹¹. For the vibration at 1327 cm−1, the SERS enhancement factor was estimated to be ∼2.76 × 10⁴. We have repeated the measurements on three different batches of the nanotriangles and nearly the same signal enhancement was obtained. Control experiments performed at lower nanoparticle density show a lower signal enhancement.
The high SERS enhancement on the gold nanotriangles-fabricated substrate is mainly attributed to the junctions between the particles and the sharp edges of the nanotriangles, which they have been widely studied as “SERS hot spots”, where the local electromagnetic field and therefore the Raman scattering is enhanced.36
4. Conclusions
A one-step synthesis of gold nanotriangles in a mixed AOT/phospholipon vesicle phase in the presence of different reducing components with size-dependent properties was developed.This NT formation process can be suppressed by polycations and enhanced by polyanions. The initiation of the growing process, that leads to the formation of flat nanotriangles, starts at the bilayer interface facing the inside of giant multivesicular vesicles. In the case of the non-adsorbing polyanions and AOT micelles, a combined polyelectrolyte/micelle depletion flocculation process was used for the complete removal of the byproducts. The green colored, highly purified and long time stable (>3 month) dispersions of 10 nm thin nanotriangles used for SERS measurements show an enhancement factor of 2.76 × 10⁴ for the detection of 4-NTP, and will be served as a basis for building blocks for supramolecular stacking structures.
Acknowledgements
We would like to thank Dr Alexey Kopyshev and Prof. Svetlana Santer (University of Potsdam) for the AFM images.References
- M. Tréguer-Delapierre, J. Majimel, S. Mornet, E. Duguet and S. Ravaine, Gold Bull., 2008, 41, 195–207 CrossRef.
- J. Aizpurua, P. Hanarp, D. S. Sutherland, M. Käll, G. W. Bryant and F. J. García de Abajo, Phys. Rev. Lett., 2003, 90, 057401 CrossRef CAS PubMed.
- X. Wang, R. Morea, J. Gonzalo and B. Palpant, Nano Lett., 2015, 15, 2633–2639 CrossRef CAS PubMed.
- A. Corma and H. Garcia, Chem. Soc. Rev., 2008, 19, 2096–2126 RSC.
- G. Schmid and B. Corain, Eur. J. Inorg. Chem., 2003, 17, 3081–3098 CrossRef.
- M. C. Daniel and D. Astruc, Chem. Rev., 2004, 104, 293–346 CrossRef CAS PubMed.
- J. Turkevich, P. C. Stevenson and J. Hillier, Discuss. Faraday Soc., 1951, 11, 55–75 RSC.
- G. Frens, Nature, Phys. Sci., 1973, 241, 20–22 CrossRef CAS.
- A. Rai, A. Singh, A. Ahmad and M. Sastry, Langmuir, 2006, 22, 736–741 CrossRef CAS PubMed.
- M. Kasture, M. Sastry and B. L. V. Prasad, Chem. Phys. Lett., 2010, 484, 271–275 CrossRef CAS.
- R. McCaffrey, H. Long, Y. Jin, A. Sanders, W. Park and W. Zhang, J. Am. Chem. Soc., 2014, 136, 1782–1785 CrossRef CAS PubMed.
- R. W. Scott, O. M. Wilson and R. M. Crooks, J. Phys. Chem. B, 2005, 109, 692–704 CrossRef CAS PubMed.
- C. Note, S. Kosmella and J. Koetz, Colloids Surf., A, 2006, 290, 150–156 CrossRef CAS.
- C. Note, J. Koetz, L. Wattebled and A. Laschewsky, J. Colloid Interface Sci., 2007, 308, 162–169 CrossRef CAS PubMed.
- W. Ding, J. Lin, K. Yao, J. W. Mays, M. Ramanathan and K. Hong, J. Mater. Chem. B, 2013, 1, 4212–4216 RSC.
- N. R. Jana, L. Gearheart and C. J. Murphy, Langmuir, 2001, 17, 6782–6786 CrossRef CAS.
- S. E. Lohse, N. D. Burrows, L. Scarabelli, L. M. Liz-Marzan and C. J. Murphy, Chem. Mater., 2014, 26, 34–43 CrossRef CAS.
- A. Filankembo, S. Giorgio, I. Lisiecki and M. P. Pileni, J. Phys. Chem., 2003, 107, 7492–7500 CrossRef CAS.
- T. H. Ha, H.-J. Koo and B. H. Chung, J. Phys. Chem. C, 2007, 111, 1123–1130 CAS.
- M. R. Langille, M. L. Personick, J. Zhang and C. A. Mirkin, J. Am. Chem. Soc., 2012, 134, 14542–14554 CrossRef CAS PubMed.
- S. Hong, J. A. I. Acapulco Jr, H.-J. Jang, A. S. Kulkarni and S. Park, Bull. Korean Chem. Soc., 2014, 35, 1737–1742 CrossRef CAS.
- K. Park, H. Koerner and R. A. Vaia, Nano Lett., 2010, 10, 1433–1439 CrossRef CAS PubMed.
- L. Scarabelli, M. Coronado-Puchau, J. J. Giner-Casares, J. Langer and L. M. Liz-Marzan, ACS Nano, 2014, 6, 5833–5842 CrossRef PubMed.
- D. Robertson, B. Tiersch, S. Kosmella and J. Koetz, J. Colloid Interface Sci., 2007, 305, 345–351 CrossRef CAS PubMed.
- A. Köth, D. Appelhans, D. Robertson, B. Tiersch and J. Koetz, Soft Matter, 2011, 7, 10581–10584 RSC.
- A. Köth, D. Appelhans, C. Prietzel and J. Koetz, Colloids Surf., A, 2012, 414, 50–56 CrossRef.
- M. Fechner and J. Koetz, Macromol. Chem. Phys., 2011, 212, 2691–2699 CrossRef CAS.
- D. K. Smith and B. A. Korgel, Langmuir, 2008, 24, 644–649 CrossRef CAS PubMed.
- F. Zhang, J. Zhu, H.-Q. An, J.-J. Li and J.-W. Zhao, J. Mater. Chem. C, 2016, 4, 568 RSC.
- N. Schulze, D. Appelhans, B. Tiersch and J. Koetz, Colloids Surf., A, 2014, 457, 326–332 CrossRef CAS.
- C. C. Chen, C. H. Hsu and P. L. Kuo, Langmuir, 2007, 23, 6801–6806 CrossRef CAS PubMed.
- S. Chen and D. L. Charoll, J. Phys. Chem. B, 2004, 108, 5500–5506 CrossRef CAS.
- A. I. Kirkland, D. A. Jefferson, D. G. Duff, P. P. Edwards, I. Gameson, B. F. G. Johnson and D. J. Smith, Proc. R. Soc. London, Ser. A, 1993, 440, 589–609 CrossRef CAS.
- Q. Cui, A. Yashchenok, L. Zhang, L. Lidong, A. Masic, G. Wienskol, H. Möhwald and M. Bargheer, ACS Appl. Mater. Interfaces, 2014, 6, 1999–2002 CAS.
- A. S. D. S. Indrasekara, S. Meyers, S. Shubeita, L. C. Feldman, T. Gustafsson and L. Fabris, Nanoscale, 2014, 6, 8891–8899 RSC.
- B. Xue, D. Wang, J. Zuo, X. Kong, Y. Zhang, X. Liu, L. Tu, Y. Chang, C. Li, F. Wu, Q. Zeng, H. Zhao, H. Zhao and H. Zhang, Nanoscale, 2015, 7, 8048–8057 RSC.
Footnote |
| † Electronic supplementary information (ESI) available. See DOI: 10.1039/c6ra04808k |
| This journal is © The Royal Society of Chemistry 2016 |