Effect of laser irradiation on CO gas detecting response of reduced graphene oxide sensor

R. Karimzadeh* and M. Assar
Department of Physics, ShahidBeheshti University, Evin, Tehran 19839, Iran. E-mail: r_karimzadeh@sbu.ac.ir; Tel: +98-21-299-02779

Received 21st February 2016 , Accepted 21st May 2016

First published on 23rd May 2016


Abstract

The effect of laser irradiation on the performance of a carbon monoxide gas sensor was investigated in this paper. We used a facile fabrication method to make the sensor using a graphene oxide suspension. For this purpose, graphene oxide was prepared, and the sensor was fabricated by drop-casting its suspension onto the interdigital circuit surface. Then, the graphene oxide layer was reduced by an applied DC electric field. The fabricated sensor was evaluated systematically in terms of its response and selectivity toward CO gas molecules. The effect of humidity on the fabricated sensor was also investigated in this work. Post-fabrication modification by a laser beam was successfully employed for the in situ laser induced improvement of the detecting performance of the gas sensor. The electrical conductivity and gas-sensing characteristics of the sensor were studied, and the results demonstrated a strong dependence on the power and wavelength of the laser beam. It is shown that the sensing response of the sample irradiated by laser light is higher and faster than the samples without laser irradiation.

Introduction

The ability to detect chemical gases is very important to several technological applications in quality control, medical diagnosis, public security and domestic safety from explosive gas and other dangerous agents. It therefore deserves efforts to explore new materials to improve the sensitivity of gas sensor performance towards different gases. Among these materials, the graphene family of materials, with a high surface-to-volume ratio, comprises newly discovered and widely investigated gas sensor materials.1–40 In particular, the well-known gas detecting properties of graphene, graphene oxide and reduced graphene oxide have stimulated the development of novel sensors. The first gas sensor produced by graphene was reported by Schedin in 2007.1 They showed that adsorbed molecules of gas changed the charge carrier density of graphene. Yoon et al. used the graphene sheets as a carbon dioxide gas sensor at room temperature.2 Leenaerts et al. studied the adsorption of several gas molecules (H2O, NH3, CO, NO2, and NO) on graphene by density functional theory (DFT).3 According to the theory, it was found that the interaction between perfect graphene and carbon monoxide and nitrogen monoxide molecules is very weak, which means that graphene is not suitable as a chemical sensor of CO and NO. In order to solve this problem, graphene with lattice defects and doping with metal particles were proposed and investigated as alternative methods to improve its gas detecting response. A sensor produced by graphene decorated with metals and conducting polymers could be used for detecting hydrogen molecules.4,5 The adsorption of some gases (O2, CO, NO2, and NH3) on metal-doped graphene (including Cu, Ag, Ti and Au) were investigated by Zhou and his co-worker.6 Also, it has been reported that Al-doped graphene is a high sensitivity sensor for formaldehyde (H2CO).7 However, the high cost of the large production of high-quality graphene is a challenge for the commercialization of graphene based gas sensors.

Reduced graphene oxide materials are attractive for emerging sensor applications, due to their high tunability and unique electrical properties. According to this, reduced graphene oxide material has been introduced as a useful sensor for detecting organic vapors such as acetone, ethanol and methanol.8–11 Hu et al. demonstrated that reduced graphene oxide can used to detect the vapor of dimethyl methylphosphonate (DMMP).12 It has also been shown that reduced graphene oxide can detect NO2 and NH3 gases.13 In another report, it was demonstrated that the resistivity of the reduced graphene oxide sensors increased towards methanol and ammonia (NH3) and decreased towards NO2.14 Hue et al. produced a room temperature NH3 gas sensor based on chemically reduced graphene oxide.15 Moreover, it has been reported that the combination of reduced graphene oxide and polyaniline (PANI) gives rise to positive synergetic effects for NH3 gas sensing.16 The sensing response of a reduced graphene oxide sample was investigated by Dua and his coworkers.17 They reported that reduced graphene oxide can be used to detect Cl2 and NO2. In addition, reduced graphene oxide based sensors were explored for NO2 detection.18–22 Reduced graphene oxide can also be used as a nitric oxide (NO) sensor. Li et al. showed that this material can detect NO gas molecules.23 Reduced graphene oxide is strongly hydrophilic, so it can be used as a humidity sensor. A number of studies have shown that graphene oxide material can also be used for detecting humidity.24,25

Carbon monoxide is a dangerous gas for human health and it can be produced from any faulty vehicle engine and heating or cooking appliance. Even worse, it cannot be detected by human senses. Therefore, it is very important to develop carbon monoxide gas sensors that can instantly monitor the gas. So, the main goal of our present study is to investigate and improve the sensitivity of reduced graphene oxide towards CO gas molecules. Also, to the best of our knowledge, few research reports regard the use of reduced graphene oxide to detect carbon monoxide gas molecules. In addition, our interest in reduced graphene oxide for chemical gas sensing is motivated due to its low production costs and ease of synthesis. For this purpose, we focus on the application of reduced graphene oxide for CO gas sensing and the improvement of the detecting response by laser irradiation. The samples were characterized by transmission electron microscopy, UV-Vis and FTIR spectroscopy. Electrical characterization showed that the reduced graphene oxide was sensitive to CO gas.

Experimental

A graphene oxide suspension was synthesized by the modified Hummers’ method,41 and characterized using a UV-Vis spectrophotometer (PerkinElmer LAMBDA 20), Fourier transform infrared spectroscopy (FTIR, PerkinElmer Spectrum Two) and Raman spectroscopy. Transmission electron microscopy (TEM) was employed to study the morphology of the graphene oxide sheets. By using the suspension, a carbon monoxide gas sensor (see Fig. 1) was fabricated as follows. Firstly, interdigital copper electrodes (IDEs) were fabricated using standard lithography (the electrode width and space are 0.3 and 0.5 mm, respectively). Secondly, graphene oxide was dispersed across the IDEs by positioning a drop of its aqueous solution (1 mg ml−1 in water). Thirdly, the sample was dried at 80 °C for 15 minutes in an ambient environment. At this stage, the electrical conductivity of graphene oxide was not suitable for use in the sensor application. Finally, a 2 V DC voltage was applied to the sensor. Initially, the electrical current was low, while, its value slowly increased with time and after about 1 hour, the current in the sample reached a fixed value between 0.05 and 0.2 mA.
image file: c6ra04618e-f1.tif
Fig. 1 (a) Layout of the IDEs plane. Optical microscope images of the IDEs (b) before and (c) after deposition of the graphene oxide.

The sensing performance of the fabricated reduced graphene oxide sensor was characterized under ambient room temperature. The sample was placed in a chamber with an electrical feedthrough for gas-sensing characterizations. The chamber volume was about 2.0 × 10⁻³ m3. Variations in the electrical conductance of the samples were measured by simultaneously applying a low constant DC voltage of 1.5 V and measuring the change in the current passing through the samples. The sample was exposed periodically to clean air and carbon monoxide mixed with air. A sensing test cycle typically consisted of five successive steps including: (1) exposure of the sample to clean air to record a base value of the sensor conductance, (2) vacuuming the chamber to 0.1 mbar, (3) exposure to the carbon monoxide gas diluted in air to record a detecting signal, (4) vacuuming the chamber again to 0.1 mbar and (5) exposure to clean air to allow sensor recovery. Also, we examined this measurement cycle under irradiation of a continuous wave laser beam at 405, 532 and 635 nm wavelengths. More than 20 devices were tested to confirm the sensing performance.

Results and discussion

Fig. 2(a) is a TEM image of the graphene oxide suspension. The TEM image shows a transparent uniform and smooth sheet of graphene oxide which is wrinkled and scrolled on its edges. The UV-Vis spectrum of the suspensions is shown in Fig. 2(b). The sample solution exhibits a strong π–π* absorption peak at 230 nm and a weak absorption shoulder around 306 nm due to the n–π* transition of the C[double bond, length as m-dash]O bond.42 Further evidence of oxygenated functional groups in graphene oxide and any reduction process was identified by using FTIR spectroscopy.
image file: c6ra04618e-f2.tif
Fig. 2 (a) TEM image and (b) UV-Vis spectrum of the pristine solution of graphene oxide.

Fig. 3 shows the FTIR spectra of the as-dried sample in ambient air at 80 °C for 15 min (sample A) and when a voltage was applied to the sample A (sample B). The spectrum of sample A shows the absorption bands of carboxyl groups (1730 cm−1), epoxy groups (1060 cm−1), O–H vibration (3425 cm−1), C–O vibration (880 and 1170 cm−1), C[double bond, length as m-dash]C (1630 cm−1) and two small peaks corresponding to the CH2 bands (2850 and 2910 cm−1). Compared to the peaks of the sample A, sample B has a similar spectrum but with lower absorption intensities, especially for the peaks at 1060 and 1170 cm−1, which are assigned to the oxygen-containing functional groups. Also, the reappearance of –CH2 groups (2850 and 2920 cm−1) suggests a restoration of the carbon basal planes. Thus, it has been demonstrated that applying a voltage to the dried graphene oxide leads to the partial reduction of the graphene oxide sample.


image file: c6ra04618e-f3.tif
Fig. 3 FTIR spectra of samples A and B.

Graphene oxide is normally electrically insulating at room temperature due to the extensive presence of epoxide, hydroxyl, carbonyl and carboxylic groups on its basal plane and edges (leading to a large amount of sp3-hybridized carbon atoms), although there are regions of unsaturated carbon atoms (sp2-hybridized atoms) which are separated by vast areas of oxidized carbon atoms. The conductivity of the reduced graphene oxide can be increased by increasing the graphitic atoms (sp2-hybridized) by removing the oxygen functional groups and decreasing the distance between the graphitic domains. After applying a DC voltage to the sample for 1 hour, the resistance of the device slightly decreased and reached a stable value, which agrees with the reported results in the literature.43 The graphene oxide and reduced graphene oxide prepared by a DC electric field were further analysed using Raman spectroscopy. Fig. 4 shows the Raman spectra of samples A and B. The peaks corresponding to graphene oxide are identified as the D and G bands at 1350 cm−1 and 1590 cm−1, respectively. From the Raman spectra, the intensity ratio, ID/IG, of sample A is calculated to be 1.10, which is larger than that of sample B (0.83). The intensity ratio of the D band to the G band can be used as an indication of its reduction. It is reported that the reduction of graphene oxide leads to a decrease in the intensity ratio (ID/IG). So, it can be confirmed that the DC electric field reduced the graphene oxide sample.


image file: c6ra04618e-f4.tif
Fig. 4 Raman spectra of samples A and B.

The reduction level of the sample can be controlled by tuning the applied voltage or changing the reduction time. We have measured the reduction dependent IV characteristics of the device sensor for different reduction levels, which are obtained by using different reduction times or applied voltages (see Fig. 5). In this figure, it is observed that all IV curves pass through the origin. Also, the IV curves show that the resistance of the reduced graphene oxide samples decreases with the increased reduction level, which is indicated by the changes to the slope of the IV curves.


image file: c6ra04618e-f5.tif
Fig. 5 IV characteristics of the reduced graphene oxide sample at different reduction levels. Different reduction levels as a function of (a) reduction time and (b) magnitude of applied DC voltage.

The reduced sample, containing many dangling bonds which act as binding sites for gas analytes, can be used as gas sensing materials. The performance of the fabricated reduced graphene oxide gas sensor is evaluated by measuring the change in its electrical conductivity upon exposure to different concentrations of CO gas, as shown in Fig. 6. The concentration of the CO gas in air is varied from 50 to 500 ppm. It can be seen that the sensing response increased upon increasing the carbon monoxide concentration. The dependence of the response on carbon monoxide concentration can be explained, as a high concentration of the target gas allows more molecules to be absorbed on the reduced graphene oxide surface per unit time, therefore increasing the sensing response. In the experimental results presented in Fig. 6, the measured sensing curve exhibits many irregular small fluctuation noises. In order to find the root-mean-square (RMS) noise, the variations in the relative conductance change due to the random system noise were measured using the root-mean-square deviation.44 The RMS noise fluctuation was found to be in the range of ±0.006 mA. The lowest detectable concentration of a measured gas is limited by the sensor noise. According to the IUPAC definition, the sensor detection limit is the smallest concentration of the sensing gas that has a signal significantly larger than the noise (signal-to-noise ratio of at least 3).


image file: c6ra04618e-f6.tif
Fig. 6 Sensing response of the graphene oxide sensor to 50, 100, 300 and 500 ppm of CO gas.

The selectivity, as one of the influencing factors in the evaluation of the fabricated sensor, has also been investigated in Fig. 7. The reduced graphene oxide-based sensors were used to selectively detect CO gas from mixtures with one of the four different gases of Ar, N2, CO2 and NH3. It is observed that the sensitivity of the sensor for Ar and N2 is very low. In addition, the results indicate that the CO2 or NH3 background had some sensitivity but CO was more effective in changing the resistance of the reduced graphene oxide sensor.


image file: c6ra04618e-f7.tif
Fig. 7 Electric current changes of the reduced graphene oxide sensor when exposed to carbon monoxide gas in the presence of one of the four other gases of Ar, N2, CO2 and NH3.

Humidity interference is another important factor in detecting the response of the sensor. Therefore, the influence of humidity on the sensing response of the reduced graphene oxide based sensor was also investigated. For this reason, the gas detection behavior was measured in both dry and relatively high humid (about 40%) atmospheres. Fig. 8 shows the effect of humidity on the conductance response of the sensor. It is observed that the electrical conductance of the sample increases during the sensing of carbon monoxide in both dry and humid atmosphere. As shown in this figure, it can be seen that the conductance response of the reduced graphene oxide sensor decreased in the humid atmosphere. One also observes that the presence of humidity decreases the gas sensing signal. Moreover, after 12 hours in the humid environment, the sensor response is stable, however, the magnitude of the electric current and detecting response of the sensor decreased. After the completion of the humid treatment, the conductance of the humid treated sample changed with time. The value of the electrical conductivity of the sample increased with the elapsed time. It was observed that the electrical current of the sensor increased obviously, and after about 3 days, the current and sensitivity of the sensor nearly reached the values before the humidity treatment. This phenomenon could be due to the desorption of water molecules and restoration of the sp2 region of the reduced graphene oxide samples. A brief analysis of the obtained results indicates that the reduced graphene oxide is a really promising material for carbon monoxide gas sensor application. However, similarly to other sensing materials and techniques,45 the reduced graphene oxide sensor has disadvantages as well (see Table 1).


image file: c6ra04618e-f8.tif
Fig. 8 The effect of humidity on the sensing response of the reduced graphene oxide sensor.
Table 1 Advantages and disadvantages of some gas sensing methods
Materials Example Advantages Disadvantages
Metal oxide semiconductor ZnO Long lifetime Low sensitivity
SnO2 Low cost Poor selectivity
  Wide range of target gases High power consumption factor
  Ability to be miniaturized Sensitive to environmental factors
  Portability
Polymer Conducting polymer–polypyrrole Low cost Low sensitivity
Nafion solid polymer electrolyte Ability to be miniaturized Poor selectivity
Portability
Optical methods Fibre optics High sensitivity Inability to be miniaturized
Interferometer High selectivity High cost
Spectroscopy Long lifetime Unportable
Insensitive to environmental factors
Gas chromatograph   High sensitivity High cost
High selectivity Inability to be miniaturized
Unportable
Acoustic methods Surface acoustic wave gas sensor Long lifetime Low sensitivity
Sensitive to environmental factors
Inability to be miniaturized
Reduced graphene oxide   High sensitivity Sensitive to environmental factors
Normal selectivity
Large surface to volume ratio
Low cost
Ability to be miniaturized
Portability


In order to investigate the effect of laser illumination on the detecting response of the sensor, a set of detecting measurements were carried out. In these experiments, the sensor was periodically exposed to ambient air to obtain a base value of the sensor resistance (step 1) and interrupted by 0.1 mbar vacuum (step 2), exposed to carbon monoxide diluted in air (step 3) to record a sensing signal, vacuumed (step 4) and purged by ambient air again (step 5) to recover the device (the measurement time for each step is 10 min). The typical dynamic response of the samples (current versus time) in ambient room temperature is shown in Fig. 9. As indicated in this figure, the conductivity of the sample increased very rapidly by decreasing the chamber pressure to about 0.1 mbar and became stable after approximately 40 min. This can be due to the removed loosely trapped functional groups from the surface of the reduced graphene oxide sample. Upon the introduction of carbon monoxide gas diluted in air, the sensor resistance went up (the conductance of the sensor in the gas mixed with air was lower than its value in vacuum conditions, but larger than its value in a pure air atmosphere). When the gas exposure (CO gas diluted in air) was started, the current passing through the device decreased, possibly because the adsorption of air molecules can lower the hole concentration with respect to the vacuum in reduced graphene oxide. By turning off the carbon monoxide flow and vacuuming the chamber to the pressure of 0.1 mbar, the sample resistivity decreased again. When the sample was re-exposed to the air, the device re-established its resistance in about 20 min. The repeatability of the response of the samples was tested by replicating the measurements. The sensing response was further characterized as a function of chamber pressure. To study the effect of pressure on the response, the sensing behavior of this sensor was measured under different chamber pressures (step 3). For this purpose, the pressure of the chamber in the presence of the carbon monoxide gas diluted in air decreased from 1 bar to 0.01 bar. Fig. 10 indicates that an electric current of 0.26 mA corresponds to a mixed CO and air with a pressure of 1 bar, while the electrical current increases to about 0.29 mA when the pressure inside the chamber is decreased to 0.01 bars. Fig. 10 shows that the minimum value of the electric current of the sensor in the presence of CO gas diluted in air increases upon decreasing the chamber pressure. As a result, the gas sensing mechanism can be described as an adsorption/desorption process of the target gas and oxygen groups on the surface of the reduced graphene oxide. The removal of the oxygen groups leads to an increase in the free carriers. If the reduced graphene oxide is exposed to the carbon monoxide gas, surface reactions will cause a lower surface coverage of oxygen adsorbates. During this process, the electrons return to the carbon, leading to an increase in the conductance of the sensor.


image file: c6ra04618e-f9.tif
Fig. 9 Gas sensing response and recovery of the graphene oxide sensor.

image file: c6ra04618e-f10.tif
Fig. 10 The CO gas sensing response of the sample in different chamber pressures.

Sensor devices with as-deposited reduced graphene oxide sheets showed sensing responses to CO gas, indicating a change in the electrical transport properties of the non-irradiated reduced graphene oxide. The effect of continuous laser irradiation on the sensing response of the sensor to the carbon monoxide gas was examined at room temperature. Fig. 11 compares the conductance of a reduced graphene oxide device without and with laser beam irradiation. As shown in this figure, the electrical conductivity of the reduced graphene oxide increased by irradiating the 60 mW laser beam at 532 nm laser wavelength. During the laser irradiation, the sensor device became highly responsive to the CO gas. The probable cause of such increased sensitivity may be attributed to the creation of dangling bonds during laser treatment, which possibly serve as adsorption sites for gaseous molecules. It is reported that the UV irradiation is very effective in reducing graphene oxide nanosheets, while the degree of reduction induced by visible light is low.46 This reported result demonstrates that visible irradiation is not effective in reducing these nanosheets. In addition, it is important to note that in the case of the low power CW laser irradiation, the beam is absorbed by the sample and immediately induced temperature changes due to photothermal conversion. So, the change in the conductivity appears with laser irradiation, which is presumably owing to the evaporation of adsorbed water and the decomposition of some residual oxygen-containing groups due to laser heating.47 In addition, it had a faster response when exposed to carbon monoxide, as evidenced by a steeper slope upon exposure to carbon monoxide. This accelerated response is likely due to the removal of oxygen groups during laser irradiation. However, the sensor recovery after laser irradiation became slower because the device did not return to its initial conductance after 10 min exposure to air (recovery is complete after 30 min), whereas full recovery was achieved under the same conditions without laser irradiation. The results suggested that the electrical conductivity and sensing response of the samples could be improved by laser irradiation.


image file: c6ra04618e-f11.tif
Fig. 11 The sensing response of the sample without and with laser irradiation.

The suggested mechanism can be confirmed by measuring the effect of operating temperature on the sensing response of the device sample. The effect of the operating temperature on the performance of the fabricated sensor is studied by changing the temperature from 30 °C to 90 °C. Fig. 12 shows the effect of temperature on the carbon monoxide sensing response of the device. A decrease in reduced graphene oxide electrical resistance can be noticed with a temperature increase. It is interesting to note that the sensing response of the sensor device is also increased by increasing the environmental temperature. As is reported in the literature, the primary desorption products of reduced graphene oxide materials for temperatures up to 100 °C are OH groups and water molecules.48 So, the increase of the operating temperature of the sensor causes the increase of desorption of the adsorbed water molecules and OH groups. Therefore, the resistance and the sensing response of the reduced graphene oxide device are related to the operating temperature.


image file: c6ra04618e-f12.tif
Fig. 12 Sensing signal strength of the reduced graphene oxide sensor at different operating temperatures.

The laser irradiation influenced the reduced graphene oxide sensors by increasing its conductance. Also, the sensing signal strength (proportional to the spike height) of the device was increased. The sensing response, S, of a gas sensor was defined as:

 
image file: c6ra04618e-t1.tif(1)
where Ga is the conductance of the sensor in ambient air and Gg is the conductance of the sensor in carbon monoxide gas diluted in air. Fig. 13(a) shows the sensing response and recovery characteristics of the samples before and after laser irradiation at wavelength of 405, 532 and 635 nm (denoted as samples C, D and E, respectively). For this purpose, the measurement cycle (the measurement time interval of each step is 5 min) is regularly performed in the absence and presence of 405, 532 and 635 nm laser irradiation. The power and the radius of the laser beam at the sample position were set as 50 mW and 5 mm, respectively. It is shown that the sensitivity increased by about 25%, 50% and 70% with 405, 532 and 635 nm laser irradiations, respectively. With the laser irradiation at 635 nm, the device showed a sensitivity of 0.39 to the target gas, which was higher than that after laser irradiation at 405 (0.29) and 532 nm (0.35) wavelengths. Better response with slower recovery is obtained under 635 nm laser irradiation. This can be explained by the fact that the absorption of 405 nm laser irradiation by the O–H band of water molecules is much weaker than the absorption at the longer wavelengths of 532 and 635 nm.49 So, the desorption of O–H groups from the reduced graphene oxide sensor by 635 nm laser irradiation is stronger than for the other wavelengths of 532 and 405 nm. The longer excitation wavelength of 635 nm is very good for heating the O–H groups of the reduced graphene oxide surface. This indicates that the 635 nm irradiation is more efficient for obtaining rapid photothermal energy conversion by the sample. After stopping the laser illumination, the sensor returned to its initial state and, therefore, exhibited no permanent deformation. Further changes in the functional groups of the reduced graphene oxide by laser irradiation can be identified by using FTIR spectroscopy. As observed in Fig. 13(b), the FTIR spectra of samples C, D and E show the little change in FTIR peaks compared to sample B due to the laser irradiation. So, the sensor sample before and after laser irradiation is the same, as confirmed by the recovery of the sensor after laser irradiation. The results suggested that the sensing response of reduced graphene oxide could be enhanced by the laser irradiation with optimum laser wavelength.


image file: c6ra04618e-f13.tif
Fig. 13 (a) Sensing response of the graphene oxide sensor in the presence of laser irradiation at 405, 532 and 635 nm wavelengths. (b) Comparison of FTIR spectra of samples B, C, D and E.

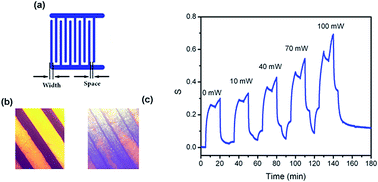
The conductance of the reduced graphene oxide sensors varies depending on the laser power as well as the laser wavelength. The sensing signal strength is related to the power of the laser, as it increased with increasing laser power. Fig. 14(a) shows the cycles of sensing response of the sample in the presence of laser light with different powers. The time intervals between each step are 5 minutes. As shown in this figure, the sensing responses of the reduced graphene oxide sensor increased upon increasing the laser power, and the sensitivity reached the maximum response at 100 mW. Fig. 14(b) compares the relationship between the sensing responses in air (●), the first vacuum (▲), CO gas (■) and the second vacuum (★) conditions of the device versus the power of 532 nm laser beams. Assuming a relationship between the sample conductance and the laser power, the sensitivity changes linearly with the power of the laser beam. It is observed that the sensing response of the reduced graphene oxide to the CO gas shows a 0.3% increment for each 1 mW laser power, and the sensitivity of the device increased by a factor of 2 in the presence of the 100 mW laser beam irradiation. The dependence of the response on laser power can be explained, as laser irradiation provides more oxygen atoms to be removed from the surface, and therefore the response increases.


image file: c6ra04618e-f14.tif
Fig. 14 (a) The sensing response of the sample at different laser powers of 0, 10, 40, 70 and 100 mW. (b) The maximum sensing response of the sample (in air, first vacuum, CO gas and second vacuum conditions) as a function of laser power.

Conclusions

In this work, it was demonstrated that reduced graphene oxide can be used as a promising active material for CO gas sensing. For this purpose, the electrical conductivity and sensing properties of the sensor were studied. Laser irradiation at different wavelengths and power was also used to optimize the sensor response as a combination of faster and higher response magnitude and smaller recovery times. Our results clearly demonstrate that the sensing response of the sample was affected by both the wavelength and power of the laser beam. The reduced graphene oxide sensor exhibits a stronger sensing response to the CO gas in the presence of the 635 nm laser wavelength, rather than 405 and 532 nm laser wavelengths. It is observed that the response of the sensor to the CO gas increased by a factor of 2 in the presence of 100 mW laser beam irradiation. The successive laser improvement reveals the evolution of the conductance of reduced graphene oxide under various laser irradiation conditions, which is instrumental in producing different devices.

References

  1. F. Schedin, A. K. Geim, S. V. Morozov, E. W. Hill, P. Blake, M. I. Katsnelson and K. S. Novoselov, Nat. Mater., 2007, 6, 652–655 CrossRef CAS PubMed.
  2. H. Yoon, D. H. Jun, J. H. Yang, Z. Zhou, S. S. Yang and M. M.-C. Cheng, Sens. Actuators, B, 2011, 157, 310–313 CrossRef CAS.
  3. O. Leenaerts, B. Partones and F. M. Peeters, Phys. Rev. B: Condens. Matter Mater. Phys., 2008, 77, 125416 CrossRef.
  4. M. G. Chung, D.-H. Kim, D. K. Seo, T. Kim, H. U. Im, H. M. Lee, J.-B. Yoo, S.-H. Hong, T. J. Kang and Y. H. Kim, Sens. Actuators, B, 2012, 169, 387–392 CrossRef CAS.
  5. L. Al-Mashat, K. Shin, K. Kalantar-zadeh, J. D. Plessis, S. H. Han, R. W. Kojima, R. B. Kaner, D. Li, X. Gou, S. J. Ippolito and W. Wlodarski, J. Phys. Chem. C, 2010, 114, 16168–16173 CAS.
  6. M. Zhou, Y. Lu, Y. Q. Cai, C. Zhang and Y. P. Feng, Nanotechnology, 2011, 22, 385502 CrossRef PubMed.
  7. M. Chi and Y. P. Zhao, Comput. Mater. Sci., 2009, 46, 1085–1090 CrossRef CAS.
  8. C. E. Kehayias, S. MacNaughton, S. Sonkusale and C. Staii, Nanotechnology, 2013, 24, 245502 CrossRef PubMed.
  9. S. Konwer, A. K. Guha and S. K. Dolui, J. Mater. Sci., 2013, 48, 1729–1739 CrossRef CAS.
  10. F. Liu, X. Chu, Y. Dong, W. Zhang, W. Sun and L. Shen, Sens. Actuators, B, 2013, 188, 469–474 CrossRef CAS.
  11. Y. Chang, Y. Yao, B. Wang, H. Luo, T. Li and L. Zhi, J. Mater. Sci. Technol., 2013, 29, 157–160 CAS.
  12. N. Hu, Y. Wang, J. Chai, R. Gao, Z. Yang, E. S.-W. Kong and Y. Zhang, Sens. Actuators, B, 2012, 163, 107–114 CrossRef CAS.
  13. J. D. Fowler, M. J. Allen, V. C. Tung, Y. Yang, R. B. Kaner and B. H. Weiller, ACS Nano, 2009, 3, 301–306 CrossRef CAS PubMed.
  14. N. Chen, X. Li, X. Wang, J. Yu, J. Wang, Z. Tang and S. A. Akbar, Sens. Actuators, B, 2013, 188, 902–908 CrossRef CAS.
  15. N. Hu, Z. Yang, Y. Wang, L. Zhang, Y. Wang, X. Huang, H. Wei, L. Wei and Y. Zhang, Nanotechnology, 2014, 25, 025502 CrossRef PubMed.
  16. X. Huang, N. Hu, R. Gao, Y. Yu, Y. Wang, Z. Yang, E. S.-W. Kong, H. Wei and Y. Zhang, J. Mater. Chem., 2012, 22, 22488–22495 RSC.
  17. V. Dua, S. P. Surwade, S. Ammu, S. R. Agnihotra, S. Jain, K. E. Roberts, S. Park, R. S. Ruoff and S. K. Manohar, Angew. Chem., 2010, 122, 2200–2203 CrossRef.
  18. M. G. Chung, D. H. Kim, H. M. Lee, T. Kim, J. H. Choi, D. K. Seo, J.-B. Yoo, S.-H. Hong, T. J. Kang and Y. H. Kim, Sens. Actuators, B, 2012, 166–167, 172–176 CrossRef CAS.
  19. R. Pearce, T. Iakimov, M. Andersson, L. Hultman, A. L. Spetz and R. Yakimova, Sens. Actuators, B, 2011, 155, 451–455 CrossRef CAS.
  20. S. Prezioso, F. Perrozzi, L. Giancaterini, C. Cantalini, E. Treossi, V. Palermo, M. Nardone, A. Santucci and L. Ottaviano, J. Phys. Chem. C, 2013, 117, 10683–10690 CAS.
  21. S. Cui, H. Pu, E. C. Mattson, Z. Wen, J. Chang, Y. Hou, C. J. Hirschmugl and J. Chen, Anal. Chem., 2014, 86, 7516–7522 CrossRef CAS PubMed.
  22. W. Yuan, A. Liu, L. Huang, C. Li and G. Shi, Adv. Mater., 2013, 25, 766–771 CrossRef CAS PubMed.
  23. W. Li, X. Geng, Y. Guo, J. Rong, Y. Gong, L. Wu, X. Zhang, P. Li, J. Xu, G. Cheng, M. Sun and L. Liu, ACS Nano, 2011, 5, 6955–6961 CrossRef CAS PubMed.
  24. L. Guo, H.-B. Jiang, R.-Q. Shao, Y.-L. Zhang, S.-Y. Xie, J.-N. Wang, X.-B. Li, F. Jiang, Q.-D. Chen, T. Zhang and H.-B. Sun, Carbon, 2012, 50, 1667–1673 CrossRef CAS.
  25. I. Jung, D. Dikin, S. Park, W. Cai, S. L. Mielke and R. S. Ruoff, J. Phys. Chem. C, 2008, 112, 20264–20268 CAS.
  26. J. T. Robinson, F. K. Perkins, E. S. Snow, Z. Wei and P. E. Sheehan, Nano Lett., 2008, 8, 3137–3140 CrossRef CAS PubMed.
  27. J. D. Fowler, M. Allen, V. C. Tung, Y. Yang, R. Kaner and B. H. Weiller, ACS Nano, 2009, 3, 301–306 CrossRef CAS PubMed.
  28. T. H. Han, Y.-K. Huang, A. T. L Tan, V. P. Dravid and J. Huang, J. Am. Chem. Soc., 2011, 133, 15264–15267 CrossRef CAS PubMed.
  29. Z. Zhang, R. Zou, G. Song, L. Yu, Z. Chen and J. Hu, J. Mater. Chem., 2011, 21, 17360–17365 RSC.
  30. G. Lu, L. E. Ocola and J. Chen, Nanotechnology, 2009, 20, 445502 CrossRef PubMed.
  31. G. Lu, S. Park, K. Yu, R. S. Ruoff, L. E. Ocola, D. Rosenmann and J. Chen, ACS Nano, 2011, 5, 1154–1164 CrossRef CAS PubMed.
  32. Y. Zhou, G. Z. Xie, T. Xie, H. Yuan, H. L. Tai, Y. D. Jiang and Z. A. Chen, Appl. Phys. Lett., 2014, 105, 033502 CrossRef.
  33. S. Basu and P. Bhattacharyya, Sens. Actuators, B, 2012, 173, 1–21 CrossRef CAS.
  34. K. Toda, R. Furue and S. Hayami, Anal. Chim. Acta, 2015, 878, 43–53 CrossRef CAS PubMed.
  35. Y. Zhou, Y. Jiang, T. Xie, H. Tai and G. A. Xie, Sens. Actuators, B, 2014, 203, 135–142 CrossRef CAS.
  36. Z. Bo, X. Shuai, S. Mao, H. Yang, J. Qian, J. Chen, J. Yan and K. Cen, Sci. Rep., 2014, 4, 4684 Search PubMed.
  37. S. Mao, S. Cui, G. Lu, K. Yu, Z. Wen and J. Chen, J. Mater. Chem., 2012, 22, 11009–11013 RSC.
  38. S. Mao, G. Lu and J. Chen, J. Mater. Chem. A, 2014, 2, 5573–5579 CAS.
  39. M. Shaik, V. K. Rao, M. Gupta, K. S. R. CMurthy and R. Jain, RSC Adv., 2016, 6, 1527–1534 RSC.
  40. D. Zhang, A. Liu, H. Chang and B. Xia, RSC Adv., 2015, 5, 3016–3022 RSC.
  41. H. A. Becerril, J. Mao, Z. F. Liu, R. M. Stoltenberg, Z. N. Bao and Y. S. Chen, ACS Nano, 2008, 2, 463–470 CrossRef CAS PubMed.
  42. J. I. Paredes, S. Villar-Rodil, A. Martinez-Alonso and J. M. D. Tascon, Langmuir, 2008, 24, 10560–10564 CrossRef CAS PubMed.
  43. Y. Guo, B. Wu, H. Liu, Y. Ma, Y. Yang, J. Zheng, G. Yu and Y. Liu, Adv. Mater., 2011, 23, 4626–4630 CrossRef CAS PubMed.
  44. H. Martins and T. Naes, MultiVariate Calibration, Wiley & Sons, New York, 1998 Search PubMed.
  45. X. Liu, S. Cheng, H. Liu, S. Hu, D. Zhang and H. Ning, Sensors, 2012, 12, 9635–9665 CrossRef PubMed.
  46. Y. Matsumoto, M. Koinuma, S. Y. Kim, Y. Watanabe, T. Taniguchi, K. Hatakeyama, H. Tateishi and S. Ida, ACS Appl. Mater. Interfaces, 2010, 2, 3461–3466 CAS.
  47. H. Chen, M. B. Müller, K. J. Gilmore, G. G. Wallace and D. Li, Adv. Mater., 2008, 20, 3557–3561 CrossRef CAS.
  48. Y. Zhu, M. D. Stoller, W. Cai, A. Velamakanni, R. D. Piner, D. Chen and R. S. Ruoff, ACS Nano, 2010, 4, 1227–1233 CrossRef CAS PubMed.
  49. R. M. Pope and E. S. Fry, Appl. Opt., 1997, 36, 8710–8723 CrossRef CAS PubMed.

This journal is © The Royal Society of Chemistry 2016
Click here to see how this site uses Cookies. View our privacy policy here.