DOI:
10.1039/C6RA04595B
(Paper)
RSC Adv., 2016,
6, 37195-37202
Microheterogeneity in binary mixtures of methanol with aliphatic alcohols: ATR-IR/NIR spectroscopic, chemometrics and DFT studies
Received
20th February 2016
, Accepted 5th April 2016
First published on 8th April 2016
Introduction
It is well known that alcohol-water mixtures reveal non-ideal behavior due to the presence of hydrophobic interactions disturbing the structure of liquid water.1–6 As a result, the molecules of water and alcohol form separate clusters predominantly composed of one constituent of the mixture. This behavior is not surprising since, in contrast to the molecules of alcohol, the molecules of water do not posses the hydrophobic part. Inhomogeneous distribution was also found in the binary mixture of methanol with acetone.7–9 Musso et al. reported the presence of microscopic inhomogeneities in this mixture through the Raman noncoincidence effect.7 The authors speculate that this effect originates from hydrogen-bonding between molecules of methanol. Analysis of vibrational and NMR spectra of methanol/acetone mixture led Idrissi et al. to the conclusion that the molecules of acetone are not homogeneously distributed between the acetone mole fraction from 0.05 to 0.55.8 At higher mole fraction of acetone (from 0.55 to 1) the molecules of methanol are inhomogeneously distributed, but the extent of this effect is smaller than that for acetone. Theoretical calculations by Kollipost et al. have shown that the heterodimers and heterotrimers of methanol and acetone are more favorable than the corresponding homoclusters.9 In contrast, pure tetramers and higher homoclusters are more stable than the mixed clusters. Tan et al. have demonstrated that the relative terahertz absorption coefficients of the diol/methanol binary mixtures are close to zero.10 On this basis the authors concluded that these mixtures can be considered ideal.
When two solvents with similar structure and properties are mixed with each other, one can expect behavior close to the ideal. Ortega et al. suggested that this behavior should be observed for the mixtures which do not present preferential solvation.11 The composition dependence of the solvatochromic parameters for mixtures of methanol with the most similar alcohols (including ethanol) suggests ideal behavior.11 Thus, it was surprising when Mello et al. reported the microstructures formation in a seemingly ideal homogeneous mixture of methanol and ethanol.12 The authors claim that methanol and ethanol molecules form separate clusters at a molecular level and the distinct clusters interact weakly through cohesion or dispersion forces. For the first time it was reported heterogeneity at a molecular level in a non-aqueous mixture of very similar compounds. So far this is the only report on microheterogeneity in binary mixture of methanol and ethanol, but Mello et al. speculate that analogous phenomenon should be observed in other mixtures of alcohols.12
Inspired by this work we undertook more detailed and comprehensive studies of the microheterogeneity in binary mixtures of alcohols. The first purpose of this study is to verify the finding by Mello et al.12 Next, we examine if this effect occurs for other mixtures of alcohols. Finally, we elucidate the relationship between the molecular structure of the alcohol and the extent of the microheterogeneity in binary mixtures of alcohols. To realize these aims we performed ATR-IR and NIR spectroscopic studies on binary mixtures of methanol with five aliphatic alcohols of different size and structure of the chain. The size of these alcohols was relatively small to enable theoretical modeling of larger clusters. The inhomogeneity distribution of molecules in the mixtures was characterized by MIR/NIR excess absorption spectra,13,14 two-dimensional (2D) correlation analysis,15–17 and chemometric methods like principal component analysis (PCA),18 evolving factor analysis (EFA)19 and multivariate curve resolution (MCR).20,21 In particular, the excess absorption spectra and 2D correlation analysis are very sensitive tools in detection of small deviations from the linearity. Besides, we proposed semi-quantitative parameters related to the degree of deviation from the ideality. These parameters were calculated from the MIR/NIR excess absorption and 2D correlation spectra. The experimental results were compared and discussed with the theoretical calculations (DFT) of numerous model structures including homo- and heteroclusters of different size and composition.
Experimental
We studied binary mixtures of methanol (ME) with five aliphatic alcohols: ethanol (ET), 1-propanol (1PA), 2-propanol (2PA), tert-butanol (TB) and cyclopentanol (CP). Alcohols of high purity (>99%) were purchased from Aldrich Chemical Co. (Germany), J. T. Baker (The Netherlands), Fluka (Germany) and POCH (Poland). All samples were distilled and dried under freshly activated molecular sieves (4A). ATR-IR and FT-NIR spectra were recorded at a resolution of 2 cm−1 and 4 cm−1 (256 scans), respectively, on Nicolet Magna 860 spectrometer with DTGS detector. ATR-IR spectra were recorded with multi-reflection ZnSe crystal (PIKE), while NIR spectra were measured in a variable temperature quartz cell (Hellma) of 5 mm thickness. The spectral measurements were performed at 25 °C, only ME/TB mixture was measured at 30 °C (melting point of TB is ≈26 °C). The spectra of all mixtures were recorded in the entire range of mole fractions (X) with a step of 0.04 ± 0.0001. The samples were automatically prepared and dosed to ATR-IR and NIR cells by a special flow-system designed and developed in our laboratory. This way, the spectral measurements were more precise and reliable. These features are especially important in detection of small fluctuations of spectral intensity.
Data analysis
The baseline fluctuations were minimized by an offset at 4000 cm−1 (ATR-IR) or 9000 cm−1 (NIR), and no other corrections were made on the spectra. The generalized 2D correlation spectra were calculated according to Noda's algorithm,15,16 using Matlab 7.0.4 (The Math Works Inc.) based software17 and an average spectrum was used as a reference. The asynchronous intensity was multiplied (array multiplication) by corresponding synchronous intensity. The rules for interpretation of 2D correlation spectra were reported elsewhere.15–17 The number of species present in the data set and the initial estimates of the concentration profiles for each of the component were obtained from PCA and EFA.18,19 The actual concentration and spectral profiles of the pure components were resolved by multivariate curve resolution-alternating least squares (MCR-ALS) approach with constraints (non-negativity on concentrations and spectra, closure, equality).20,21 The chemometric analysis was performed by PLS-Toolbox 6.2 (Eigenvector Research Inc.) for use with Matlab.
The spectrum of the ideal binary mixture (Aid) was calculated as follows:
| | | Aid = A1 × X1 + A2 × (1 – X1) | (1) |
where
A1 and
A2 are the MIR/NIR spectra of neat alcohols and
X1 is the mole fraction corresponding to
A1. Next, we calculated the excess MIR/NIR absorption spectra (
Aexc) as a difference between the real spectra (
A) and the
Aid spectra:
The excess spectrum reveals deviations of the mixture from the ideality. If the mixture is close to the ideal one, the intensities in the excess spectrum are near to zero, while appearance of significant positive or negative values indicates the non-ideal behavior.
Theoretical calculations
DFT calculations were performed at the B3LYP/6-311++G(d,p) level of theory using Gaussian 03W.22 The total energy of each structure was corrected with the zero point vibrational energy, and the harmonic frequencies were calculated. All stationary points were found to be true minima since no imaginary frequencies were obtained. The DFT calculations were performed in WCSS (Wrocław, grant 163).
Results and discussion
ATR-IR and NIR spectra
ATR-IR and NIR spectra were recorded from 1000 to 4000 cm−1 and from 4000 to 9000 cm−1, respectively. However, for analysis we selected the most important ranges including the fundamentals of the CH/OH stretching vibrations (2700–3800 cm−1) and the corresponding overtones (6000–9000 cm−1). In Fig. 1 and 2 are shown exemplary MIR and NIR spectra of ME/ET and ME/TB mixtures in the entire range of mole fractions. The broad spectral feature absorbing from 3100 to 3600 cm−1 was assigned to the hydrogen-bonded OH, while its first overtone appears in the 6200–7000 cm−1 range. Interestingly, the band due to the free OH is not visible in the fundamentals region. This band is hardly seen near 3615 cm−1 in the second derivative spectra (not shown). In contrast, the free OH clearly appears in the NIR spectra near 7100 cm−1.23 From 2800 to 3000 cm−1 absorbs the bands due to the CH stretching vibrations, while the first overtones absorb from 5750 to 6000 cm−1. In a few mixtures these bands were too intense (A > 2) and hence, this spectral range was excluded from the analysis. Instead, we applied the second overtone of the CH stretching vibrations which is much weaker and absorb from 8200 to 8800 cm−1.
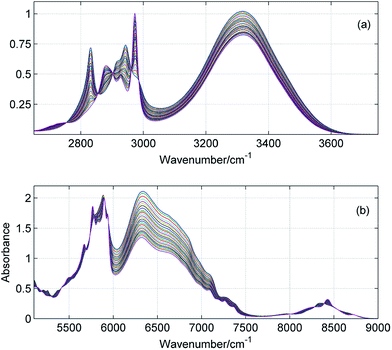 |
| | Fig. 1 ATR-IR (a) and NIR (b) spectra of ME/ET mixture in the entire range of mole fractions with a step of 0.04. | |
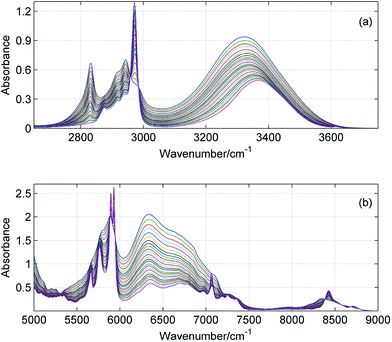 |
| | Fig. 2 ATR-IR (a) and NIR (b) spectra of ME/TB mixture in the entire range of mole fractions with a step of 0.04. | |
Fig. 3 displays selected spectral changes as a function of the mixture composition. It is of note that the intensity of the bonded OH continuously decreases, while position of this band does not change up to XTB = 0.4–0.5. When XTB still further increases this band shifts to higher wavenumbers. From Fig. 3c it results that the population of the free OH groups from TB increases with the increase in XTB. However, this increase is not a linear function of the composition of the mixture. All of these observations demonstrate a complex character of the spectral changes in the mixture.
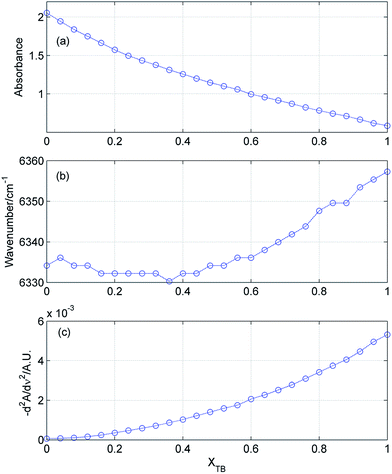 |
| | Fig. 3 Absorbance (a) and position (b) of the bonded OH in ME/TB mixture as a function of TB mole fraction. In (c) is shown absorbance (in second derivative spectrum) of the free OH from TB (at 7067 cm−1). | |
Estimation of the number of components in the mixture
Estimation of the number of distinct species present in the mixture is the first step of the chemometric analysis. In Table 1 are summarized results of PCA, EFA and 2D correlation analysis for all studied mixtures. In most cases the chemometric analysis does not provide a clear-cut answer on the number of components and indicates the presence of two or three components. Only for ME/TB mixture the analysis suggests the existence of four (EFA) or five (PCA/ATR-IR) different species. As mentioned before, 2D correlation analysis is a powerful tool for the resolution enhancement.15–17 The peaks are resolved in the asynchronous spectrum if the perturbation-dependent pattern of spectral changes for the component peaks is different. This suggests that the resolved peaks originate from different molecules or from the same molecule in unlike environments. Fig. 4 shows 2D ATR-IR asynchronous spectra of ME/ET mixture. Obviously, the peaks due to both the methyl (2827/2838) and methylene (2970/2977) groups are resolved into two components. This splitting appears in the asynchronous spectra of all remaining mixtures (not shown). Similar spectral pattern was observed by Mello et al. in the 2D Raman asynchronous spectra of ME/ET mixture.12 From this splitting the authors assumed the presence of separate ME and ET clusters without hydrogen bonding between different alcohol species. It is of note that they excluded the presence of heteroclusters in the mixture. However, we interpret this splitting in a different way. The asynchronous spectra develop a pair of peaks for both alcohols. One peak of each pair can be assigned to the pure component, while the other peak originates from the mixed cluster. The pattern of hetero-peaks between the methyl and methylene groups (Fig. 4) does not reveal additional components. Hence, the double asynchronous peaks for both components of the mixture indicate the presence of three distinct species: two kinds of homoclusters and one kind of heterocluster.
Table 1 Number of components from PCA, EFA, 2D correlation analysis and MCR-ALS for all studied mixtures
| Mixture |
ATR-IR |
NIR |
| PCA |
EFA |
2DCOS |
MCR |
PCA |
EFA |
2DCOS |
MCR |
| ME/ET |
2 |
2 |
3 |
3 |
2 |
3 |
3 |
3 |
| ME/1PA |
3 |
3 |
3 |
3 |
2 |
3 |
3 |
3 |
| ME/2PA |
2 |
3 |
3 |
3 |
3 |
3 |
3 |
3 |
| ME/CP |
2 |
3 |
3 |
3 |
2 |
3 |
3 |
3 |
| ME/TB |
5 |
4 |
3 |
4 |
3 |
4 |
3 |
3 |
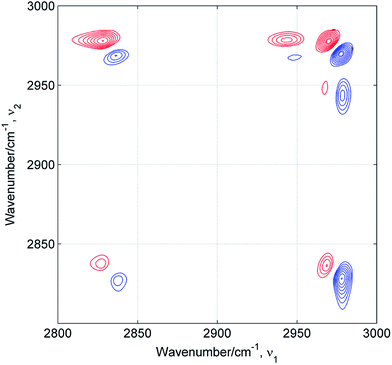 |
| | Fig. 4 2D ATR-IR asynchronous spectra of ME/ET mixture. Positive and negative peaks are drown in red and blue, respectively. | |
Resolution of the concentration and spectral profiles
Fig. 5 and 6 display the concentration and spectral profiles obtained from MCR-ALS of ATR-IR and NIR spectra of ME/ET mixture by using three components. One of the concentration profiles decreases with the increase in XET, while the other profile reveals an opposite behavior. Hence, it seems reasonable to assign these profiles to pure ME and ET, respectively. In Fig. 7 and 8 are compared ATR-IR and NIR spectral profiles of ME and ET with the normalized spectra of bulk ME and ET. A striking similarity between the spectral profiles and the corresponding spectra of bulk alcohols confirms above assignment. Hence, these spectral profiles were assigned to ME and ET contributing to the homoclusters similar to those existing in bulk alcohols. On the other hand, the third component is completely different from the two others and has a maximum near XET ≈ 0.5 (Fig. 5a and 6a). Of particular note is that the spectral profile of this component includes the peaks both from ME and ET (Fig. 5b and 6b). Evidently, this component originates from the heteroclusters, and its composition depends on the actual composition of the mixture. Assuming that the spectral profile of the mixed cluster can be represented as a linear combination of the spectra of pure alcohols (eqn (1)) one can estimate an average contribution from each alcohol to the mixed cluster. By solving eqn (1) we obtained XME = 0.47 and XET = 0.53 from ATR-IR spectra, and XME = XET = 0.50 from NIR spectra. This means that the mixed clusters have an average ME![[thin space (1/6-em)]](https://www.rsc.org/images/entities/char_2009.gif) :
:![[thin space (1/6-em)]](https://www.rsc.org/images/entities/char_2009.gif) ET molar ratio of 1
ET molar ratio of 1![[thin space (1/6-em)]](https://www.rsc.org/images/entities/char_2009.gif) :
:![[thin space (1/6-em)]](https://www.rsc.org/images/entities/char_2009.gif) 1. From Fig. 5a and 6a it is clear that at equimolar mixture nearly 50% molecules of ME and ET form the mixed clusters, while the remaining molecules are involved in the homoclusters. Similar results of MCR-ALS (not shown) were obtained for ME/1PR, ME/2PR and ME/CP mixtures.
1. From Fig. 5a and 6a it is clear that at equimolar mixture nearly 50% molecules of ME and ET form the mixed clusters, while the remaining molecules are involved in the homoclusters. Similar results of MCR-ALS (not shown) were obtained for ME/1PR, ME/2PR and ME/CP mixtures.
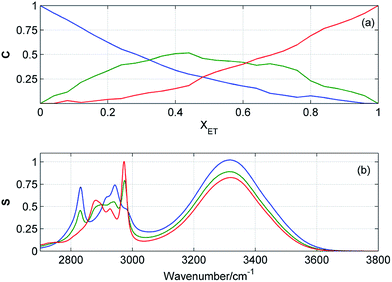 |
| | Fig. 5 Concentration (a) and spectral (b) profiles obtained from MCR-ALS of ATR-IR spectra of ME/ET mixture by using three components. Corresponding concentration and spectral profiles have the same colors. | |
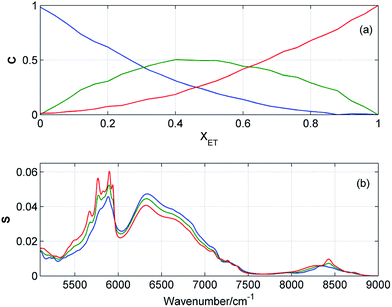 |
| | Fig. 6 Concentration (a) and spectral (b) profiles obtained from MCR-ALS of NIR spectra of ME/ET mixture by using three components. Corresponding concentration and spectral profiles have the same colors. | |
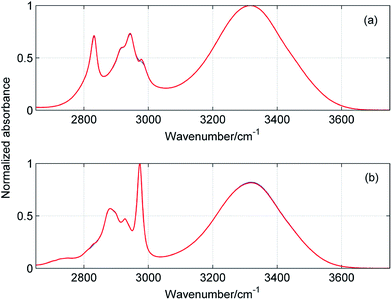 |
| | Fig. 7 Comparison of spectral profiles (blue) obtained from MCR-ALS of ATR-IR spectra of ME/ET mixture with the spectra (red) of pure methanol (a) and ethanol (b). | |
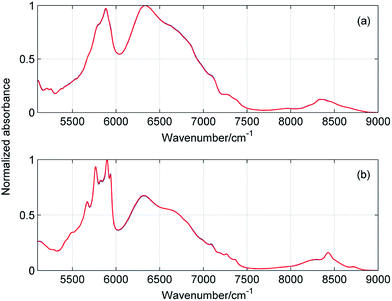 |
| | Fig. 8 Comparison of spectral profiles (blue) obtained from MCR-ALS of NIR spectra of ME/ET mixture with the spectra (red) of pure methanol (a) and ethanol (b). | |
Results of PCA and EFA suggest that in ME/TB mixture exist four or five different kinds of clusters. In spite of many efforts, we were not able to obtain reasonable results of MCR-ALS by using five components. Fig. 9 displays the concentration and spectral profiles of ME/TB mixture from MCR-ALS by using four components. Two of these profiles are assigned to the homoclusters of ME and TB, while the two other profiles originate from the mixed clusters. Solving eqn (1) we estimated an average composition of both heteroclusters. One of these clusters has an average ME![[thin space (1/6-em)]](https://www.rsc.org/images/entities/char_2009.gif) :
:![[thin space (1/6-em)]](https://www.rsc.org/images/entities/char_2009.gif) TB molar ratio of 1
TB molar ratio of 1![[thin space (1/6-em)]](https://www.rsc.org/images/entities/char_2009.gif) :
:![[thin space (1/6-em)]](https://www.rsc.org/images/entities/char_2009.gif) 1, whereas for the second cluster this ratio is between 1
1, whereas for the second cluster this ratio is between 1![[thin space (1/6-em)]](https://www.rsc.org/images/entities/char_2009.gif) :
:![[thin space (1/6-em)]](https://www.rsc.org/images/entities/char_2009.gif) 3 and 1
3 and 1![[thin space (1/6-em)]](https://www.rsc.org/images/entities/char_2009.gif) :
:![[thin space (1/6-em)]](https://www.rsc.org/images/entities/char_2009.gif) 4. The highest population of both heteroclusters reaches 25% and for TB-rich cluster this maximum is shifted to higher XTB. By adding the contributions from these two mixed clusters we obtained the concentration profile (Fig. 9a, dotted brown line) similar to those shown in Fig. 5a and 6a. Like for the other mixtures, at equimolar composition about 50% of molecules are involved in the heteroclusters.
4. The highest population of both heteroclusters reaches 25% and for TB-rich cluster this maximum is shifted to higher XTB. By adding the contributions from these two mixed clusters we obtained the concentration profile (Fig. 9a, dotted brown line) similar to those shown in Fig. 5a and 6a. Like for the other mixtures, at equimolar composition about 50% of molecules are involved in the heteroclusters.
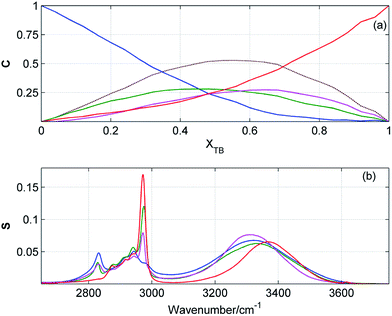 |
| | Fig. 9 Concentration (a) and spectral (b) profiles obtained from MCR-ALS of ATR-IR spectra of ME/TB mixture by using four components. Corresponding concentration and spectral profiles have the same colors. Concentration profile drawn by dashed brawn line is a sum of the green and magenta profiles. | |
Excess absorption spectra
Fig. 10 shows the composition-mean excess ATR-IR and NIR absorption spectra for all studied mixtures. In both spectral ranges the magnitude of the changes is the smallest for ME/ET mixture, while the largest variations are observed for ME/TB mixture. To compare more quantitatively the results obtained for different mixtures, we calculated the value of ER defined as below:| |  | (3) |
where ‘mean’ stands for the composition-mean MIR/NIR excess or normal spectrum. For an ideal mixture ER is expected to be close to zero and this value should significantly depart from zero for non-ideal mixtures. In Table 2 are collected values of ER for all studied mixtures. It is of note that all ER are markedly different from zero. The smallest ER was obtained for ME/ET mixture, while the largest one for ME/TB mixture. This suggests that behavior of ME/ET mixture is the closest to the ideal mixture. It is not surprising since these two alcohols have the most similar structures and properties. Interestingly, ME/TB mixture deviates from the ideality more than ME/CP mixture. Among two isomers of propyl alcohol, mixture of ME with the primary alcohol is more ideal. These results allow us to conclude that the degree of non-ideality increases upon an increase in the chain length and the order of the alcohol. It is of note that this trend is correlated with the degree of self-association of the alcohol.23 Hence, one can conclude that more associated alcohols from more ideal binary mixtures with ME. This observation is in line with the statement of Tan et al. that ME/diol mixtures can be considered ideal.10 NIR spectroscopic studies reveal that the aliphatic diols are more associated than the aliphatic alcohols.17,23
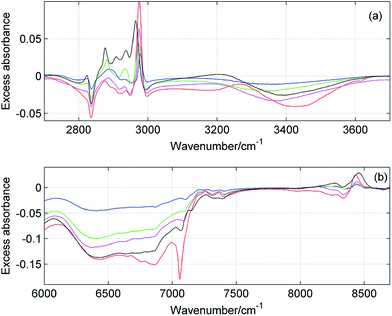 |
| | Fig. 10 Composition-mean excess MIR (a) and NIR (b) absorption spectra of ME/ET (blue), ME/1PA (green), ME/2PA (magenta), ME/CP (black) and ME/TB (red) mixtures. | |
Table 2 Parameters of ER and DA for all studied mixtures
| Mixture |
ATR-IR |
NIR |
| ER |
DA |
ER |
DA |
| ME/ET |
1.5 |
4.9 |
2.7 |
2.3 |
| ME/1PA |
2.9 |
6.8 |
6.5 |
3.9 |
| ME/2PA |
2.6 |
7.2 |
8.2 |
5.9 |
| ME/CP |
3.5 |
7.6 |
10.5 |
7.2 |
| ME/TB |
7.6 |
8.7 |
12.9 |
20.1 |
Based on 2D correlation spectra we proposed another parameter related to the amount of nonlinearity of spectral changes. The degree of asynchronicity (DA) was defined as:
| |  | (4) |
where min and max refer to minimum and maximum intensity at the synchronous (syn) and asynchronous (asyn) spectrum. Higher value of DA indicates the higher non-linearity of spectral changes. An inspection of
Table 2 reveals that this value is well correlated with ER. Again, the smallest DA was obtained for ME/ET mixture, while the largest DA was found for ME/TB mixture.
In order to estimate the composition of the mixtures with the largest deviations from the ideality we examined the excess absorption spectra in detail. In Fig. 11 and 12 are displayed the intensity changes for selected MIR and NIR bands in the excess absorption spectra of ME/ET and ME/TB mixtures, respectively. To guide the eye the data were fitted by a polynomial of the third degree. The analogous changes at different wavenumbers look more or less similar. The largest deviations for ME/ET mixture occur near XET ≈ 0.5–0.55. In the case of ME/TB mixture this value shifts to XTB ≈ 0.55–0.6 (Fig. 12). This small shift from the equimolar composition may results from formation of TB-rich clusters, in addition to the 1![[thin space (1/6-em)]](https://www.rsc.org/images/entities/char_2009.gif) :
:![[thin space (1/6-em)]](https://www.rsc.org/images/entities/char_2009.gif) 1 clusters. Sengawa et al. reported that the maximum negative values of the excess static dielectric constant for ME/ET mixture were observed at mole fraction of X ≈ 0.5.24 Hence, the authors concluded that the interaction between methanol and ethanol is the strongest at equimolar mixture. Since the excess static dielectric constant was negative in the entire range of compositions it was suggested that the number of hydrogen bonds in the mixture is fewer than for the corresponding pure liquids.24 A careful analysis of Fig. 10 led us to quite different conclusions. The negative values of the excess MIR (3200–3600 cm−1) and NIR (6200–7000 cm−1) absorption of the bonded OH reveal that an average population and/or strength of hydrogen bonds decreases on going from the ideal to the real mixture. Yet, in this case we should observe an opposite trend for the free OH. It is of particular note that the peaks due to the free OH are negative as well. This effect is well seen for ME/TB mixture (Fig. 10b, red line), where one can observe a distinct negative peak at 7060 cm−1 from the free OH of TB. These observations allow us to infer that in the mixture increases the population of hydrogen-bonded OH groups as compared with the pure alcohols, but an average strength of these bonds is weaker. The formation of heteroclusters leads to significant reduction in the population of the free OH groups from TB (Fig. 10b). On the other hand, participation of molecules of ME in the mixed clusters decreases an average strength of hydrogen bonds since the ME–TB bonds are weaker than those of ME–ME.
1 clusters. Sengawa et al. reported that the maximum negative values of the excess static dielectric constant for ME/ET mixture were observed at mole fraction of X ≈ 0.5.24 Hence, the authors concluded that the interaction between methanol and ethanol is the strongest at equimolar mixture. Since the excess static dielectric constant was negative in the entire range of compositions it was suggested that the number of hydrogen bonds in the mixture is fewer than for the corresponding pure liquids.24 A careful analysis of Fig. 10 led us to quite different conclusions. The negative values of the excess MIR (3200–3600 cm−1) and NIR (6200–7000 cm−1) absorption of the bonded OH reveal that an average population and/or strength of hydrogen bonds decreases on going from the ideal to the real mixture. Yet, in this case we should observe an opposite trend for the free OH. It is of particular note that the peaks due to the free OH are negative as well. This effect is well seen for ME/TB mixture (Fig. 10b, red line), where one can observe a distinct negative peak at 7060 cm−1 from the free OH of TB. These observations allow us to infer that in the mixture increases the population of hydrogen-bonded OH groups as compared with the pure alcohols, but an average strength of these bonds is weaker. The formation of heteroclusters leads to significant reduction in the population of the free OH groups from TB (Fig. 10b). On the other hand, participation of molecules of ME in the mixed clusters decreases an average strength of hydrogen bonds since the ME–TB bonds are weaker than those of ME–ME.
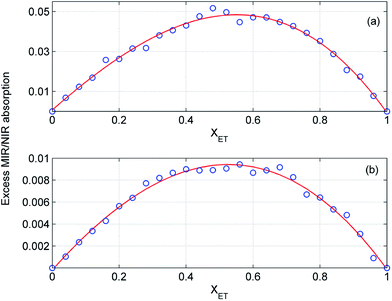 |
| | Fig. 11 Intensity changes at 2978 cm−1 (a) and 8440 cm−1 (b) in the excess absorption spectra of ME/ET mixture. The experimental data (○) were fitted by a polynomial of the third degree (red line). | |
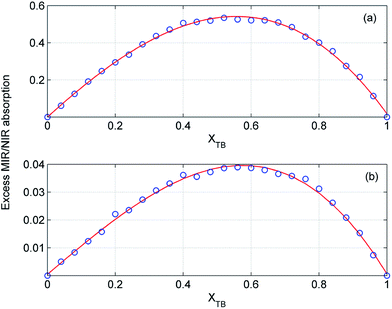 |
| | Fig. 12 Intensity changes at 1199 cm−1 (a) and 8432 cm−1 (b) in the excess absorption spectra of ME/TB mixture. The experimental data (○) were fitted by a polynomial of the third degree (red line). | |
Theoretical modeling of structure and stability of homo- and heteroclusters
Fig. 13 shows the theoretical energies of the mixed ME/TB cyclic tetramers (a), pentamers (b) and hexamers (c) as a function of the cluster composition. We focuses on these kinds of clusters since there are numerous reports showing that the cyclic tetramers, pentamers and hexamers are the most abundant species in the liquid alcohols.25–31 As expected, an increase in the number of TB molecules in the cluster increases the energy of the cluster as the most favorable ME–ME hydrogen bonds are replaced by ME–TB bonds. On the other hand, it is evident that the energy of the mixed clusters is smaller than that resulting from the sum of contributions from the homoclusters (straight line). The straight line in Fig. 13 represents an ideal mixture. It is of particular note that the largest deviation from the ideality is observed for clusters with the equimolar composition. This effect is more clearly seen for even-numbered clusters (tetramers, hexamers). Hence, we have the theoretical confirmation of the results obtained from the excess absorption spectra (Fig. 11). As shown, for ME/TB mixture this point is shifted to higher values of XTB (Fig. 12) as a result of the presence of two kinds of mixed clusters. On the other hand, the relationships shown in Fig. 13 are based on modeling of one kind of clusters.
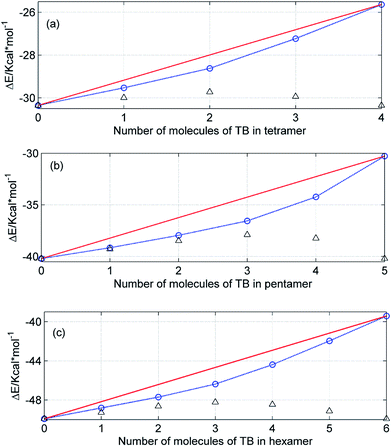 |
| | Fig. 13 Theoretical energies (DFT) of the mixed ME/TB tetramers (a), pentamers (b) and hexamers (c) as a function of the cluster composition. The red line represents an ideal mixture, while the triangles show the deviation from the ideality (the symbols were shifted to appear in this scale). | |
The theoretical calculations show that formation of the mixed clusters decreases an average energy as compared with an ideal cluster. In other words, an average strength of hydrogen bonds in the real mixture is expected to be higher than that in the ideal mixture. On the other hand, from the excess absorption spectra (Fig. 10) it results that an average strength of hydrogen bonds decreases on going from pure alcohols to the mixture. The creation of the mixed clusters from the hydrogen-bonded components only should decrease the energy as shown in Fig. 13. Yet, we have shown that creation of the mixed clusters involves largely molecules of TB with the free OH groups. This way upon mixing of ME and TB increases the overall number of hydrogen bonds but an average strength of these bonds is smaller as compared with the ideal mixture.
Conclusions
Chemometric and 2D correlation analysis reveal the presence of three kinds of clusters in most of the studied mixtures: two kinds of homoclusters and one kind of heterocluster. The composition of this mixed cluster depends on the composition of the mixture but an average molar ratio is close to 1![[thin space (1/6-em)]](https://www.rsc.org/images/entities/char_2009.gif) :
:![[thin space (1/6-em)]](https://www.rsc.org/images/entities/char_2009.gif) 1. Only for ME/TB mixture, in addition to these three clusters, TB-rich cluster with an average ME
1. Only for ME/TB mixture, in addition to these three clusters, TB-rich cluster with an average ME![[thin space (1/6-em)]](https://www.rsc.org/images/entities/char_2009.gif) :
:![[thin space (1/6-em)]](https://www.rsc.org/images/entities/char_2009.gif) TB molar ratio between 1
TB molar ratio between 1![[thin space (1/6-em)]](https://www.rsc.org/images/entities/char_2009.gif) :
:![[thin space (1/6-em)]](https://www.rsc.org/images/entities/char_2009.gif) 3 and 1
3 and 1![[thin space (1/6-em)]](https://www.rsc.org/images/entities/char_2009.gif) :
:![[thin space (1/6-em)]](https://www.rsc.org/images/entities/char_2009.gif) 4 was found. Our results evidence that the extent of non-ideality in the binary mixtures of ME with the short chain aliphatic alcohol depends on the chain length and the order of alcohol. It is of particular note that this tendency is perfectly correlated with the degree of the self-association of the alcohol. As a result, behavior of ME/ET mixture is the closest to the ideal mixture, while the largest deviation from the ideality occurs for ME/TB mixture. From the MIR/NIR excess absorbance spectra it results that the largest magnitude of these changes is observed at mole fraction of X ≈ 0.5. Only for ME/TB mixture this point is shifted to XTB ≈ 0.55–0.6. For all studied mixtures at equimolar composition about 50% molecules are involved in the heteroclusters, while the remaining molecules form the homoclusters similar to those found in pure alcohols. Results of MCR-ALS indicate that in spite of different chain length and structure all the mixtures show similar behavior. On this basis we can conclude that the structure of the mixtures of ME with short chain alcohols is determined mainly by the OH–OH interactions, while the chain length and structure have a less important meaning. On the other hand, one can expect that increasing chain length of both components of the mixture may affect the extent of the separation more appreciably. Such studies are in progress and will be reported elsewhere.
4 was found. Our results evidence that the extent of non-ideality in the binary mixtures of ME with the short chain aliphatic alcohol depends on the chain length and the order of alcohol. It is of particular note that this tendency is perfectly correlated with the degree of the self-association of the alcohol. As a result, behavior of ME/ET mixture is the closest to the ideal mixture, while the largest deviation from the ideality occurs for ME/TB mixture. From the MIR/NIR excess absorbance spectra it results that the largest magnitude of these changes is observed at mole fraction of X ≈ 0.5. Only for ME/TB mixture this point is shifted to XTB ≈ 0.55–0.6. For all studied mixtures at equimolar composition about 50% molecules are involved in the heteroclusters, while the remaining molecules form the homoclusters similar to those found in pure alcohols. Results of MCR-ALS indicate that in spite of different chain length and structure all the mixtures show similar behavior. On this basis we can conclude that the structure of the mixtures of ME with short chain alcohols is determined mainly by the OH–OH interactions, while the chain length and structure have a less important meaning. On the other hand, one can expect that increasing chain length of both components of the mixture may affect the extent of the separation more appreciably. Such studies are in progress and will be reported elsewhere.
Our results confirmed the presence of heterogeneity at molecular level in ME/ET mixture, as reported by Mello et al.12 However, in addition to the homoclusters of ME and ET we observed also significant amount of heteroclusters in the entire range of compositions. It does not seem likely that similar molecules of ME and ET do not form the mixed clusters, whereas more unlike molecules of ME and acetone are able to from the heteroclusters.7–9 Besides, the presence of pure ME and ET clusters only would imply that the strength of hydrogen bonding is a linear function of the composition of the mixture. In this case, the asynchronous spectrum should not develop any significant peaks.15–17
Acknowledgements
This work was supported by Grant NCN 2013/11/B/ST4/00501.
References
- S. Dixit, J. Crain, W. C. K. Poon, J. L. Finney and A. K. Soper, Nature, 2002, 416, 829 CrossRef CAS PubMed.
- A. K. Soper, L. Dougan, J. Crain and J. L. Finney, J. Phys. Chem. B, 2006, 110, 3472 CrossRef CAS PubMed.
- A. Wakisaka, K. Matsuura, M. Uranaga, T. Sekimoto and M. Takahashi, J. Mol. Liq., 2011, 160, 103 CrossRef CAS.
- A. Wakisaka and T. Ohki, J. Mol. Liq., 2005, 129, 231 CAS.
- G. Onori, Chem. Phys. Lett., 1989, 154, 212 CrossRef CAS.
- K. Yoshida and T. Yamaguchi, Z. Naturforsch., A: Phys. Sci., 2001, 56, 529 CAS.
- M. Musso, M. G. Giorgini and H. Torii, J. Mol. Liq., 2008, 147, 37 CrossRef.
- A. Idrissi, K. Polok, B. Marekha, I. Dewaele, M. Bria and W. Gadomski, J. Phys. Chem. B, 2014, 118, 1416 CrossRef CAS PubMed.
- F. Kollipost, A. V. Domanskaya and M. A. Shum, J. Phys. Chem. A, 2015, 119, 2225 CrossRef CAS PubMed.
- N. Y. Tan, R. Li, P. Bräuer, C. D'Agostino and L. F. Gladden, Phys. Chem. Chem. Phys., 2015, 17, 5999 RSC.
- J. Ortega, C. Ràfols, E. Bosch and M. Rosés, J. Chem. Soc., Perkin Trans. 2, 1996, 1497 RSC.
- C. Mello, T. Mello, E. Sevéri, L. Coelho, D. Ribeiro, A. Marangoni, R. J. Poppi and I. Noda, J. Chem. Phys., 2009, 131, 084501 CrossRef PubMed.
- Q. Li, N. Wang, Q. Zhou, S. Sun and Z. Yu, Appl. Spectrosc., 2008, 62, 166 CrossRef CAS PubMed.
- Y. Koga, F. Sebe, T. Minami, K. Otake, K. Saitow and K. Nishikawa, J. Phys. Chem. B, 2009, 113, 11928 CrossRef CAS PubMed.
- I. Noda, Appl. Spectrosc., 1993, 47, 1329 CrossRef CAS.
-
I. Noda and Y. Ozaki, Two Dimensional Correlation Spectroscopy—Applications in Vibrational and Optical Spectroscopy, John Wiley & Sons, Ltd., England, 2004 Search PubMed.
- M. A. Czarnecki, Appl. Spectrosc. Rev., 2011, 46, 67 CrossRef CAS.
- S. Wold, K. Esbensen and P. Geladi, Chemom. Intell. Lab. Syst., 1987, 2, 37 CrossRef CAS.
- H. R. Keller and D. L. Massart, Chemom. Intell. Lab. Syst., 1991, 12, 209 CrossRef.
- R. Tauler, B. Kowalski and S. Fleming, Anal. Chem., 1993, 65, 2040 CrossRef CAS.
- R. Tauler, A. Izquierdo-Ridorsa and E. Casassas, Chemom. Intell. Lab. Syst., 1993, 18, 293 CrossRef CAS.
-
M. J. Frisch, G. W. Trucks, H. B. Schlegel, G. E. Scuseria, M. A. Robb, J. R. Cheeseman, J. A. Montgomery Jr, T. Vreven, K. N. Kudin, J. C. Burant, J. M. Millam, S. S. Iyengar, J. Tomasi, V. Barone, B. Mennucci, M. Cossi, G. Scalmani, N. Rega, G. A. Petersson, H. Nakatsuji, M. Hada, M. Ehara, K. Toyota, R. Fukuda, J. Hasegawa, M. Ishida, T. Nakajima, Y. Honda, O. Kitao, H. Nakai, M. Klene, X. Li, J. E. Knox, H. P. Hratchian, J. B. Cross, C. Adamo, J. Jaramillo, R. Gomperts, R. E. Stratmann, O. Yazyev, A. J. Austin, R. Cammi, C. Pomelli, J. W. Ochterski, P. Y. Ayala, K. Morokuma, G. A. Voth, P. Salvador, J. J. Dannenberg, V. G. Zakrzewski, S. Dapprich, A. D. Daniels, M. C. Strain, O. Farkas, D. K. Malick, A. D. Rabuck, K. Raghavachari, J. B. Foresman, J. V. Ortiz, Q. Cui, A. G. Baboul, S. Clifford, J. Cioslowski, B. B. Stefanov, G. Liu, A. Liashenko, P. Piskorz, I. Komaromi, R. L. Martin, D. J. Fox, T. Keith, M. A. Al-Laham, C. Y. Peng, A. Nanayakkara, M. Challacombe, P. M. W. Gill, B. Johnson, W. Chen, M. W. Wong, C. Gonzalez and J. A. Pople, Gaussian 03, Revision C. 02, Gaussian, Inc, Wallingford CT, 2004 Search PubMed.
- M. A. Czarnecki, Y. Morisawa, Y. Futami and Y. Ozaki, Chem. Rev., 2015, 115, 9707 CrossRef CAS PubMed.
- R. J. Sengawa, S. Sankhla and N. Shinyashiki, J. Solution Chem., 2008, 37, 137 CrossRef.
- A. N. Fletcher, J. Phys. Chem., 1969, 73, 2217 CrossRef CAS.
- S. Sarkar and R. N. Joarder, J. Chem. Phys., 1993, 99, 2032 CrossRef CAS.
- G. M. Førland, F. O. Libnau, O. M. Kvalheim and H. Høiland, Appl. Spectrosc., 1996, 50, 1264 CrossRef.
- L. Stordrange, A. A. Christy, O. M. Kvalheim, H. Shen and Y. Z. Liang, J. Phys. Chem. A, 2002, 106, 8543 CrossRef.
- R. Ludwig, T. Weinhold and T. C. Farrar, Mol. Phys., 1999, 97, 465 CrossRef CAS.
- R. Ludwig, T. Weinhold and T. C. Farrar, Mol. Phys., 1999, 97, 479 CrossRef CAS.
- M. Huelsekopf and R. Ludwig, J. Mol. Liq., 2000, 85, 105 CrossRef CAS.
|
| This journal is © The Royal Society of Chemistry 2016 |
Click here to see how this site uses Cookies. View our privacy policy here.  Open Access Article
![[thin space (1/6-em)]](https://www.rsc.org/images/entities/char_2009.gif) :
:![[thin space (1/6-em)]](https://www.rsc.org/images/entities/char_2009.gif) 1. Only in methanol/tert-butanol mixture was observed an additional tert-butanol-rich cluster with an average methanol
1. Only in methanol/tert-butanol mixture was observed an additional tert-butanol-rich cluster with an average methanol![[thin space (1/6-em)]](https://www.rsc.org/images/entities/char_2009.gif) :
:![[thin space (1/6-em)]](https://www.rsc.org/images/entities/char_2009.gif) tert-butanol mole ratio between 1
tert-butanol mole ratio between 1![[thin space (1/6-em)]](https://www.rsc.org/images/entities/char_2009.gif) :
:![[thin space (1/6-em)]](https://www.rsc.org/images/entities/char_2009.gif) 3 and 1
3 and 1![[thin space (1/6-em)]](https://www.rsc.org/images/entities/char_2009.gif) :
:![[thin space (1/6-em)]](https://www.rsc.org/images/entities/char_2009.gif) 4. The excess absorption and two-dimensional correlation spectra reveals that methanol/ethanol mixture is the closest to the ideal one, while the largest degree of non-ideality was observed for methanol/tert-butanol mixture. The extent of deviation from the ideal mixture increases with an increase in the chain length and the order of the alcohol. These trends are correlated with decreasing degree of self-association of the alcohol.
4. The excess absorption and two-dimensional correlation spectra reveals that methanol/ethanol mixture is the closest to the ideal one, while the largest degree of non-ideality was observed for methanol/tert-butanol mixture. The extent of deviation from the ideal mixture increases with an increase in the chain length and the order of the alcohol. These trends are correlated with decreasing degree of self-association of the alcohol.


![[thin space (1/6-em)]](https://www.rsc.org/images/entities/char_2009.gif) :
:![[thin space (1/6-em)]](https://www.rsc.org/images/entities/char_2009.gif) ET molar ratio of 1
ET molar ratio of 1![[thin space (1/6-em)]](https://www.rsc.org/images/entities/char_2009.gif) :
:![[thin space (1/6-em)]](https://www.rsc.org/images/entities/char_2009.gif) 1. From Fig. 5a and 6a it is clear that at equimolar mixture nearly 50% molecules of ME and ET form the mixed clusters, while the remaining molecules are involved in the homoclusters. Similar results of MCR-ALS (not shown) were obtained for ME/1PR, ME/2PR and ME/CP mixtures.
1. From Fig. 5a and 6a it is clear that at equimolar mixture nearly 50% molecules of ME and ET form the mixed clusters, while the remaining molecules are involved in the homoclusters. Similar results of MCR-ALS (not shown) were obtained for ME/1PR, ME/2PR and ME/CP mixtures.


![[thin space (1/6-em)]](https://www.rsc.org/images/entities/char_2009.gif) :
:![[thin space (1/6-em)]](https://www.rsc.org/images/entities/char_2009.gif) TB molar ratio of 1
TB molar ratio of 1![[thin space (1/6-em)]](https://www.rsc.org/images/entities/char_2009.gif) :
:![[thin space (1/6-em)]](https://www.rsc.org/images/entities/char_2009.gif) 1, whereas for the second cluster this ratio is between 1
1, whereas for the second cluster this ratio is between 1![[thin space (1/6-em)]](https://www.rsc.org/images/entities/char_2009.gif) :
:![[thin space (1/6-em)]](https://www.rsc.org/images/entities/char_2009.gif) 3 and 1
3 and 1![[thin space (1/6-em)]](https://www.rsc.org/images/entities/char_2009.gif) :
:![[thin space (1/6-em)]](https://www.rsc.org/images/entities/char_2009.gif) 4. The highest population of both heteroclusters reaches 25% and for TB-rich cluster this maximum is shifted to higher XTB. By adding the contributions from these two mixed clusters we obtained the concentration profile (Fig. 9a, dotted brown line) similar to those shown in Fig. 5a and 6a. Like for the other mixtures, at equimolar composition about 50% of molecules are involved in the heteroclusters.
4. The highest population of both heteroclusters reaches 25% and for TB-rich cluster this maximum is shifted to higher XTB. By adding the contributions from these two mixed clusters we obtained the concentration profile (Fig. 9a, dotted brown line) similar to those shown in Fig. 5a and 6a. Like for the other mixtures, at equimolar composition about 50% of molecules are involved in the heteroclusters.


![[thin space (1/6-em)]](https://www.rsc.org/images/entities/char_2009.gif) :
:![[thin space (1/6-em)]](https://www.rsc.org/images/entities/char_2009.gif) 1 clusters. Sengawa et al. reported that the maximum negative values of the excess static dielectric constant for ME/ET mixture were observed at mole fraction of X ≈ 0.5.24 Hence, the authors concluded that the interaction between methanol and ethanol is the strongest at equimolar mixture. Since the excess static dielectric constant was negative in the entire range of compositions it was suggested that the number of hydrogen bonds in the mixture is fewer than for the corresponding pure liquids.24 A careful analysis of Fig. 10 led us to quite different conclusions. The negative values of the excess MIR (3200–3600 cm−1) and NIR (6200–7000 cm−1) absorption of the bonded OH reveal that an average population and/or strength of hydrogen bonds decreases on going from the ideal to the real mixture. Yet, in this case we should observe an opposite trend for the free OH. It is of particular note that the peaks due to the free OH are negative as well. This effect is well seen for ME/TB mixture (Fig. 10b, red line), where one can observe a distinct negative peak at 7060 cm−1 from the free OH of TB. These observations allow us to infer that in the mixture increases the population of hydrogen-bonded OH groups as compared with the pure alcohols, but an average strength of these bonds is weaker. The formation of heteroclusters leads to significant reduction in the population of the free OH groups from TB (Fig. 10b). On the other hand, participation of molecules of ME in the mixed clusters decreases an average strength of hydrogen bonds since the ME–TB bonds are weaker than those of ME–ME.
1 clusters. Sengawa et al. reported that the maximum negative values of the excess static dielectric constant for ME/ET mixture were observed at mole fraction of X ≈ 0.5.24 Hence, the authors concluded that the interaction between methanol and ethanol is the strongest at equimolar mixture. Since the excess static dielectric constant was negative in the entire range of compositions it was suggested that the number of hydrogen bonds in the mixture is fewer than for the corresponding pure liquids.24 A careful analysis of Fig. 10 led us to quite different conclusions. The negative values of the excess MIR (3200–3600 cm−1) and NIR (6200–7000 cm−1) absorption of the bonded OH reveal that an average population and/or strength of hydrogen bonds decreases on going from the ideal to the real mixture. Yet, in this case we should observe an opposite trend for the free OH. It is of particular note that the peaks due to the free OH are negative as well. This effect is well seen for ME/TB mixture (Fig. 10b, red line), where one can observe a distinct negative peak at 7060 cm−1 from the free OH of TB. These observations allow us to infer that in the mixture increases the population of hydrogen-bonded OH groups as compared with the pure alcohols, but an average strength of these bonds is weaker. The formation of heteroclusters leads to significant reduction in the population of the free OH groups from TB (Fig. 10b). On the other hand, participation of molecules of ME in the mixed clusters decreases an average strength of hydrogen bonds since the ME–TB bonds are weaker than those of ME–ME.

![[thin space (1/6-em)]](https://www.rsc.org/images/entities/char_2009.gif) :
:![[thin space (1/6-em)]](https://www.rsc.org/images/entities/char_2009.gif) 1. Only for ME/TB mixture, in addition to these three clusters, TB-rich cluster with an average ME
1. Only for ME/TB mixture, in addition to these three clusters, TB-rich cluster with an average ME![[thin space (1/6-em)]](https://www.rsc.org/images/entities/char_2009.gif) :
:![[thin space (1/6-em)]](https://www.rsc.org/images/entities/char_2009.gif) TB molar ratio between 1
TB molar ratio between 1![[thin space (1/6-em)]](https://www.rsc.org/images/entities/char_2009.gif) :
:![[thin space (1/6-em)]](https://www.rsc.org/images/entities/char_2009.gif) 3 and 1
3 and 1![[thin space (1/6-em)]](https://www.rsc.org/images/entities/char_2009.gif) :
:![[thin space (1/6-em)]](https://www.rsc.org/images/entities/char_2009.gif) 4 was found. Our results evidence that the extent of non-ideality in the binary mixtures of ME with the short chain aliphatic alcohol depends on the chain length and the order of alcohol. It is of particular note that this tendency is perfectly correlated with the degree of the self-association of the alcohol. As a result, behavior of ME/ET mixture is the closest to the ideal mixture, while the largest deviation from the ideality occurs for ME/TB mixture. From the MIR/NIR excess absorbance spectra it results that the largest magnitude of these changes is observed at mole fraction of X ≈ 0.5. Only for ME/TB mixture this point is shifted to XTB ≈ 0.55–0.6. For all studied mixtures at equimolar composition about 50% molecules are involved in the heteroclusters, while the remaining molecules form the homoclusters similar to those found in pure alcohols. Results of MCR-ALS indicate that in spite of different chain length and structure all the mixtures show similar behavior. On this basis we can conclude that the structure of the mixtures of ME with short chain alcohols is determined mainly by the OH–OH interactions, while the chain length and structure have a less important meaning. On the other hand, one can expect that increasing chain length of both components of the mixture may affect the extent of the separation more appreciably. Such studies are in progress and will be reported elsewhere.
4 was found. Our results evidence that the extent of non-ideality in the binary mixtures of ME with the short chain aliphatic alcohol depends on the chain length and the order of alcohol. It is of particular note that this tendency is perfectly correlated with the degree of the self-association of the alcohol. As a result, behavior of ME/ET mixture is the closest to the ideal mixture, while the largest deviation from the ideality occurs for ME/TB mixture. From the MIR/NIR excess absorbance spectra it results that the largest magnitude of these changes is observed at mole fraction of X ≈ 0.5. Only for ME/TB mixture this point is shifted to XTB ≈ 0.55–0.6. For all studied mixtures at equimolar composition about 50% molecules are involved in the heteroclusters, while the remaining molecules form the homoclusters similar to those found in pure alcohols. Results of MCR-ALS indicate that in spite of different chain length and structure all the mixtures show similar behavior. On this basis we can conclude that the structure of the mixtures of ME with short chain alcohols is determined mainly by the OH–OH interactions, while the chain length and structure have a less important meaning. On the other hand, one can expect that increasing chain length of both components of the mixture may affect the extent of the separation more appreciably. Such studies are in progress and will be reported elsewhere.


