Zinc ion-doped carbon dots with strong yellow photoluminescence†
Jian Cheng,
Cai-Feng Wang,
Yan Zhang,
Shengyang Yang and
Su Chen*
State Key Laboratory of Materials-Oriented Chemical Engineering, College of Chemistry and Chemical Engineering, Nanjing Tech University (Former Nanjing University of Technology), 5 Xin Mofan Road, Nanjing 210009, P. R. China. E-mail: chensu@njtech.edu.cn
First published on 22nd March 2016
Abstract
We demonstrated a simple strategy for facile generation of high-quantum yield robust yellow photoluminescent (PL) carbon dots (CDs) doped with zinc ions. These as-synthesized CDs when synthesized using zinc ions and citric acid as the precursor via a one-pot solvothermal method produced zinc ion-doped CDs that yielded excitation-independent yellow PL emission and the highest QY reported to date of 51.2%. We also thoroughly discuss the formation mechanism of these CDs, whose high quality was attributed to the radiative recombination of electrons and holes trapped on the CD surface. We also showed the ability to find practical applications of these as-prepared CDs, such as for bifunctional photonic crystal films and for fluorescent microfibers and patterns.
Introduction
Carbon dots (CDs) have sparked tremendous interest due to their splendid and novel properties, such as bright fluorescence, high photostability, low toxicity, and excellent biocompatibility.1–3 Currently, many approaches have been developed involving pyrolysis,4 chemical oxidation,5 laser ablation,6 microwave-assisted synthesis,7 plasma treatment8 and hydrothermal synthesis methods,9 which are applied in various applications, such as bioimaging, photovoltaic devices and biosensor applications.10–15 Although much progress toward developing CDs has been made, high quantum yields (QYs) for CDs have not been reported, except for a few cases. Also, in most cases, the reported emission colors of CDs are usually dull blue, thus limiting their further application. To overcome these issues, much effort has been focused on non-metallic organic and inorganic metal-doped CDs, along with higher-QY and full-color CDs. In this respect, Dong et al. co-doped CDs with nitrogen and sulfur to effectively increase their QY.10 Zhang et al. synthesized CDs with tunable luminescence by N doping.11 The Sun group realized green luminescent CDs with high QYs by doping inorganic salts (CZnS-dots and CTiO2-dots).12 Moreover, some CDs excited with a single excitation wavelength have been reported to emit multiple colors.16,17 A breakthrough in photoluminescence (PL), quantum yield (QY), and multi-color PL emission of CDs excited with a single excitation wavelength, especially yellow PL emission, is therefore highly anticipated.Herein, for the first time, we demonstrated the use of a simple strategy involving the doping of zinc ions to generate robust yellow photoluminescent CDs with a QY of 51.2%. These as-synthesized CDs were made using zinc ions and citric acid as the precursor via a one-pot solvothermal method, producing excitation-independent CDs doped with zinc ions (denoted as Zn2+-doped CDs), which may have the highest reported QY of yellow PL-emitting CDs. We also thoroughly discuss the mechanism of formation of the as-synthesized CDs; this mechanism involves the radiative recombination of electrons and holes trapped on the CD surface. For practical applications, we utilized these strongly yellow PL Zn2+-doped CDs coupled with a poly(styrene-co-methacrylic acid) (PS-co-PMAA) mono-dispersed colloid to create a photonic crystal film (PC-CDs) with two functions (visible light optical and photoluminescence properties) by using the vertical deposition method. The as-prepared Zn2+-doped CDs could be also be a good candidate for applications in the inkjet printing pattern and LED fields. The strategy we developed is simple, and can be used to create other robust CDs, allowing CDs to be extended to promising applications.
Results and discussion
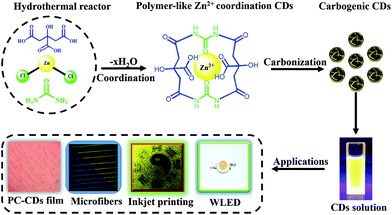
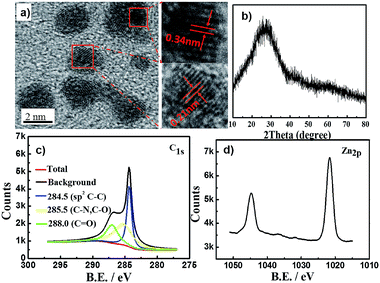
The synthetic procedure to produce Zn2+-doped CDs involved dehydration, coordination and carbonization (Scheme 1). The coordination between carbonyl or carboxyl groups and Zn2+ (0.1 mmol Zn2+ in 10 mL toluene) derived from the precursor occurred after the dehydration stage.18 Then, the coordinated compound underwent a continuous dehydration process to form polymer-like CDs, which were further carbonized to form the Zn2+-doped CDs along with using prolonged reaction times under high temperatures.6 We then applied the as-synthesized Zn2+-doped CDs with robust intense bright yellow PL to various applications.The morphologies of the Zn2+-doped CDs were visualized by transmission electron microscopy (TEM) analyses. Fig. S1a, ESI† shows TEM images of the Zn2+-doped CDs, revealing the as-synthesized Zn2+-doped CDs to be uniform dispersions without apparent aggregation and with particle diameters of 2–5 nm (Fig. S1b, ESI†). In the high-resolution TEM (HRTEM) images we can distinctly see lattices corresponding to the Zn2+-doped CDs. Fig. 1a shows a lattice spacing of 0.34 nm, which corresponds to the spacing between graphene layers (002 facet), while the observed lattice spacing of 0.21 nm is consistent with the in-plane lattice spacing of graphene (100 facet). This result is similar to those of many other reported CDs.19,20 The Zn2+-doped CDs yielded XRD patterns (Fig. 1b) with a peak centered at 25.5° (0.34 nm),13 which was ascribed to disordered carbon atoms, similar to the graphite lattice spacing.
Atomic force microscopy (AFM) image of the as-synthesized Zn2+-doped CDs (Fig. S2a, ESI†) showed landform heights between 2.5 and 4.5 nm (Fig. S2b, ESI†). X-ray photoelectron spectroscopy (XPS) analysis indicated the Zn2+-doped CDs to be mainly composed of carbon, nitrogen, oxygen and zinc. These CDs yielded a high-resolution XPS spectrum of C1s exhibiting (sp2 C–C), (C–O, C–N), and (C![[double bond, length as m-dash]](https://www.rsc.org/images/entities/char_e001.gif) O) main peaks at binding energy values of 284.5 eV, 285.5 eV and 288.0 eV (Fig. 1c). Fig. 1d shows the XPS spectrum of Zn2p peaks at 1045 eV and 1023 eV. Thermogravimetric analysis (TGA) indicated the presence of 10% zinc oxide in Zn2+-doped CDs for decomposition temperatures above 580 °C (Fig. S3a, ESI†). The above results also confirmed the CDs to be doped with zinc ions.
O) main peaks at binding energy values of 284.5 eV, 285.5 eV and 288.0 eV (Fig. 1c). Fig. 1d shows the XPS spectrum of Zn2p peaks at 1045 eV and 1023 eV. Thermogravimetric analysis (TGA) indicated the presence of 10% zinc oxide in Zn2+-doped CDs for decomposition temperatures above 580 °C (Fig. S3a, ESI†). The above results also confirmed the CDs to be doped with zinc ions.
We further characterized Zn2+-doped CDs by acquiring Fourier transform infrared (FTIR) and microscopic Fourier transform infrared (MFTIR) spectra (Fig. S3b and S4, ESI†). The peaks observed at 3430 cm−1, 1650 cm−1 and 1120 cm−1 were ascribed to the hydroxyl group (–OH), carbonyl group (C![[double bond, length as m-dash]](https://www.rsc.org/images/entities/char_e001.gif) O), and asymmetric stretching vibrations of C–N, respectively. The strong intensity of the Zn–O bands near 700 cm−1 and 450 cm−1 imply that oxygen formed complexes with the metal. We also obtained carboxylic acid spectra showing a main symmetric νs (COO–) band at about 1450 cm−1 and asymmetric νas (COO–) band at about 1650 cm−1.6,21 By contrast, in the FTIR spectra of the Zn2+-doped CDs sample with an undoped control sample, the intensities of the Zn2+-doped CDs characteristic peaks at 3430 cm−1 (–OH) and 1650 cm−1 (C
O), and asymmetric stretching vibrations of C–N, respectively. The strong intensity of the Zn–O bands near 700 cm−1 and 450 cm−1 imply that oxygen formed complexes with the metal. We also obtained carboxylic acid spectra showing a main symmetric νs (COO–) band at about 1450 cm−1 and asymmetric νas (COO–) band at about 1650 cm−1.6,21 By contrast, in the FTIR spectra of the Zn2+-doped CDs sample with an undoped control sample, the intensities of the Zn2+-doped CDs characteristic peaks at 3430 cm−1 (–OH) and 1650 cm−1 (C![[double bond, length as m-dash]](https://www.rsc.org/images/entities/char_e001.gif) O) were found to be decreased. (Fig. S3b, ESI†), together with the MFTIR evidence shows that red color area (the color represented the intensity of characteristic peak. From red to blue, the intensity is decrease) noticed at 3430 cm−1 (–OH) and 1650 cm−1 (C
O) were found to be decreased. (Fig. S3b, ESI†), together with the MFTIR evidence shows that red color area (the color represented the intensity of characteristic peak. From red to blue, the intensity is decrease) noticed at 3430 cm−1 (–OH) and 1650 cm−1 (C![[double bond, length as m-dash]](https://www.rsc.org/images/entities/char_e001.gif) O) can be transferred or decreased to partially yellow color area (Fig. S4, ESI†). It is clear that the asymmetric carboxylate vibrations of the control sample appeared at higher frequencies than did those of the Zn2+-doped CDs sample. This difference can be associated with a stronger interaction of the carboxylic acid with the zinc sites. Carboxylate ions can coordinate in several ways, including as a unidentate ligand, chelating ligand and bridging bidentate ligand. Since each type of coordination has a specific νas (COO–) and νs (COO–) peak position, the peak separation (Δν (COO–) = (νas (COO–) − νs (COO–))) can be used to determine which type of coordination is being used by the carboxylate. According to the peak separation (Δν (COO–) > 160 cm−1) and zinc–oxygen binding (Zn–O), the plausible complex structure for the carboxylate ions and Zn2+ product involved the carboxylate functioning as a chelating ligand.22,23
O) can be transferred or decreased to partially yellow color area (Fig. S4, ESI†). It is clear that the asymmetric carboxylate vibrations of the control sample appeared at higher frequencies than did those of the Zn2+-doped CDs sample. This difference can be associated with a stronger interaction of the carboxylic acid with the zinc sites. Carboxylate ions can coordinate in several ways, including as a unidentate ligand, chelating ligand and bridging bidentate ligand. Since each type of coordination has a specific νas (COO–) and νs (COO–) peak position, the peak separation (Δν (COO–) = (νas (COO–) − νs (COO–))) can be used to determine which type of coordination is being used by the carboxylate. According to the peak separation (Δν (COO–) > 160 cm−1) and zinc–oxygen binding (Zn–O), the plausible complex structure for the carboxylate ions and Zn2+ product involved the carboxylate functioning as a chelating ligand.22,23
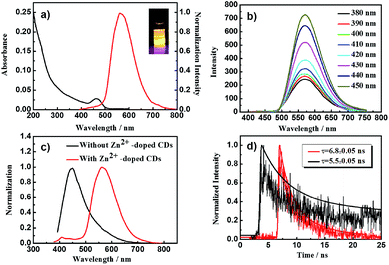
Fig. 2 shows a series of optical characterization of as-prepared CDs. The product, Zn2+-doped CDs, displayed high fluorescence and a bright yellow color under a UV lamp at a very low concentration (0.1 mg mL−1). A sharp absorption peak in the UV/Vis spectrum centered at 460 nm as well as a narrow high-intensity PL peak at an emission wavelength of 580 nm (λex = 380 nm) were observed (Fig. 2a). The QY of the as-obtained Zn2+-doped CDs was found to be as high as 51.2% using rhodamine 6G in ethanol as a standard (see details in the ESI†). To the best of our knowledge, this is the highest QY value ever reported for yellow PL CDs, with the previous record high being only 12%.24 Another indication of optical characterization is that the PL of Zn2+-doped CDs did not display any dependence on the excitation wavelength, in contrast to the dependence that is displayed by other traditional CDs (Fig. 2b). Interestingly, the PL intensity of the emission in this case was found to increase with decreasing excitation wavelength. This relationship had not been previously observed. The unique PL prosperity is highly associated with zinc doping behaviour. We further investigated the PL properties and fluorescence decay behaviours of Zn2+-doped CDs and of control CDs, shown in Fig. 2c and d, respectively. Under the same tested conditions, an obvious red-shift of the PL peak occurred when comparing the Zn2+-doped CD sample with the control sample (Fig. 2c). Also, a substantial tail (asymmetric peak) was observed in the PL curve of the control sample, as has been found in most reported CDs. However, this tail decreased in extent upon doping the CDs with zinc ions. Moreover, the symmetry of the PL peak significantly improved upon doping the CDs with zinc ions, indicative of a more uniform particle size. Furthermore, fluorescence decays of Zn2+-doped CDs and control CDs were measured by using the time-correlated single photon counting (TCSPC) technique (Fig. 2d). We calculated the average PL lifetime (τ−) of Zn2+-doped CDs and control CDs to be 6.8 ± 0.05 ns and 5.5 ± 0.05 ns, respectively (χ2 < 1.1) (see details in the ESI†). The Zn2+-doped CDs average PL lifetime was found to be longer than that of control CDs. Mechanistically, the longer PL lifetime of carbon-based photoluminescence has been attributed to passivated defects (passivated by organic or inorganic compounds via either covalent linkages or chemical adsorption) on the CD surfaces acting as excitation energy traps.26 More specifically, due to the zinc ions doped onto the CDs, the CD surfaces became passivated, and exhibited longer PL lifetimes than did the control CDs. That is, the Zn2+-doped CDs displayed greater PL stability.
Two mechanisms have been most commonly proposed to explain the PL mechanism of CDs, namely electronic conjugate structures25 and emissive traps.26 Herein, we inferred that the strong yellow PL emission of the Zn2+-doped CDs mainly resulted from the surface passivation of the CDs doped with zinc ions. A similar result has already been reported by the Sun group,15 and the strengthened PL of the semiconductor-doped CDs may be rationalized in terms of improved surface passivation by a combination of doping the surface with inorganic compounds and then functionalizing the surface with an organic compound. In fact, the PL emissions in CDs were attributed to radiative recombination of the electrons and holes trapped at the CD surface. Hence, it is reasonable that more new energy levels resulted from the addition of zinc ions, producing more diverse surface sites and occurrence of a PL red-shift.
Proposed energy level diagrams for the undoped CDs and Zn2+-doped CDs are illustrated in Fig. 3. We proposed Zn2+-doped CD features similar to those of undoped CDs, with their full-color emissions mainly derived from different surface states. For the Zn2+-doped CDs, besides the HOMO and HOMO+1 energy levels, a new HOMO+2 energy level was proposed to be introduced after Zn2+ doping. Hence, electron transitions could occur from the new HOMO+2 to the LUMO and then the excited electrons could be deactivated by radiative recombination at the same time. This process could cause the PL emission to occur in the yellow region. The control CDs, however, having no energy level introduced, can only induce blue fluorescence as their electron transitions occur from the HOMO+1 level to the LUMO. The excited electrons generated by absorption of short wavelength light (HOMO to LUMO) can relax to the HOMO+1 and HOMO+2 levels through radiative recombination that results in a broad excitation-independent emission.
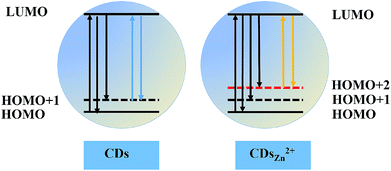 | ||
| Fig. 3 Schematic illustration of proposed energy levels and electron transitions graphic of undoped CDs (left) and Zn2+-doped CDs (right). | ||
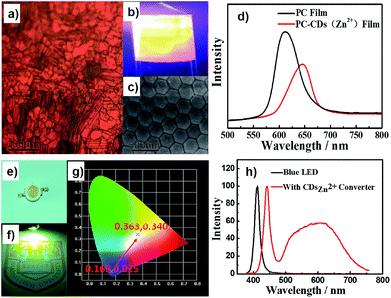
The second set of experiments was focused on fabrication of PC film loaded with fluorescent quantum dots (QDs). Up to now, semiconductor QDs have been applied by being coupled with colloidal crystals either by in situ growth methods or by electrostatic fixation on the surfaces of the polymer spheres.27 However, in most cases, the in situ growth methods do not yield high-quality (PL and QY) QDs. The electrostatic interaction between QDs and colloidal crystals is usually weak and thus leads to easy phase separation. To make the best use of the good coordination ability of these as-prepared Zn2+-doped CDs, we for the first time employed the vertical deposition method and monodisperse colloidal photonic crystals of PS-co-PMAA spheres (average size 250 nm, Fig. 4c) combined with Zn2+-doped CDs to create bifunctional films with PC structure color and bright yellow PL (Fig. 4a and b). Under a UV lamp, the color of the film can be changed from red to a bright yellow fluorescent color. More importantly, brightly yellow PL Zn2+-doped CDs composited photonic crystal film and non-fluorescent CDs (without Zn2+-doped) composited photonic crystal film we can clear distinguish (Fig. S5, ESI†). Fig. 4d shows the reflection spectra of the PC film and PC-CD film. There was a clear redshift of the wavelength but with a decrease of intensity of the reflection spectrum, which might have been caused by the changed band structure of the PCs. This result could be explained by the effects of the coordination between the Zn2+-doped CDs and PS-co-PMAA colloidal crystals containing carboxyl groups. This interaction allowed the Zn2+-doped CDs to firmly bind to the colloidal crystals, forming uniform fluorescent film. Such films have potentially extensive applications in the sensor and anti-fake fields (photonic crystal structure color under vis-light and PL under UV light).
In practice, it would be possible to use high-QY Zn2+-doped CD products as phosphor to create white light-emitting diodes (WLEDs). Indeed, there are several reports showing the use of CDs to make WLEDs.28 However, in most cases, the QYs of CDs applied in WLEDs are fairly low, and they emit a dull blue color, limiting their applications. Herein, we employed the yellow PL Zn2+-doped CDs to make a WLED with Commission International d'Eclairage (CIE) coordinates of (0.36, 0.34) (Fig. 4). The result indicated that the Zn2+-doped CDs with robust yellow PL emission can act as the phosphor materials for achieving high-performance WLEDs. On the other hand, we further tried to make use of high-QY Zn2+-doped CD solutions such as dye ink to construct fluorescent patterns via inkjet printing (Fig. S6, ESI†).11 As expected, the pattern had a bright yellow color with a picture of a “panda” under UV light. Also, we fabricated one-dimensional fluorescent microfiber arrays via microfluidic technology (Fig. S6, ESI†).
Experimental
Materials
Citric acid monohydrate (CA), urea, zinc chloride (ZnCl2), toluene, styrene (St), methacrylic acid (MAA), and potassium persulfate (KPS) were purchased from Sinopharm Chemical Reagent Co., Ltd. (Shanghai, China). Styrene, methacrylic acid, and potassium persulfate were purified before being used. Polyvinylpyrrolidone (PVP) and rhodamine 6G were purchased from Aladdin Chemistry Co., Ltd. Carbon-coated copper grids were supplied by Electron Microscopy Sciences. High-purity water with a resistivity greater than 18 MΩ cm was used in the experiments.Characterizations
High-resolution transmission electron microscope (HRTEM) observations were performed with a Tecnai G2 F30 S-TWIN transmission electron microscope. The element analyses were performed on an Elementar Vario EL cube (Germany). Fourier transform infrared (FT-IR) spectra were recorded on a Nicolet 6700 FT-IR spectrometer. X-ray diffraction (XRD) was performed on a Rigaku Corporation D/max-rC rotating anode X-ray powder diffractometer using a copper target. X-ray photoelectron spectroscopy (XPS) of the Zn2+-doped CDs was performed on an ES-CAIAB250 XPS system with Al/Kα as the X-ray source, and the energy step size was set as 0.100 eV. Ultraviolet-visible (UV-Vis) absorption spectra were acquired with a Perkin-Elmer Lambda 850 UV-Vis spectrometer. Photoluminescence (PL) measurements were taken on a Varian Cary Eclipse spectrophotometer. Time-correlated single-photon counting (TCSPC) data were collected using an Edinburgh FL 900 photocounting system. Thermogravimetric analysis (TGA) was performed using a TA Instruments Q500 TGA analyzer. Atomic force microscopy (AFM) analysis was carried out in the acoustic AC mode on a Molecular Imaging PicoPlus AFM system equipped with a multipurpose scanner and a NanoWorld Pointprobe NCH sensor. Microfluidic spinning microfibers were also observed by using an inverted fluorescence microscope (SFM-30I, Shanghai).Preparation of Zn2+-doped CDs and control CDs
Zn2+-doped CDs were produced by putting citric acid (1 mmol), urea (2 mmol) and ZnCl2 (1 mmol) in toluene (10 mL) solution. The as-prepared solution was then transferred to a Teflon-lined autoclave chamber (25 mL), which was then sealed, heated at 200 °C for 12 h, and then cooled down to room temperature naturally. The obtained brown solution was centrifuged at 12![[thin space (1/6-em)]](https://www.rsc.org/images/entities/char_2009.gif) 000 rpm for 20 min to remove large particles and the supernatant was collected. Solid samples were obtained by evaporating the solvents, and the Zn2+-doped CDs showed excellent solubility in many polar organic solvents and in water. The same process, but without the inclusion of ZnCl2, was used to synthesize the undoped CDs.
000 rpm for 20 min to remove large particles and the supernatant was collected. Solid samples were obtained by evaporating the solvents, and the Zn2+-doped CDs showed excellent solubility in many polar organic solvents and in water. The same process, but without the inclusion of ZnCl2, was used to synthesize the undoped CDs.
Synthesis of the PS-co-PMAA photonic crystal
A mass of 1.3 g of MAA was dissolved in 470 g of purified water in a 1 L round flask, and the stirring speed was set at 300 rpm. After the solution was heated at 98 °C, 20 g St was added and emulsified for 20 min. The polymerization was initiated by the 30 g aqueous solution containing 0.75 g KPS, and the polymerization was allowed to continue for 4 h at 98 °C. After the mixture was quenched with air, the end product was obtained.Synthesis of the PC-CD film
The PC-CD film was synthesized by combining the photonic crystal and CDs through the use of the vertical deposition method. A volume of 2 mL of undoped CDs and of Zn2+-doped CDs (1 mg mL−1) were added, respectively, into separate 50 mL (0.2% solid content) volumes of as-prepared PS-co-PMAA photonic crystal solutions, and then a glass (cleaned by using a piranha solution) was inserted into each of these solutions. The solutions were finally placed into a temperature humidity chamber (temperature: 80 °C, humidity: 60) for 24 h.Preparation of WLEDs
Ultraviolet InGaN LED chips were used and attached to the bottom of the LED bases. Afterwards, the silicone was mixed with the CD solution (1 mg CDs in 1 mL toluene) and mixed uniform by stirring. The resulting mixture was then put it into a vacuum chamber to remove bubbles. A volume of about 30 μL of the mixture was dispensed into the cup-shaped blank on the LED chip and thermally cured at 120 °C for 1 h. Finally, optical lenses were fixed on the bottom of the LED chip and the caverns were filled with the silicone. The LED was then further thermally cured at 120 °C for 1 h. All the optical performances were measured using ZWL-600 instrument with an integral sphere.Preparation of fluorescent microfibers by microfluidic spinning
A mass of 3 g of PVP was dissolved in each of two 10 g ethanol solutions of CDs (0.1 g Zn2+-doped CDs or undoped CDs) to prepare the corresponding gel solutions at ambient temperature. After a good amount of mechanical stirring and ultrasonication to remove bubbles, homogeneous gel solutions were obtained. These as-prepared gel solutions were used to make fluorescent microfibers by microfluidic spinning.Inkjet printing of CD solutions
The CD solutions (0.1 g Zn2+-doped CDs or undoped CDs dissolved in 10 g ethanol, respectively) along with a Dimatix DMP 2831 printer were used to form a fluorescent image of blue and yellow patterns on paper under UV light.Conclusions
In summary, we have described a convenient and versatile method for fabricating robust carbon dots (CDs) with strong yellow photoluminescence (PL) by doping the CDs with zinc ions. The method is simple and versatile, and various types of doping could be carried out to seek new kinds of CDs. The Zn2+-doped CD product showed an excitation-independent and highly bright yellow PL with the highest quantum yield reported to date of 51.2%. For the first time, we created a bifunctional film by using colloidal PS-co-PMAA microspheres and Zn2+-doped CDs, which displayed a PC structure color and bright yellow PL. Our ability to apply the as-prepared CDs to inkjet printing and microfluidic spinning suggest that the CDs may find applications in the anti-fake and sensor fields.Acknowledgements
This work was supported by National Natural Science Foundation of China (21076103, 21474052 and 21176122), Priority Academic Program Development of Jiangsu Higher Education Institutions (PAPD), and Qing Lan Project.Notes and references
- P. G. Luo, S. Sahu, S.-T. Yang, S. K. Sonkar, J. Wang, H. Wang, G. E. LeCroy, L. Cao and Y.-P. Sun, J. Mater. Chem. B, 2013, 1, 2116 RSC
.
- L. Cao, S. T. Yang, X. Wang, P. G. Luo, J. H. Liu, S. Sahu, Y. Liu and Y. P. Sun, Theranostics, 2012, 2, 295–301 CrossRef CAS PubMed
.
- S. Qu, X. Wang, Q. Lu, X. Liu and L. Wang, Angew. Chem., Int. Ed., 2012, 51, 12215–12218 CrossRef CAS PubMed
.
- D. Y. Pan, L. Guo, J. C. Zhang, C. Xi, Q. Xue, H. Huang, J. H. Li, Z. W. Zhang, W. J. Yu, Z. W. Chen, Z. Li and M. H. Wu, J. Mater. Chem., 2012, 22, 3314–3318 RSC
.
- Z. A. Qiao, Y. Wang, Y. Gao, H. Li, T. Dai, Y. Liu and Q. Huo, Chem. Commun., 2010, 46, 8812–8814 RSC
.
- S. T. Yang, X. Wang, H. Wang, F. Lu, P. G. Luo, L. Cao, M. J. Meziani, J. H. Liu, Y. Liu, M. Chen, Y. Huang and Y. P. Sun, J. Phys. Chem. C, 2009, 113, 18110–18114 CAS
.
- Q. Wang, X. Liu, L. Zhang and Y. Lv, Analyst, 2012, 137, 5392–5397 RSC
.
- J. Wang, C. F. Wang and S. Chen, Angew. Chem., Int. Ed., 2012, 51, 9297–9301 CrossRef CAS PubMed
.
- D. Pan, J. Zhang, Z. Li and M. Wu, Adv. Mater., 2010, 22, 734–738 CrossRef CAS PubMed
.
- Y. Dong, H. Pang, H. B. Yang, C. Guo, J. Shao, Y. Chi, C. M. Li and T. Yu, Angew. Chem., Int. Ed., 2013, 52, 7800–7804 CrossRef CAS PubMed
.
- Y.-Q. Zhang, D.-K. Ma, Y. Zhuang, X. Zhang, W. Chen, L.-L. Hong, Q.-X. Yan, K. Yu and S.-M. Huang, J. Mater. Chem., 2012, 22, 16714 RSC
.
- P. Anilkumar, X. Wang, L. Cao, S. Sahu, J. H. Liu, P. Wang, K. Korch, K. N. Tackett 2nd, A. Parenzan and Y. P. Sun, Nanoscale, 2011, 3, 2023–2027 RSC
.
- J. Shen, Y. Zhu, X. Yang and C. Li, Chem. Commun., 2012, 48, 3686–3699 RSC
.
- C. Fowley, B. McCaughan, A. Devlin, I. Yildiz, F. M. Raymo and J. F. Callan, Chem. Commun., 2012, 48, 9361–9363 RSC
.
- S. Zhu, Q. Meng, L. Wang, J. Zhang, Y. Song, H. Jin, K. Zhang, H. Sun, H. Wang and B. Yang, Angew. Chem., Int. Ed., 2013, 52, 3953–3957 CrossRef CAS PubMed
.
- W. Wei, C. Xu, L. Wu, J. Wang, J. Ren and X. Qu, Sci. Rep., 2014, 4, 3564 Search PubMed
.
- H. Li, X. He, Z. Kang, H. Huang, Y. Liu, J. Liu, S. Lian, C. H. Tsang, X. Yang and S. T. Lee, Angew. Chem., Int. Ed., 2010, 49, 4430–4434 CrossRef CAS PubMed
.
- A. G. Daniel and N. P. Farrell, Metallomics, 2014, 6, 2230–2241 RSC
.
- X. Wang, K. Qu, B. Xu, J. Ren and X. Qu, J. Mater. Chem., 2011, 21, 2445 RSC
.
- Y. Yang, J. Cui, M. Zheng, C. Hu, S. Tan, Y. Xiao, Q. Yang and Y. Liu, Chem. Commun., 2012, 48, 380–382 RSC
.
- C. Zhu, J. Zhai and S. Dong, Chem. Commun., 2012, 48, 9367–9369 RSC
.
- J. J. Zhang, W. Yang, J. P. Piquemal and P. Y. Ren, J. Chem. Theory Comput., 2012, 8, 1314–1324 CrossRef CAS PubMed
.
- P. Taheri, J. Wielant, T. Hauffman, J. R. Flores, F. Hannour, J. H. W. de Wit, J. M. C. Mol and H. Terryn, Electrochim. Acta, 2011, 56, 1904–1911 CrossRef CAS
.
- S. K. Bhunia, A. Saha, A. R. Maity, S. C. Ray and N. R. Jana, Sci. Rep., 2013, 3, 1473 Search PubMed
.
- H. Nie, M. Li, Q. Li, S. Liang, Y. Tan, L. Sheng, W. Shi and S. X.-A. Zhang, Chem. Mater., 2014, 26, 3104–3112 CrossRef CAS
.
- L. Cao, X. Wang, M. J. Meziani, F. Lu, H. Wang, P. G. Luo, Y. Lin, B. A. Harruff, L. M. Veca, D. Murray, S. Y. Xie and Y. P. Sun, J. Am. Chem. Soc., 2007, 129, 11318–11319 CrossRef CAS PubMed
.
- G. von Freymann, V. Kitaev, B. V. Lotsch and G. A. Ozin, Chem. Soc. Rev., 2013, 42, 2528–2554 RSC
.
- X. Guo, C. F. Wang, Z. Y. Yu, L. Chen and S. Chen, Chem. Commun., 2012, 48, 2692–2694 RSC
.
Footnote |
| † Electronic supplementary information (ESI) available. See DOI: 10.1039/c5ra27808b |
| This journal is © The Royal Society of Chemistry 2016 |

