Crystalline structures in tetracosane–asphaltene films

Salomé dos Santos*, Lily D. Poulikakos and Manfred N. Partl
Empa, Swiss Federal Laboratories for Materials Science and Technology, Überlandstrasse 129, CH-8600 Dübendorf, Switzerland. E-mail: salome.dossantos@empa.ch; Fax: +41 58 765 1122; Tel: +41 58 765 4801

Received 9th February 2016 , Accepted 15th April 2016

First published on 18th April 2016


Abstract

Waxes and asphaltenes are well known compounds in crude oil and related materials such as bituminous materials. In this study, the solid-like structures formed in mixtures of tetracosane, C24H50 paraffin, and asphaltenes were studied. The undulated structures that formed in films casted from dispersions of tetracosane and asphaltenes in toluene are identical to the undulated structures found on the surface of annealed bitumen films. Additionally, the growth of other crystalline forms was observed and the resulting structures also showed similarities with crystalline structures found in bitumen upon heating and cooling or increase in tetracosane content. The appearance of the undulated structures both after annealing of bitumen films and from solvent casting indicates that the undulated pattern is a result of phase behaviour and not of other physical phenomena such as buckling or wrinkling. To confirm this, in this work it is shown that tetracosane and asphaltenes segregate or demix, and mainly asphaltenes form the hills in the undulated structures. The results from this work will contribute to the understanding of the mechanism of the formation of wax–asphaltene structures which would be greatly appreciated by different communities working with petroleum-related materials.

Introduction

The deposition of components of petroleum as solid precipitates on surfaces of pipelines, reservoirs, etc. is a well-recognized production challenge. Typically, the precipitates are composed of asphaltenes, waxes or mixtures of both.1,2 To reduce or avoid deposition, it is necessary to understand which components are present in the precipitates and under which conditions they form. Therefore, the determination of the properties and phase behaviour of asphaltene–wax mixtures is an area of active research.3–5

Asphaltenes are complex molecules whose structure is difficult to determine and which additionally tend to aggregate in apolar media. However, it is generally accepted that they are composed of polycondensed aromatic rings containing a certain amount of hydrocarbon chains and heteroatoms such as sulphur, nitrogen and oxygen.6 Asphaltenes are also defined by their solubility in light aromatics such as benzene and toluene but insoluble in n-pentane or n-heptane.

The majority of waxes present in the petroleum induced deposits are high-molecular-weight paraffins. Interestingly but not surprisingly, precipitates that were so far presumably composed of mixtures of asphaltenes and waxes are also commonly found in bitumen, in particular if bitumen contains wax (in particular paraffin wax).

Bitumen is obtained from natural deposits or from petroleum distillation and is mostly used in the production of asphalt where it plays the role of the adhesive component “gluing” the stones together. It is also used as waterproofing material. In the asphalt field, the question whether the precipitates influence the mechanical properties of asphalt remains unanswered.7 In addition, the chemical composition of the precipitates remains unknown. Furthermore, in certain applications, wax is added to bitumen in order to decrease its viscosity, but the resulting change of the microstructure of bitumen is still under research. Moreover, the effect of the change in the ratio of asphaltenes to wax on wax crystallization is of great interest.8

Very often on the surface of annealed bitumen films, subjected to heating and cooling, precipitates show as solid domains exhibiting elongated or elliptical shapes depending on the amount of asphaltenes and wax, and at the center of these domains an undulated pattern appears.9–13 These structures have been called “bee” structures due to their appearance in atomic force microscopy (AFM) images. Pauli et al. have done a comprehensive study on the effect of adding different wax types and paraffins to different bitumens. Various structures were observed using AFM.14

Different hypotheses have been presented in the literature to explain the undulated pattern. One such hypothetical mechanisms is the wrinkling of the solid domain as a consequence of different thermal contraction of the domain and the matrix upon cooling.15 Other mechanisms seem to allude to the stresses and strains during crystallization of the waxes or due to crystal sectorization.16–18 In another study, it has been shown that in the undulated pattern, the valleys were mechanically weaker as compared with the hills, and it was hypothesized that the reason for this difference was the lower thickness of the valleys as compared with the hills.19 To date there is no consensus on the physicochemical phenomenon or the composition of those structures, although it is generally accepted that some form of wax crystals is part of such solid structures.

Moreover, recently it has been shown that by decreasing the cooling rate for the annealed bitumen films, the structures at the surface grow in size and/or change morphology.20 This is accompanied by an increase in crystallization degree of long alkyl hydrocarbon chains, because as the cooling rate decreases wax molecules have more time to phase separate from the matrix and crystallize into different crystalline morphologies.

In the present work, the structures obtained from dispersions of asphaltenes and tetracosane, C24H50 paraffin, casted from toluene solutions and on the surface of annealed bitumen films subjected to heating and cooling were studied. The objective of this work is to establish the connection between the structures observed in annealed bitumen and in simplified mixtures containing only a few of the bitumen components such as asphaltenes and paraffins (e.g. tetracosane). In this way, it is possible to understand the basis for the formation of the structures in particular the undulated structures.

Experimental

Materials

Tetracosane, C24H50 (99%), with molecular weight (MW) = 338.65 g mol−1 and melting point of 49–52 °C, was supplied by Sigma-Aldrich and used without further purification. n-Heptane (>99%) with MW = 100.2 g mol−1, was supplied by Acros Organics. Straight run bitumen with a penetration of 160/220 and containing natural wax was used.

Asphaltenes recovery

The asphaltenes were recovered from bitumen based on existing procedures21,22 in three steps to assure the purity of the asphaltenes as follows. About 10 g of bitumen was mixed with toluene at the mass ratio of 1[thin space (1/6-em)]:[thin space (1/6-em)]10 and sonicated for about 30 min at 20–35 °C, due to the temperature rising during sonication. Afterwards n-heptane was added to the mixture at the mass ratio 40[thin space (1/6-em)]:[thin space (1/6-em)]1 in relation to the original bitumen mass. The mixture was manually shaken for 5 min and left untouched to allow for precipitation and settling of the asphaltenes. After 3 days, the precipitate was separated by filtration under vacuum using a filter funnel with porosity of 10–16 μm and washed several times with fresh and hot (70–80 °C) n-heptane until the washing liquid became visually colourless. Hot heptane is used to remove wax components that might co-precipitate with the asphaltenes. The same procedure was repeated by adding toluene to the precipitated asphaltenes at the mass ratio of 10[thin space (1/6-em)]:[thin space (1/6-em)]1 and sonicate for about 30 min at 20–35 °C. Fresh n-heptane at the mass ratio 40[thin space (1/6-em)]:[thin space (1/6-em)]1 was added; the mixture was left for another 6 days and washed. A third step of addition of fresh n-heptane to the precipitated asphaltenes this time at a ratio 20[thin space (1/6-em)]:[thin space (1/6-em)]1 was taken, the mixture was left overnight, and the asphaltenes were washed with fresh n-heptane the day after. Thereafter, the asphaltenes were dried in air until no changes in weight were detected.

Addition of tetracosane to bitumen and annealing of bitumen films

The bitumen–tetracosane mixture containing 10 wt% of tetracosane was prepared by weighing 5 g bitumen and 0.5 g of tetracosane together, placing them in a ventilated oven for 10 min at 130 °C and thereafter mixing them vigorously by hand for 2–3 min and repeating the heating and mixing procedure to ensure good mixing. This percentage of tetracosane was chosen to ensure that crystalline structures were observed. The annealed bitumen films, both without and with added tetracosane were prepared by spreading the bitumen or the bitumen–tetracosane mixture on a glass surface by using a spatula at ∼23 °C and placing them in the oven at 110 °C for 20 min. Cooling was allowed either by fast and slow cooling rates.20 Slow cooling was used to ensure that diverse crystalline structures were observed due to crystal growth.

Asphaltene and tetracosane mixtures and solvent casted films

Mixtures containing asphaltenes and tetracosane were prepared by mixing 0.1 g of recovered asphaltenes and 0.1 g of tetracosane in 3 g of toluene and by dilution of this mixture 2 or 10 times. Solutions of asphaltenes and tetracosane alone were prepared similarly. After preparation, each mixture was left to equilibrate at least for 3 days to allow for a good dispersion/dissolution of the compounds in the solvent. The solvent casted films were prepared by placing a drop of the asphaltene–tetracosane mixture on top of the substrate. Different substrates (glass, metal, silicon) were used depending on the measurement method. A piece of clean paper was used to remove excess of solution in order to form thin films. The films were dried in a vacuum oven at 40 °C (below the melting temperature of tetracosane) for 48 h at 20 mbar.

Methods

Attenuated total reflectance Fourier transform infrared (ATR-FTIR) spectroscopy measurements were performed in a Tensor 27 spectrometer from Bruker in the ATR mode using a diamond crystal. The bitumen films were placed with the top bitumen surface against the diamond crystal. The spectra were collected in the 4000 to 600 cm−1 range with a resolution of 4 cm−1 and each final spectrum represented an accumulation of 32 spectra. AFM measurements were carried out at room temperature (∼23 °C) and using a Bruker MultiMode 8 atomic force microscope, with a Nanoscope V controller and the software Nanoscope 8.15. Bruker TAP150A tips (recommended for materials with an elastic modulus of 0.4 MPa–400 MPa) with the following properties: material 0.01–0.025 Ωm antimony (n) doped silicon; tip height 15–20 μm; spring constant 5 N m−1; resonance frequency 150 kHz; coated with Al-coating on the detector side. The tip radius was calibrated using the Bruker PS-LDPE reference and set as 20 nm in order to obtain information about the modulus using the peak force quantitative nanomechanical mode (PF QMN) as described elsewhere.23–25 The peak force used was 20 nN and the scan rate 0.5 Hz. Every image was built up by 256 × 256 pixels. Scanning electron microscopy (SEM) and energy dispersive X-ray (EDX) measurements were performed in a S-3700N Hitachi microscope.

Results and discussion

Fig. 1 shows ATR-FTIR spectra of tetracosane and annealed bitumen films using fast and slow cooling rates showing relevant bands. The cooling rates were reported in a previous study. They were measured as the bitumen film cooled down both when it was removed from the oven after 20 min at 110 °C and as it cooled down at the cooling rate of the oven after it was switched off.20
image file: c6ra03708a-f1.tif
Fig. 1 Selected parts ((a)–(c)) of ATR-FTIR spectra of tetracosane (Tet) dried from the solution of 0.1 g of tetracosane in toluene, virgin bitumen (Bit) and bitumen with 10 wt% added tetracosane (Bit 10 wt% Tet) annealed at 110 °C for 20 min and cooled fast (f) and slowly (s). The inset in (c) is a close up to show the splitting of the bands at ∼730 and ∼720 cm−1.

To complement the information in Fig. 1, Table 1 provides the characteristic common bands for bitumen and tetracosane.

Table 1 Approximate location of the common bands in ATR-FTIR spectra for bitumen and tetracosane and assignments of the some vibrational modes
Wavenumber (cm−1) Functional group and mode of vibration
2952 CH (CH3) asymmetric stretching
2918 CH (CH2, CH3) asymmetric stretching
2850 CH (CH2, CH3) symmetric stretching
1457 CH (CH2, CH3) asymmetric bending
1375 CH (CH3) symmetric bending
721 CH2 rocking vibration (long alkyl chains)


When crystals grow due to slow cooling or increase in wax concentration, changes in band intensity, location and shape at the wavenumbers 2920, 2850, 1480–1430 and 735–715 cm−1 occurred. For instance the ratio between the area under the bands 2918 and 2850 cm−1 in the range 2945–2800 cm−1 and the area under the band 1375 cm−1 in the range 1393–1355 cm−1, increased from 13.7 for Bit – f to 23.6 for Bit 10 wt% Tet – s, with the values 16.3 for Bit – s and 19.7 for Bit 10 wt% Tet – f. Splitting, shifting to lower wavenumbers and increasing of peak intensity are related to the increase of the crystallization degree;26 shifting for the peaks at 2920 and 2850 cm−1 are due to the conformational transformation of the alkyl chains from gauche to all trans by rotation about a single bond27–32 and the splitting of the peaks at 1480–1430 and 735–715 cm−1 is due to the self-assembly of long alkyl chains in particular into ordered structures such as orthorhombic (as it can be observed in the wax crystallites).27–32

The AFM topography images of the annealed bitumen surfaces corresponding to the samples presented in Fig. 1 are presented in Fig. 2.


image file: c6ra03708a-f2.tif
Fig. 2 AFM images of the annealed bitumen surfaces of (a) and (b) virgin bitumen and (c) bitumen with 10 wt% added tetracosane annealed at 110 °C for 20 min and cooled fast (f) and slow (s). The close up in (a) shows the branching of the undulated pattern, and the close up in (b) shows the corresponding Derjaguin–Müller–Toporov (DMT) modulus where the depths in the topography image correspond to the high modulus of growing crystalline forms.

The AFM image in Fig. 2a shows undulated structures on the surface of annealed virgin bitumen, showing additionally branching of the undulated structures. In Pauli et al. the branching of the undulated structures was seen when the wax content in bitumen was increased.14 Fig. 2b and c show other morphologies due to crystal growth. The roughness of the annealed bitumen surface that is cooled slowly shown in Fig. 2b seems to result from the sinking of large crystal structures. These structures present higher modulus as shown in Fig. 2b. As the concentration of wax is increased lamellar structures are also observed (Fig. 2c). The results from AFM corroborate the ATR-FTIR results described above.

To establish the qualitative correspondence between the phenomena observed in bitumen films with the simplified mixtures of asphaltenes and tetracosane, the spectra for asphaltenes, tetracosane and a dried (in air) mixture of 0.05 g of tetracosane and 0.05 g of asphaltenes from toluene solution is shown in Fig. 3.


image file: c6ra03708a-f3.tif
Fig. 3 Selected parts ((a)–(c)) of ATR-FTIR spectra of 0.1 g of tetracosane (Tet) and 0.1 g asphaltenes (As) dried (in air) from toluene solution and of the mixture 0.05 g of tetracosane and 0.05 g of asphaltenes (TetAs0.05/0.05) also dried (in air) from toluene solution.

Apart from the common spectral bands observed for bitumen, asphaltenes and tetracosane, the most interesting result presented in Fig. 3, is the appearance of the band at 730 cm−1 for the mixture of asphaltenes and tetracosane (Fig. 3c). This shows that when asphaltenes are present in the crystals, other ordered structures such as orthorhombic structures form,27–32 which is not visible in the asphaltenes or tetracosane alone.

Fig. 4 shows optical microscopy images of some examples of the structures that form in toluene casted tetracosane–asphaltene films.


image file: c6ra03708a-f4.tif
Fig. 4 Optical microscopy images of tetracosane–asphaltene structures of the mixture 0.01 g of tetracosane and 0.01 g of asphaltenes (TetAs0.01/0.01) in toluene spread on glass and dried in air. Examples of different structures formed: (a) undulated structure with periphase and crystal growth; (b) branching of the undulated structure; (c) lost undulation as the crystals grow; and (d) other example of crystal growth. The colours are due to interference with light due to variations in thickness.

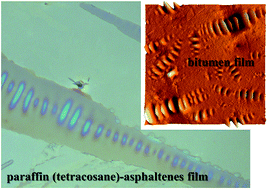
The different structures formed in the films have a direct connection to the structures observed in the annealed bitumen films as shown in Fig. 2. Fig. 4a shows the undulated structure identical to the undulated pattern in bitumen annealed films. The structure presents the undulation at the center of an elongated domain, with material around the undulated center, the “periphase” as it would be called in the bitumen field.

Fig. 4b shows the branching as the crystals grow, as it is common in crystallization processes. The undulated structures are still observed in those branches. Similar branching is seen in Fig. 2a.

Other examples of this type of branching in bitumen films can be found in literature upon addition of wax to bitumen.14 The growth of the crystals noticed at the edges of the “periphase” as marked in Fig. 4a, have also been observed in bitumen surfaces.33,34 When the crystals grow, the undulation is lost (Fig. 4b and c). Fig. 4d shows further crystal growth forming branched structures which is also observed in bitumen films when cooling rate is decreased or higher concentration of wax is present (Fig. 2b and c). From Fig. 4 it is possible to see that hills and valleys of the undulated structure have different thicknesses as already hypothesized in a previous study.19

Fig. 5 shows AFM images of the undulated structure produced from toluene solution with the mixture of 0.01 g of tetracosane and 0.01 g of asphaltenes on glass.


image file: c6ra03708a-f5.tif
Fig. 5 Structures presented in tetracosane–asphaltene films on glass produced from toluene solution with the mixture of 0.01 g of tetracosane and 0.01 g of asphaltenes (TetAs0.01/0.01), in particular the undulated structure. (a) Optical image from optical microscope mounted in the AFM instrument; (b) corresponding AFM topography image of the area marked with a square in the optical image; and (c) another example showing crystal growth.

In the AFM topography images shown in Fig. 5, it is possible to see that the undulated structures are very thin, in the order of tens of nanometers in the “periphase” and some few hundreds of nanometers at maximum in the hills of the undulated structures. It seems that the “periphase” is built in layers (Fig. 5b) and that, as crystals grow, some of the layers are “consumed” at the expense of the crystal growth (Fig. 5c). The crystal growth is also observed at the edges of the “periphase”.

The individual compounds, asphaltenes or tetracosane were investigated separately using optical microscopy and AFM and they do not form these structures. This means that the undulated structures and other types of crystalline structures form when both asphaltenes and tetracosane are mixed.

In order to understand how the asphaltenes and tetracosane are distributed in the undulated structure scanning electron microscopy (SEM) and energy dispersive X-ray (EDX) experiments were performed and shown in Fig. 6.


image file: c6ra03708a-f6.tif
Fig. 6 SEM secondary electrons (SE) and EDX images for silicon (substrate), carbon and sulphur of structures in tetracosane–asphaltene films prepared from the toluene solution of the mixture of 0.01 g of tetracosane and 0.01 g of asphaltenes (TetAs0.01/0.01) on silicon.

Fig. 6 shows that the hills are characterized by a higher concentration of carbon and sulphur and less of silicon (substrate). This higher concentration shows that the hills are thicker than the valleys of the undulated structure and that they contain asphaltenes as only asphaltenes would contain sulphur. Some thicker structures (other crystal and aggregate forms) do not show sulphur, because they are probably mainly constituted of tetracosane. This shows that the crystals and other aggregates may be composed of different ratios of the two compounds.

To additionally confirm that the hills of the undulated structures have a different composition from the other parts of the undulated structure and “periphase”, i.e. that the undulated structure forms due to segregation (demixing) of tetracosane and asphaltenes, the structures were exposed to high temperature (100 °C) well above the melting point of tetracosane (49–52 °C). A sample of the results is shown in Fig. 7.


image file: c6ra03708a-f7.tif
Fig. 7 Optical microscopy images from AFM microscope and topography images of the respective marked area of the tetracosane–asphaltene structures prepared from toluene solution of the mixture of 0.01 g of tetracosane and 0.01 g of asphaltenes (TetAs0.01/0.01) on stainless steel; (a) at room temperature (height of periphase around 40 nm) and (b) after being exposed to 100 °C for 4 h (height of periphase 0 nm).

Fig. 7 shows that the structures or parts of the structures formed mainly by tetracosane that melts already at 49–52 °C melt as shown by the disappearance of the structures for instance on the top of the optical microscope image from Fig. 7a to b. However, the hills of the undulated structure persist even after 100 °C. This indicates that the hills could only be mainly formed by asphaltenes.

With these results it is shown that the main phenomena that leads to the formation of the undulated structure is segregation (demixing) of tetracosane and asphaltenes, and that it is not due to other physical phenomena such as wrinkling/buckling/rippling from thermal or volume contraction. The segregation of the two compounds resembles the spinodal decomposition phenomena observed in polymer systems.35,36

Conclusions

This work showed structures that formed due to segregation and crystal growth in tetracosane–asphaltene mixtures casted from toluene. These structures have direct correlation with the structures observed in annealed bitumen films. The appearance of such structures after annealing of bitumen films and from solvent casting indicates that the undulated pattern is mainly a result of phase behaviour and not a result of other physical phenomena, such as wrinkling, volume contraction of some phases or crystallization sectorization, as suggested in some literature reviews. As a proof, this work showed that the hills of the undulated structure are mainly formed by asphaltenes. Therefore, with this work, the discussion about the mechanisms of the formation of the undulated pattern may gain a new direction. Other structural formations occurring as a result of crystallization are also found both on the annealed bitumen surfaces and on the tetracosane–asphaltene films. Moreover, this work shows that by using simplified mixtures, e.g. tetracosane mixed with asphaltenes, it is possible to obtain answers about phenomena occurring in much more complex systems, e.g. bitumen.

Acknowledgements

The authors thank the Swiss National Science Foundation (SNSF 200020_152980/1) for financial support. The authors thank Martin Sauder and Alessandra Beni for the help with SEM and AFM measurements.

References

  1. A. Aiyejina, D. P. Chakrabarti, A. Pilgrim and M. K. S. Sastry, Int. J. Multiphase Flow, 2011, 37, 671–694 CrossRef CAS.
  2. P. Kriz and S. I. Andersen, Energy Fuels, 2005, 19, 948–953 CrossRef CAS.
  3. L. A. Alcazar-Vara, J. A. Garcia-Martinez and E. Buenrostro-Gonzalez, Fuel, 2012, 93, 200–212 CrossRef CAS.
  4. Y. M. Ganeeva, T. N. Yusupova, G. V. Romanov, A. T. Gubaidullin and A. I. Samigullina, J. Therm. Anal. Calorim., 2015, 122, 1365–1373 CrossRef CAS.
  5. A. Z. Tukhvatullina, E. E. Barskaya, V. N. Kouryakov, Y. M. Ganeeva, T. N. Yusupova and G. V. Romanov, J. Pet. Environ. Biotechnol., 2013, 4, 152 Search PubMed.
  6. D. Lesueur, Adv. Colloid Interface Sci., 2009, 145, 42–82 CrossRef CAS PubMed.
  7. A. Schmets, N. Kringos, T. Pauli, P. Redelius and T. Scarpas, Int. J. Pavement Eng., 2010, 11, 555–563 CrossRef CAS.
  8. M. Simonen, T. Blomberg, T. Pellinen and J. Valtonen, Road Mater. Pavement Des., 2013, 14, 36–48 CrossRef CAS.
  9. L. Loeber, O. Sutton, J. Morel, J. M. Valleton and G. Muller, J. Microsc., 1996, 182, 32–39 CrossRef CAS.
  10. J. F. Masson, V. Leblond and J. Margeson, J. Microsc., 2006, 221, 17–29 CrossRef CAS PubMed.
  11. A. T. Pauli, J. F. Branthaver, C. M. Eggleston and W. Grimes, Abstracts of Papers of the American Chemical Society, 2001, 221, U220 Search PubMed.
  12. R. Jäger AL, C. Eisenmenger-Sittner and R. Blab, Road Mater. Pavement Des., 2004, 5, 9–24 CrossRef.
  13. H. Soenen, J. Besamusca, H. R. Fischer, L. D. Poulikakos, J. P. Planche, P. K. Das, N. Kringos, J. R. A. Grenfell, X. H. Lu and E. Chailleux, Mater. Struct., 2014, 47, 1205–1220 CrossRef CAS.
  14. A. T. Pauli, R. W. Grimes, A. G. Beemer, T. F. Turner and J. F. Branthaver, Int. J. Pavement Eng., 2011, 12, 291–309 CrossRef CAS.
  15. A. L. Lyne, V. Wallqvist, M. Rutland, P. Claesson and B. Birgisson, J. Mater. Sci., 2013, 48, 6970–6976 CrossRef CAS.
  16. H. S. Fischer, H. Stadler and N. Erina, J. Microsc., 2013, 250, 210–217 CrossRef CAS PubMed.
  17. H. R. Fischer and A. Cernescu, Fuel, 2015, 153, 628–633 CrossRef CAS.
  18. T. Pauli, W. Grimes, J. Beiswenger and A. J. M. Schmets, J. Mater. Civ. Eng., 2015, 27, C4014001 CrossRef.
  19. S. dos Santos, M. N. Partl and L. D. Poulikakos, Construct. Build. Mater., 2014, 71, 618–627 CrossRef.
  20. S. dos Santos, L. D. Poulikakos and M. N. Partl, 8th RILEM International Symposium on Testing and Characterization of Sustainable and Innovative Bituminous Materials, RILEM Bookseries 11, Springer, 2015, pp. 903–913 Search PubMed.
  21. L. Goual, M. Sedghi, X. X. Wang and Z. M. Zhu, Langmuir, 2014, 30, 5394–5403 CrossRef CAS PubMed.
  22. P. Tchoukov, F. Yang, Z. H. Xu, T. Dabros, J. Czarnecki and J. Sjoblom, Langmuir, 2014, 30, 3024–3033 CrossRef CAS PubMed.
  23. H. R. Fischer, H. Stadler and N. Erina, J. Microsc., 2013, 250, 210–217 CrossRef CAS PubMed.
  24. X. Yu, M. Zaumanis, S. dos Santos and L. D. Poulikakos, Fuel, 2014, 135, 162–171 CrossRef CAS.
  25. A. L. Lyne, V. Wallqvist and B. Birgisson, Fuel, 2013, 113, 248–256 CrossRef CAS.
  26. G. Ungar and N. Masic, J. Phys. Chem., 1985, 89, 1036–1042 CrossRef CAS.
  27. S. P. Srivastava, J. Handoo, K. M. Agrawal and G. C. Joshi, J. Phys. Chem. Solids, 1993, 54, 639–670 CrossRef CAS.
  28. J. B. Brubach, V. Jannin, B. Mahler, C. Bourgaux, P. Lessieur, P. Roy and M. Ollivon, Int. J. Pharm., 2007, 336, 248–256 CrossRef CAS PubMed.
  29. J. A. Heredia-Guerrero, R. de Lara, E. Dominguez, A. Heredia, J. Benavente and J. J. Benitez, Chem. Phys. Lipids, 2012, 165, 803–808 CrossRef CAS PubMed.
  30. Y. Jian, Y. He, J. Wang, B. B. Xu, W. T. Yang and J. Nie, New J. Chem., 2013, 37, 444–450 RSC.
  31. D. Borchman, G. N. Foulks, M. C. Yappert, J. Bell, E. Wells, S. Neravetla and V. Greenstone, Invest. Ophthalmol. Visual Sci., 2011, 52, 3805–3817 CAS.
  32. L. A. Alcazar-Vara and E. Buenrostro-Gonzalez, J. Therm. Anal. Calorim., 2012, 107, 1321–1329 CrossRef CAS.
  33. S. dos Santos, M. N. Partl and L. D. Poulikakos, Composites, Part B, 2015, 80, 177–185 CrossRef CAS.
  34. B. S. Pizzorno, E. R. Dourado, M. B. de Moraes, R. A. Simão and F. M. Leite, Pet. Sci. Technol., 2014, 32(22), 2738–2745 CrossRef CAS.
  35. P. G. Degennes, J. Chem. Phys., 1980, 72, 4756–4763 CrossRef CAS.
  36. E. P. Favvas and A. C. Mitropoulos, J. Eng. Sci. Technol. Rev., 2008, 1, 25–27 CAS.

This journal is © The Royal Society of Chemistry 2016