 Open Access Article
Creative Commons Attribution 3.0 Unported Licence
Electrical characterization of amorphous LiAlO2 thin films deposited by atomic layer deposition
Yang
Hu
*a,
Amund
Ruud
a,
Ville
Miikkulainen
b,
Truls
Norby
a,
Ola
Nilsen
a and
Helmer
Fjellvåg
a
aCentre for Materials Science and Nanotechnology, Department of Chemistry, University of Oslo, P.O. Box 1126, Blindern, NO-0318 Oslo, Norway. E-mail: yang.hu@smn.uio.no
bLaboratory of Inorganic Chemistry, University of Helsinki, P.O. Box 55, FI-00014 Helsinki, Finland
First published on 7th June 2016
Abstract
LiAlO2 thin films deposited by atomic layer deposition (ALD) have a potential application as an electrolyte in three-dimensional (3D) all-solid-state microbatteries. In this study, Li-ion conductivity of such films is investigated by both in-plane and cross-plane methods. LiAlO2 thin films with a Li composition of [Li]/([Li] + [Al]) = 0.46 and an amorphous structure were grown by ALD with thicknesses of 90, 160 and 235 nm on different substrates. The electrical characterization was conducted by impedance spectroscopy using inert electrodes over a temperature range of 25–200 °C in an inert atmosphere. In-plane conductivities were obtained from films on insulating sapphire substrates, whereas cross-plane conductivities were measured from films on conducting titanium substrates. For the first time, comparison of the in-plane and cross-plane conductivities in these ALD LiAlO2 films has been achieved. More comparable results are obtained using a cross-plane method, whereas in-plane conductivity measurements demonstrate a considerable thickness-dependence with thinner film thickness. The room-temperature conductivity of the LiAlO2 films has been determined to be in the order of 10−10 S cm−1 with an activation energy of ca. 0.8 eV.
1. Introduction
Future Li-ion battery designs may rely on the utilization of suitable solid-state electrolytes. Their application will circumvent the safety hazards associated with the release of flammable and poisonous gases during the decomposition of liquid electrolytes and allow for a larger degree of freedom in the design of the battery structures.1 The major obstacle with the introduction of such solid-state electrolytes is their low ionic conductivity, which can be compensated for by the utilization of thinner electrolytes, provided they can be deposited as pinhole-free films.2–4 For a conventional two-dimensional (2D) design using thin film electrolytes, a room temperature conductivity above 10−6 S cm−1 (ref. 5 and 6) is required such as the state-of-the-art lithium phosphorus oxynitride (LiPON) thin film. However, this 2D design suffers from a limited capacity per footprint area (A h cm−2) and a low power density. Therefore, the current focus for all-solid-state batteries is the realization of three-dimensional (3D) microbattery designs, which can appreciably enhance the active electrode area inside the batteries and thus increase the power density.1,7,8 A key factor is a thin film process capable of depositing homogeneous and pinhole-free films onto complex structures with large surface areas. Atomic layer deposition (ALD) has proven to be a promising technique for such applications.9 It is based on self-limiting gas-to-surface reactions that ensure highly conformal growth over complex geometrical shapes.10 Previous work has suggested ALD as a potential and suitable tool for achieving both solid-state and nanostructured designs for Li-ion batteries, opening up new possibilities for materials and architectures in 3D all-solid-state batteries.11–13The deposition of Li-containing thin films by ALD was first reported in 2009 (ref. 9) for the formation of Li2CO3. Since then, ALD has been applied as coating barrier layers onto electrode materials in traditional Li-ion batteries with a liquid electrolyte to minimize the so-called solid electrolyte interface (SEI) formation, as well as for the deposition of active battery electrode materials.14–16 The exploitation of thin film solid-state Li-ion electrolytes by ALD is still considered immature, and there are very few reports on the Li-ion conductivity of the deposited films. Liu et al. obtained a room-temperature conductivity of 2 × 10⁻⁸ S cm−1 for a Li5.1TaOz ALD thin film.12 Aaltonen et al. deposited Li2O–Al2O3 thin films, which were targeted as a barrier layer between the Li anode and the lithium lanthanum titanate [(Li, La)xTiyOz, LLT] electrolyte,11 and they obtained an ionic conductivity of 1 × 10⁻⁷ S cm−1 at 300 °C for the film subjected to a post-annealing process at 700 °C for 5 h, which may have induced crystallization of the as-deposited amorphous structure. Recently, Park et al.17 investigated LiAlO2 ALD films with a thickness of 50 nm grown onto quartz substrates and obtained a promising room-temperature conductivity of 5.6 × 10⁻⁸ S cm−1 in ambient air. Very recently, Kozen et al. deposited LiPON by ALD and obtained a conductivity of 1.45 × 10⁻⁷ to 3 × 10⁻⁷ S cm−1 with increasing N content (1.8% to 16.3%).18 However, this conductivity was extracted from the impedance measured in a LiPON/organic liquid electrolyte/Li metal coin cell using LiPON as a working electrode, and it is not unambiguous to assign the result to the bulk conductivity of the electrolyte. It can be noted that in some of the aforementioned studies, the conductivity of Li-containing thin films is measured at higher temperature (>100 °C). This may be due to high measured resistances that are beyond the instrument's capability, arising from low ionic conductivity and the commonly used in-plane geometry.
Characterization of electrical conductivity of thin films or membranes can be performed through two different geometrical configurations, as demonstrated in Fig. 1. One comprises cross-plane conductivity of films deposited either directly onto a conducting substrate (e.g. stainless steel, Ti) or onto a conducting interlayer (e.g. platinum) coated on an insulating support substrate (e.g. sapphire, Al2O3).19,20 The conducting substrate or the interlayer serves as the bottom electrode, and the top electrode is deposited on the surface of the film. The cross-plane conductivity configuration has been widely applied for the characterization of solid-state electrolytes in Li-ion batteries; however, most reports are on bulk films with thicknesses in the micron range.19,21 For thin films, the application of this geometry is limited by short-circuits due to inherent pinholes, micro-cracks, structural changes, and thermal effects at elevated temperatures as well as damage caused by experimental handling. An alternative configuration is the in-plane geometry,22,23 where films are deposited onto an insulating substrate, with 2 or 4 co-planar electrodes on the film surface. This configuration gives rise to a wider choice of substrates and circumvents the aforementioned short-circuit issues, but does not reflect the conductivity in the direction intended for electrolyte application and can be affected by anisotropy caused by the texture and other structural effects such as grain boundaries and interfacial lattice mismatch. Moreover, in-plane measurements on resistive systems may be influenced by a parasitic parallel surface, interface, and substrate conductance. From a practical point of view, characterization of conductivity on thin films with a thickness down to the nanometer-scale introduces extra challenges. It is also necessary to carefully control the atmosphere and temperature range to maintain a pristine amorphous state.
The present study aims to investigate the electrical conductivity of LiAlO2 thin films prepared by ALD, which has been suggested as an alternative electrolyte11 or protection layer24 showing good stability with currently used electrode materials. Both in-plane and cross-plane measurements were performed on LiAlO2 thin films deposited onto insulating sapphire and conducting Ti substrates, respectively. Room-temperature conductivity is readily measured, and the temperature-dependent ionic conductivities were obtained up to 200 °C. Results from in-plane and cross-plane methods were compared with three different film thicknesses.
2. Experimental
Thin films of nominal composition LiAlO2 were prepared by Atomic Layer Deposition (ALD) using a modified process based on the one described previously.11 All films were deposited using an ASM F-120 Sat reactor at 225 °C. Trimethyl aluminium (TMA) (Witco GmbH, 98%) was used as the aluminium source and lithium trimethyl silanolate (LiTMSO) (Aldrich, 97%) as the lithium source. Ozone (O3, concentration ∼200 g N−1 m−3), generated by an IN USA AC series ozone generator from oxygen (99.6% O2, AGA) and water (H2O, 25 °C), was used as the oxygen source. N2 (g) was used as a pulse and purge gas, generated by a Schmidlin-Sirocco 5 generator (99.999% purity considering N2 + Ar). LiAlO2 was deposited from the pulsing sequence [TMA (0.5 s pulse/3 s purge) + O3 (3/5) + LiTMSO (5/2) + H2O (0.5/5)].The films were deposited onto conducting Ti (ASTM, Astrup AS), insulating sapphire (α-Al2O3 (0001), UniversityWafer) and Si (111) (Coating And Crystal Technology Inc.) substrates. The latter was used as a reference sample for thickness, structure and composition analyses. The film thickness was determined by spectroscopic ellipsometry (alpha-SE, J. A. Woollam Co., using the Cauchy function) using films on Si substrates. The structure of the as-deposited films and films annealed at 600 °C and 950 °C in air was investigated by X-ray diffraction (XRD, Bruker D8 Discover) analysis of the film on a Si (111) substrate. The elemental composition was determined by the time-of-flight elastic recoil detection analysis (TOF-ERDA), yielding an atomic ratio of Li![[thin space (1/6-em)]](https://www.rsc.org/images/entities/char_2009.gif) :
:![[thin space (1/6-em)]](https://www.rsc.org/images/entities/char_2009.gif) Al = 1
Al = 1![[thin space (1/6-em)]](https://www.rsc.org/images/entities/char_2009.gif) :
:![[thin space (1/6-em)]](https://www.rsc.org/images/entities/char_2009.gif) 1.16, denoted as LiAlO2 in this study, with a lithium cation content ratio [Li]/([Li] + [Al]) close to 0.46 for the as-deposited films.
1.16, denoted as LiAlO2 in this study, with a lithium cation content ratio [Li]/([Li] + [Al]) close to 0.46 for the as-deposited films.
Electrodes comprising a 100 nm Pt film on a 5 nm Ti adhesion layer were deposited by e-beam evaporation (Leybold DC V 6–12 kV). The growth rate was 0.2 Å s−1 for Ti and 0.3–0.5 Å s−1 for Pt. Parallel band electrodes were made on the surface of LiAlO2 films on a sapphire substrate for in-plane conductivity measurements. Multiple round electrodes with a diameter of 3 mm were applied to the films on the Ti substrate for cross-plane conductivity measurements. These Pt electrodes were firstly examined to exclude the area in the film from pinholes. Au wires were attached on top of the Pt electrodes using Ag paste (Aldrich, 735825-25G) and dried at 120 °C for 1 h in ambient air to obtain softer contacts and minimize risks of film damage. The prepared samples were placed in a ProboStat sample holder (NorECs, Norway) for the conductivity measurements, and an outer steel tube was used to shield the system and contain the controlled atmosphere. The configurations of in-plane and cross-plane measurements utilized in this study are illustrated in Fig. 1. The Pt electrode/film cross-section of a 90 nm film on a Si (111) substrate was cut by Focused Ion Beam (FIB) (FEI Helios NanoLab) and observed by SEM-EDX (HITACHI SU8230–Bruker Quantax). Scanning electron microscopy (Quanta 200 FEI) was used for the top view of the electrodes after electrical measurements.
The electrical conductivity was measured by two-electrode impedance spectroscopy (Novocontrol Alpha-A + POT/GAL 15V 10A, Novocontrol Technologies) over a frequency range from 1 MHz to 0.05 Hz with an AC amplitude of 50 ca. 70 mV (50 mV rms). Room-temperature conductivities were measured in ambient air, and the temperature-dependent measurements were performed in dry Ar from room temperature to ∼200 °C at heating and cooling rates of 2 °C min−1. At each temperature, a stabilization period of 30 min was applied prior to data acquisition. The impedance spectra obtained were analyzed in terms of equivalent circuits using ZView2 software (Scribner Associates Inc.). The conductivity was calculated by the resistance obtained from the data fitting R and the in-plane or cross-plane geometrical considerations, as shown in eqn (1) and (2), respectively:
 | (1) |
 | (2) |
3. Results and discussions
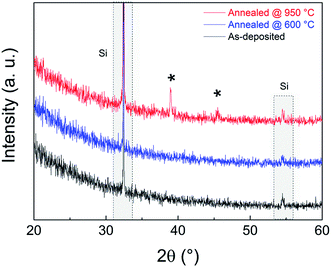
The amorphous structure of the LiAlO2 films investigated in this study is confirmed by XRD, as shown in Fig. 2. Both the as-deposited film and the film annealed at 600 °C exhibit amorphous structures. The transition to a crystalline structure is observed in the films annealed to 950 °C.The FIB-cut 90 nm LiAlO2 film on a Si (111) substrate after Pt deposition exemplifies the cross-sectional morphology of an electrode/film interface (Fig. 3), displaying a good connection between Pt layer and LiAlO2 film. Top-view SEM images of the electrode contacts shows that the e-beam evaporated Pt electrodes exhibited good adhesion and stability under the experimental conditions of this study (Fig. 4). No distinct delamination of the Pt layer or agglomeration of Pt grains was observed after the thermal cycles irrespective of the substrate. Only minor cracks/fissures were visible close to the Ag/Pt boundary, which is believed to have only a negligible effect on the measurements.
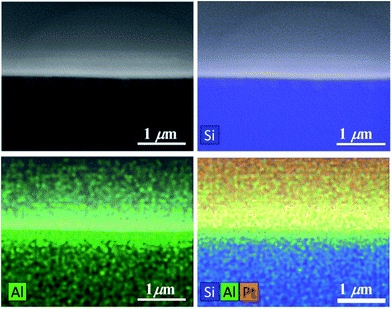 | ||
| Fig. 3 Cross-sectional SEM-EDX of a reference 90 nm-LiAlO2 film on an Si (111) substrate with Pt coated on top of the film. | ||
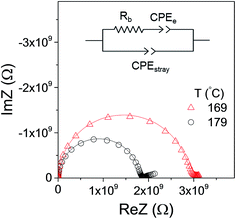
The electrical conductivity of the as-deposited LiAlO2 films with three thicknesses, 90, 160 and 235 nm, was investigated by impedance spectroscopy. Fig. 5 shows the Nyquist plots of the in-plane impedance of the 160 nm LiAlO2 film on a sapphire substrate. Typical impedance spectra comprise one semi-circle in the high-frequency region and a low-frequency inclined line. The high-frequency semi-circle can be ascribed to the response of the bulk film, presumably reflecting Li-ion conduction. The low-frequency inclined line represents the impedance of the Li-ion-blocking electrode/electrolyte interface, which is commonly considered as a typical indication of predominantly ionic conduction in the electrolyte.25–27 The equivalent circuit used to model the impedance spectrum is shown as an inset in Fig. 5, in which Rb represents the bulk resistance of the film and is used to calculate the conductivity using eqn (1). The constant phase element CPEe takes into account the capacitive contribution of the electrodes associated with the accumulation of charge carrying ions at the electrolyte/electrode interface. Due to the small cross-sectional area of the conductivity pathway, resulting from the small film thickness, the geometrical capacitance of the bulk film becomes very small and is completely masked by the stray capacitance CPEstray from the substrate and setup.28,29
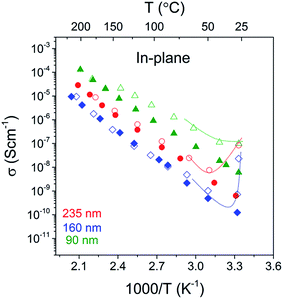
The in-plane conductivities of the 90, 160 and 235 nm LiAlO2 films obtained from impedance spectra are shown as a function of temperature in Fig. 6. The conductivities increase exponentially with increasing temperature, indicating a thermally activated conduction mechanism. However, anomalously high conductance was observed when measured in ambient air or at the beginning of heating in dry Ar, as indicated by the curves in Fig. 6. This is attributed to residual water remaining from the ALD cycling or surface adsorbed water from ambient air, giving rise to an additional fast conduction pathway along the surface. When measured in dry atmospheres (here dry Ar), it is permanently eliminated after initial heating. The obtained conductivities otherwise show good reproducibility between increasing and decreasing temperature and can be interpreted and fitted according to an Arrhenius-type behavior for diffusing carriers:
σT = σ0![[thin space (1/6-em)]](https://www.rsc.org/images/entities/char_2009.gif) exp(−Ea/kT) exp(−Ea/kT) | (3) |
| Thickness (nm) | 90 | 160 | 235 | |||
| Geometry | In-plane | Cross-plane | In-plane | Cross-plane | In-plane | Cross-plane |
| σ 300 K (S cm−1) | 5.1 × 10⁻⁹ | 2.4 × 10⁻¹⁰ | 1.0 × 10⁻¹⁰ | 2.8 × 10⁻¹⁰ | 4.3 × 10⁻¹⁰ | 2.5 × 10⁻¹⁰ |
| σ 0 (S cm−1 K−1) | 1.9 × 10⁶ | 7.4 × 10⁶ | 1.3 × 10⁶ | 1.5 × 10⁵ | 2.1 × 10⁶ | 6.1 × 10⁶ |
| E a (eV) | 0.72(1) | 0.85(2) | 0.82(2) | 0.73(1) | 0.79(1) | 0.84(2) |
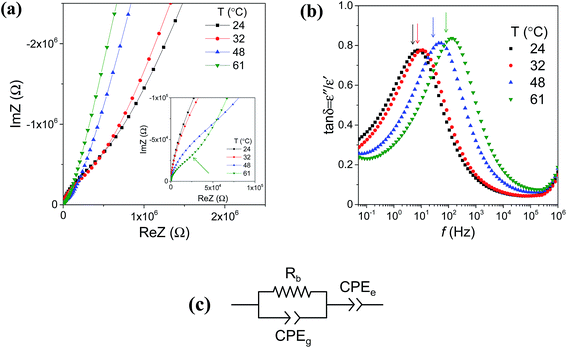
Fig. 7 shows the cross-plane complex impedance of a 160 nm LiAlO2 thin film on a Ti substrate. In this geometry, both contributions of the bulk thin film and the electrodes can be observed at low temperature (Fig. 7(a)). It can be fitted using the equivalent circuit depicted in Fig. 7(c). A high-frequency semi-circle associated with the contribution from the bulk thin film is represented by the bulk resistance Rb in parallel, with a capacitive CPEg mainly representing the geometrical capacitance of the thin film material. The low-frequency linear part of the curve is typical of a blocking electrode (CPEe), indicating the ionic characteristics of the conduction. It can be noted that the stray capacitance, which was dominating in the in-plane impedance spectra, is relatively small here in the cross-plane geometry compared to the capacitive contribution of the bulk film and can thus be neglected. Loss tangent plots help to distinguish between the high- and low-frequency regions, as shown in Fig. 7(b). The peak value in the tan![[thin space (1/6-em)]](https://www.rsc.org/images/entities/char_2009.gif) δ spectra (indicated by the arrows) separates the electrode process towards lower frequency. It evolves to higher frequency with increasing temperature, as exemplified here from 24 to 61 °C, due to a decrease in the time constant of the corresponding bulk and electrode transport processes.
δ spectra (indicated by the arrows) separates the electrode process towards lower frequency. It evolves to higher frequency with increasing temperature, as exemplified here from 24 to 61 °C, due to a decrease in the time constant of the corresponding bulk and electrode transport processes.
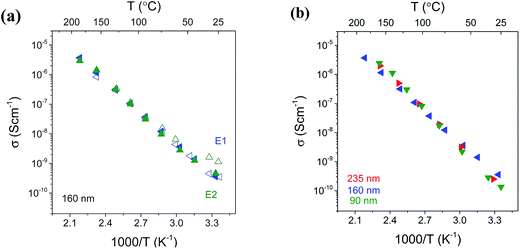
The reproducibility of the conductivities obtained with the cross-plane configuration was examined by measuring two electrodes on the same thin film sample at each temperature, as exemplified in Fig. 8(a) for the 160 nm LiAlO2 film. The good agreement indicates a good uniformity in the film and the deposited electrodes. During the first heating process (Fig. 8(a), open symbols), there was no remarkable conductivity enhancement at low temperature, and reproducible results were observed over the entire temperature range (RT – 200 °C). In comparison to the in-plane measurement, the cross-plane method thus proves to be less sensitive to adsorbed water, which is reasonable since the cross-plane conduction pathway within the film lies between the Ti substrate and Pt electrode, without the surface being exposed to ambient air. Moreover, the films and electrodes exhibit a good thermal stability over the investigated temperature range. Fig. 8(b) shows the Arrhenius plots of conductivity obtained from 90, 160 and 235 nm LiAlO2 thin films. A good agreement is evidenced using the cross-plane method without considerable thickness-dependence. Compatible room-temperature conductivity is obtained for 90, 160 and 235 nm LiAlO2 films being 2.4 × 10⁻¹⁰, 2.8 × 10⁻¹⁰ and 2.5 × 10⁻¹⁰ S cm−1, respectively.
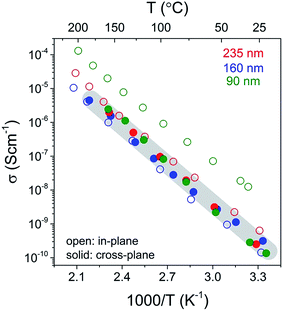
A summary of the conductivity in these LiAlO2 films is presented in Fig. 9 which shows the comparison of the thickness and geometry configurations. The room-temperature conductivities, activation energies and the pre-exponential factors obtained from the Arrhenius relation are listed in Table 1. The ionic conductivity of materials with a single charge carrier can be expressed in terms of the charge mobility and the concentration of charge carriers, with the diffusion coefficient being derived by the Nernst–Einstein relationship:
 | (4) |
The variation of in-plane conductivities in the 90, 160 and 235 nm films might be due to the structural modulation or the hetero-interface effect such as film/substrate misfit, which commonly leads to a thickness-dependence in the in-plane conductivity.31 One may also consider the variation in charge carrier density to be related to the space charge layer (SCL), which will be more pronounced in thin films with a thickness comparable to the length of the SCL region. For example, Li et al. studied the in-plane conductivity of LiPON thin films32 and reported what was interpreted as a transition from ionic conductivity to mixed ionic–electronic conductivity when the film thickness was reduced from 50 nm to 40 nm due to the electronic conduction induced by an enlarged SCL region in heterojunctions. Furthermore, a surface enrichment of C or H from the ALD may vary with the number of pulsing cycles, resulting in differences in surface composition and conduction in as-deposited films of different thickness. The in-plane conductivities in our study might be influenced by all the aforementioned factors. One may also notice that for thicker films of 160 and 235 nm, the in-plane and cross-plane conductivities are within the same order of magnitude, whereas a distinct discrepancy is demonstrated in the 90 nm films. This leads to a suspect conductivity enhancement from reduced film thickness. Further work with ultrathin and thicker films would help to clarify this “thickness to conductivity” relation, which is, however, beyond the scope of this study. Reproducible conductivities are obtained by a cross-plane method and independent of the film thickness. This may indicate that in this study, the cross-plane method better represents the bulk conductivity of the films, and thus the room temperature conductivity can be drawn to be ∼10−10 S cm−1. Nevertheless, from a practical point of view, the experimental difficulties of measuring the 90 nm film have been drastically increased. There was a larger probability of short-circuiting because of pinholes and the film became more vulnerable to the damage caused by sample handling and thermal effects.
Overall, the ALD LiAlO2 thin films investigated in this study with amorphous structures and Li cation ratios [Li]/([Li] + [Al]) = 0.46 exhibit room-temperature conductivities larger than 10−10 S cm−1. These are considerably higher than those reported for single-crystalline33 and polycrystalline γ-LiAlO2 (ref. 34) (Table 2), probably benefiting from the amorphous nature with an isotropic conduction. Compared to crystalline LiAlO2, the increased disorder in the glassy or amorphous structure gives rise to an increased ionic mobility and suppressed electronic mobility, resulting in predominantly ionic transport characteristics,35 as well as enhanced ionic conductivities. A better agreement has been found in an early report on bulk Li2O–Al2O3 glasses,35 in which the extrapolated room-temperature conductivity is 3 × 10⁻¹¹ S cm−1 for a Li cation ratio [Li]/([Li] + [Al]) = 0.6 and 5 × 10⁻⁸ S cm−1 for [Li]/([Li] + [Al]) = 0.7. Recently, Park et al.17 reported an extrapolated σRT = 5.6 × 10⁻⁸ S cm−1 for an ultrathin (50 nm) ALD LiAlO2 film, which was obtained by in-plane measurements over 300–400 °C in ambient air. Though the exact Li content is lacking, one can assume based on their previous work on ALD processes24 that this enhanced conductivity value may partially result from a high Li cation percentage approaching 0.82, which can only be achieved in relatively thin film. Therefore, it is reasonable to believe that the comparatively low Li cation ratio (0.46) in our study accounts for the lower conductivity but on the other hand, allows for thicker films to be obtained (90, 160 and 235 nm). With respect to the application in solid-state batteries, the conductivities of the ALD LiAlO2 films reported in this study are still inadequate for use as a solid-state electrolyte. Further modifications in the ALD processes, for example altering the pulse ratios between the Li and Al cycles in order increase the Li content, could be considered for improving the conductivity.36
| Materials | Experimental conditions | σ RT (S cm−1) | E a (eV) | Ref. |
|---|---|---|---|---|
| ALD LiAlO2 thin films on sapphire and Ti substrates | Impedance: in-plane and cross-plane, 200 °C – RT, dry Ar | ∼10−10 | 0.7–0.8 | This work |
| ALD LiAlO2 thin film on quartz substrate | Impedance: in-plane, 300–400 °C, ambient air | 5.6 × 10⁻⁸* | 0.56 | 17 |
| Single-crystalline γ-LiAlO2 | AC conductivity: 423–623 K | ∼1 × 10⁻¹⁷* | 1.14(1) | 33 |
| Polycrystalline γ-LiAlO2 | AC conductivity: 450–1000 °C, dry Ar | 2 × 10⁻¹⁴* | 0.81 (extrinsic) 1.3 (intrinsic) | 34 |
| Rapidly quenched glasses: | AC conductivity: 150–400 °C | 35 | ||
| 0.6Li2O–0.4Al2O3 | 3 × 10⁻¹¹* | 0.88 | ||
| 0.7Li2O–0.3Al2O3 | 5 × 10⁻⁸* | 0.57 |
4. Conclusion
The Li-ion conductivity of amorphous LiAlO2 films deposited by atomic layer deposition (ALD) has been investigated by impedance spectroscopy on films deposited on insulating sapphire and conducting Ti substrates using in-plane and cross-plane geometries, respectively. The conductivity in these films exhibit ionic conduction, presumably by Li ions, with an Arrhenius-type activated temperature dependency. The room-temperature conductivity of LiAlO2 films is on the order of ∼10−10 S cm−1, and the activation energy is ca. 0.8 eV. In-plane and cross-plane methods have been compared: in-plane conductivities exhibit stronger thickness-dependence particularly with a thin film thickness (90 nm here), which can be tentatively attributed to effects of the large interface and surface of that geometry. Better reproducibility is achieved using the cross-plane geometry, showing close conductivity values in 90, 160 and 235 nm films, once short-circuiting from film damage, as a result of fabrication or handling, can be avoided.Acknowledgements
The authors thank Drs A. Evans and S. Kumar (University of Oslo, UiO) for fruitful discussions and V. Bobal (UiO MiNaLab) for technical assistance. The financial support by the Research Council of Norway via projects 220135 NanoMILiB and 200030 3DBatt is gratefully acknowledged, as well as the Norwegian Micro- and Nano-Fabrication Facility, NorFab (197411/V30) and the Norwegian Centre for X-ray Diffraction, Scattering and Imaging (RECX).References
- J. F. M. Oudenhoven, L. Baggetto and P. H. L. Notten, Adv. Energy Mater., 2011, 1, 10–33 CrossRef CAS.
- J. L. Souquet and M. Duclot, Solid State Ionics, 2002, 148, 375–379 CrossRef CAS.
- N. J. Dudney, Mater. Sci. Eng., B, 2005, 116, 245–249 CrossRef.
- K. Takada, Acta Mater., 2013, 61, 759–770 CrossRef CAS.
- M. Park, X. Zhang, M. Chung, G. B. Less and A. M. Sastry, J. Power Sources, 2010, 195, 7904–7929 CrossRef CAS.
- S.-J. Lee, H.-K. Baik and S.-M. Lee, Electrochem. Commun., 2003, 5, 32–35 CrossRef CAS.
- M. Roberts, P. Johns, J. Owen, D. Brandell, K. Edstrom, G. El Enany, C. Guery, D. Golodnitsky, M. Lacey, C. Lecoeur, H. Mazor, E. Peled, E. Perre, M. M. Shaijumon, P. Simon and P.-L. Taberna, J. Mater. Chem., 2011, 21, 9876–9890 RSC.
- J. W. Long, B. Dunn, D. R. Rolison and H. S. White, Chem. Rev., 2004, 104, 4463–4492 CrossRef CAS PubMed.
- M. Putkonen, T. Aaltonen, M. Alnes, T. Sajavaara, O. Nilsen and H. Fjellvåg, J. Mater. Chem., 2009, 19, 8767–8771 RSC.
- R. L. Puurunen, J. Appl. Phys., 2005, 97, 121301 CrossRef.
- T. Aaltonen, O. Nilsen, A. Magrasó and H. Fjellvåg, Chem. Mater., 2011, 23, 4669–4675 CrossRef CAS.
- J. Liu, M. N. Banis, X. Li, A. Lushington, M. Cai, R. Li, T.-K. Sham and X. Sun, J. Phys. Chem. C, 2013, 20260–20267, DOI:10.1021/jp4063302.
- I. D. Scott, Y. S. Jung, A. S. Cavanagh, Y. Yan, A. C. Dillon, S. M. George and S.-H. Lee, Nano Lett., 2010, 11, 414–418 CrossRef PubMed.
- M. E. Donders, H. C. Knoops, W. M. M. Kessels and P. H. Notten, ECS Trans., 2011, 41, 321–330 CAS.
- E. Østreng, K. B. Gandrud, Y. Hu, O. Nilsen and H. Fjellvåg, J. Mater. Chem. A, 2014, 2, 15044–15051 Search PubMed.
- V. Miikkulainen, O. Nilsen, M. Laitinen, T. Sajavaara and H. Fjellvåg, RSC Adv., 2013, 3, 7537–7542 RSC.
- J. S. Park, X. Meng, J. W. Elam, S. Hao, C. Wolverton, C. Kim and J. Cabana, Chem. Mater., 2014, 26, 3128–3134 CrossRef CAS.
- A. C. Kozen, A. J. Pearse, C.-F. Lin, M. Noked and G. W. Rubloff, Chem. Mater., 2015, 27, 5324–5331 CrossRef CAS.
- X. Yu, J. B. Bates, G. E. Jellison and F. X. Hart, J. Electrochem. Soc., 1997, 144, 524–532 CrossRef CAS.
- D. J. Kalita, S. H. Lee, K. S. Lee, D. H. Ko and Y. S. Yoon, Solid State Ionics, 2012, 229, 14–19 CrossRef CAS.
- K.-H. Joo, H.-J. Sohn, P. Vinatier, B. Pecquenard and A. Levasseur, Electrochem. Solid-State Lett., 2004, 7, A256–A258 CrossRef CAS.
- S. Sanna, V. Esposito, J. W. Andreasen, J. Hjelm, W. Zhang, T. Kasama, S. B. Simonsen, M. Christensen, S. Linderoth and N. Pryds, Nat. Mater., 2015, 14, 500–504 CrossRef CAS PubMed.
- E. Navickas, M. Gerstl, G. Friedbacher, F. Kubel and J. Fleig, Solid State Ionics, 2012, 211, 58–64 CrossRef CAS PubMed.
- D. J. Comstock and J. W. Elam, J. Phys. Chem. C, 2012, 117, 1677–1683 Search PubMed.
- V. Thangadurai and W. Weppner, Adv. Funct. Mater., 2005, 15, 107–112 CrossRef CAS.
- K. Benaissa, P. V. Ashrit, G. Bader, F. E. Girouard and V.-V. Truong, Thin Solid Films, 1992, 214, 219–222 CrossRef CAS.
- V. Thangadurai, R. A. Huggins and W. Weppner, J. Power Sources, 2002, 108, 64–69 CrossRef CAS.
- M. Gerstl, E. Navickas, G. Friedbacher, F. Kubel, M. Ahrens and J. Fleig, Solid State Ionics, 2011, 185, 32–41 CrossRef CAS PubMed.
- C. Li, L. Gu and J. Maier, Adv. Funct. Mater., 2012, 22, 1145–1149 CrossRef CAS.
- S. Ross, A.-M. Welsch and H. Behrens, Phys. Chem. Chem. Phys., 2015, 17, 465–474 RSC.
- S.-i. Furusawa, A. Kamiyama and T. Tsurui, Solid State Ionics, 2008, 179, 536–542 CrossRef CAS.
- J. Li, N. J. Dudney, J. Nanda and C. Liang, ACS Appl. Mater. Interfaces, 2014, 6, 10083–10088 CAS.
- S. Indris, P. Heitjans, R. Uecker and B. Roling, J. Phys. Chem. C, 2012, 116, 14243–14247 CAS.
- S. Konishi and H. Ohno, J. Am. Ceram. Soc., 1984, 67, 418–419 CrossRef CAS.
- A. M. Glass and K. Nassau, J. Appl. Phys., 1980, 51, 3756–3761 CrossRef CAS.
- J. Fu, Solid State Ionics, 1997, 104, 191–194 CrossRef CAS.
| This journal is © The Royal Society of Chemistry 2016 |


