 Open Access Article
Creative Commons Attribution 3.0 Unported Licence
Viscosity sensing by adjusting the interface of a small liquid droplet/silica composite layer on quartz crystal microbalance†
Kenta
Fukada
and
Seimei
Shiratori
*
School of Integrated Design Engineering, Center for Science and Technology for Designing Functions, Graduate School of Science and Technology, Keio University, 3-14-1 Hiyoshi, Kohoku-ku, Yokohama, Kanagawa 223-8522, Japan. E-mail: shiratori@appi.keio.ac.jp; Fax: +81-45-566-1602; Tel: +81-45-566-1602
First published on 13th April 2016
Abstract
We report the different attenuated shear vibrations of hydrophilic quartz crystal microbalance (QCM) by attached small viscous liquids and this technique enabled us to measure the viscosity of various 5 μL solutions. Covering entire area of QCM surface by a liquid was important for stable damping time measurement and accordingly we induced silica/polyelectrolyte hydrophilic coating on QCM with using Layer by Layer (LbL) self assembly method for enhanced wettability and saving viscous materials. We examined the relationship between damping time and viscosity of polyvinyl alcohol (PVA), polyvinylpyrrolidone (PVP) or glycerol aqueous solutions. We also applied this technique for estimating blood coagulation behaviors.
1. Introduction
Measurement of viscosity is essential for analyzing soft matter and useful for detecting slight changes in various materials. For example, blood viscosity and coagulation time have been researched for patients with embolism in order to select suitable oral anticoagulants.1,2 Rheology of DNA,3,4 RNA5 and antibody6 have been studied for estimating mechanical property of molecules. Physical characteristics including viscosity of ion liquid7 or ink8,9 also have been investigated for developing cleaner industrial process.Conventionally rotational or falling ball viscometer measured viscosity with much quantity of liquid (milliliter order); however, large material consumption was not preferred in the above cases and measuring by small quantity of liquid has been strongly required. Recently enthusiastic researches made it possible to measure viscosity with micro or nano liter liquid by viscometers with using liquid flow10–13 or liquid droplet.14–25 In the case of liquid flow type viscometer, velocity of liquid which flew inside channel was utilized.10,11 Some of micro channels used only nano liter and it was suitable for expensive or precious liquid; however, precisely controlled wettability was required to get stable flow.12,13 In the case of liquid droplet type viscometer, vibration of droplet was utilized.14 Piezoresistive cantilevers measured viscosity of 2.4 μL water–glycerol mixtures.15 Optical image of liquid vibration was studied by high-speed imaging;6,16,17 however, these methods required high quality sensors and optical apparatuses.
Quartz crystal microbalance with energy dissipation (QCM-D)18–25 was also focused on as an universal analytical tool. This technique monitored the attenuated amplitude after shutting off the power and suppressed shear vibration by high viscous liquid was observed through damping time measurement. In this principle liquid/solid interface was important and eagerly investigated. As liquid side researches of QCM-D, various viscous solutions of biomaterials such as DNA,3 RNA,5 lipid solutions26,27 and industrial oil28 or artificial polymer solutions such as poly (ethylene glycol),29,30 glycerol31 and copolymer32 were investigated. By in-depth profiling, viscosity near interface where free molecules undergo some property changes was carefully researched33 and a depletion layer in polymer solutions was also investigated.34
On the other hands, as solid side researches of QCM-D, physical or chemical modification of QCM surface was examined to enhance viscosity sensing. As examples of surface structure modification, smooth-texture combined resonator was fabricated to separately measure the viscosity and density of 10 μL glycerol liquid35 and the effect of surface roughness,36 nanowire-modification37 or lipid bilayers38 were eagerly studied. As examples of wettability control, there were hydrophobic39,40 or hydrophilic41–45 approaches. In the case of hydrophobic modification, compared with the bare QCM, reduced energy loss and frequency shift were observed by slip of liquid.39 Superhydrophobic patterned surface fabricated with lithography was also utilized for the measurements of density–viscosity products of water–glycerol mixture solution.31,40 Conversely hydrophilic gold coated QCM monitored adsorption of asphaltenes and resins from crude oil.41 The concentration of hydrophobic materials in industrial oil was investigated through silica or alumina coated QCM-D with 0.5 mL.42 Viscoelastic property of cationic starch was also investigated with utilizing anionic property of silica which was coated on QCM by means of vapor deposition.43 Through polyethylene coated hydrophilic QCM coagulation of blood was successfully measured; however, it required piranha solution as a first step and 200 μL of blood was used.45
In this study we focused on the viscosity sensing with a small quantity of liquid droplet (<10 μL) through simple QCM-D system (Fig. 1) and applied it for not only artificial organic solutions but also biomaterials. For easy preparation and accurate sensing we fabricated thin hydrophilic silica/polyelectrolyte coating on QCM with environmental friendly Layer by Layer (LbL) self assembly method.46–51 A small liquid droplet spread on this hydrophilic coating and entire coverage led to stable dissipation behavior measurement. Here we examined viscosity of 5 μL polyvinyl alcohol (PVA), polyvinylpyrrolidone (PVP), glycerol aqueous solutions on hydrophilic QCM and compared with 30 μL solutions on bare QCM then the relationship between damping time and viscosity was investigated. Moreover, we also examined biomaterials such as human or pig blood coagulation behavior through this hydrophilic QCM-D.
2. Experimental
2.1. Materials
The following materials were used without purification. For LbL method, poly(ethylene imine) (PEI, Mw = 70![[thin space (1/6-em)]](https://www.rsc.org/images/entities/char_2009.gif) 000, Wako Pure Chemical Industries, Ltd.) as a positively charged material and aqueous dispersion of SiO2 nanoparticles (OS, Nissan Chemical Industries, Ltd.) as a negatively charged material were prepared. The concentrations of PEI and SiO2 were adjusted to 0.01 M and 0.2 wt% respectively, with ultra-pure water (>18 MΩ cm). The respective pH values were 10.2 and 5.4. For viscous solutions we obtained glycerol, PVA (polymerization degree about 1500) and PVP (K value = 90) from Wako Pure Chemical Industries, Ltd. The concentration and viscosity of glycerol were 20, 30, 40, 50, 60 wt% and 1.8, 2.5, 3.7, 6.0, 10.8 cP respectively. Those of PVA were 5, 7.5, 10, 12.5, 15 and 29, 100, 487, 1499, 2800 cP respectively. Those of PVP were 5, 10, 15, 20, 25 and 50, 112, 540, 2150, 8060 cP respectively (ESI Fig. S1†). For blood coagulation tests, human blood of author was taken by puncture needle (Terumo corporation) and pig blood with anticoagulant (Tokyo Shibaura Organ Co. Ltd) was used and stored for 2 months at 5 °C.
000, Wako Pure Chemical Industries, Ltd.) as a positively charged material and aqueous dispersion of SiO2 nanoparticles (OS, Nissan Chemical Industries, Ltd.) as a negatively charged material were prepared. The concentrations of PEI and SiO2 were adjusted to 0.01 M and 0.2 wt% respectively, with ultra-pure water (>18 MΩ cm). The respective pH values were 10.2 and 5.4. For viscous solutions we obtained glycerol, PVA (polymerization degree about 1500) and PVP (K value = 90) from Wako Pure Chemical Industries, Ltd. The concentration and viscosity of glycerol were 20, 30, 40, 50, 60 wt% and 1.8, 2.5, 3.7, 6.0, 10.8 cP respectively. Those of PVA were 5, 7.5, 10, 12.5, 15 and 29, 100, 487, 1499, 2800 cP respectively. Those of PVP were 5, 10, 15, 20, 25 and 50, 112, 540, 2150, 8060 cP respectively (ESI Fig. S1†). For blood coagulation tests, human blood of author was taken by puncture needle (Terumo corporation) and pig blood with anticoagulant (Tokyo Shibaura Organ Co. Ltd) was used and stored for 2 months at 5 °C.
2.2. Hydrophilic coating by LbL process
Cation and anion solutions were stirred for 24 hours and used within several days. As a substrate QCM (10 MHz reference frequency, Ag coated, Φ = 1 cm) was ultrasonically washed in ethanol for 5 min and twice in ultra-pure water for 5 min. A thin film was fabricated using a wet process by alternately depositing the substrate in cationic solution for 90 s, pure water for 30 s × 3 times, anionic solutions for 90 s and pure water for 30 s × 3 times (ESI Fig. S2†). When we deposited material B over material A, we defined it as (A/B) and this was 1 bilayers. If the sequence was repeated “n” times, we defined it as (A/B)n. In this study we fabricated from 2 to 10 bilayers on QCM.2.3. Viscosity measurement
Viscosity of each aqueous solution was measured by conventional rotational viscometer (ViscoTester 6L, Thermo Haake) and estimated by QCM-D. Simple QCM-D system was as bellow: bare or hydrophilic QCM were connected to an oscillation circuit and the frequency was monitored in one channel of a digital storage oscilloscope (GWINSTEK, GDS-1152A-U). We dropped viscous solutions on QCM surface from 5 to 30 μL at 20 °C then shutting off the power and monitored the damping time (See Fig. 1). Conventionally the decay time constant τ was used in QCM-D and it was defined as a period when the voltage equaled to the amplitude divided by Napier's constant; however, we focused on only the damping time in this case because it was measured easily and the difference of viscosity was observed.3. Results and discussion
3.1. Coverage area
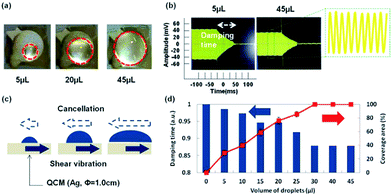
Liquid coverage area on QCM was important because the vibration behavior was changed by the position of liquids.52 A small liquid droplet was difficult to cover entire area and it needed to confirm the relationship between coverage ratio and damping time for accurate viscous sensing. Fig. 2(a) showed coverage areas of QCM by water droplets. 5 μL and 20 μL droplets were difficult to cover entire area of QCM because bare QCM surface was not hydrophilic. By increased amounts, 45 μL droplets covered the QCM surface perfectly. Fig. 2(b) was damping behavior after shutting off the power. The damping time of QCM with 5 μL was longer and the amplitude was higher. On the other hands, that of QCM with 45 μL was shorter and lower. It was considered that the difference was caused by the interfacial cancellation between a liquid droplet and QCM. The shear vibration of QCM was suppressed by attached liquid droplets and this image was shown in Fig. 2(c). The relationship between damping time and coverage area were measured from 0 to 45 μL as shown in Fig. 2(d). Damping time (a.u.) of vertical axis was each damping time divided by the damping time without water droplet. Stable damping behavior was observed in the case of over 30 μL droplets. We considered that the major reason of the different damping time was not attached mass but coverage area. Because a water droplet of 45 μL was heavier than that of 30 μL but the damping times were almost the same. From these results we focused on how to cover all area of QCM and decided to utilize hydrophilic layer in this research.3.2. Viscosity
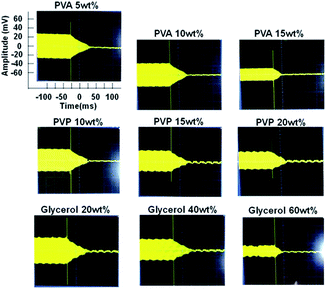
As a viscosity measurement we prepared PVA, PVP and glycerol aqueous solutions. We chose these materials because they had different viscosity changes. PVA and PVP had relatively high viscosity change due to the entanglement of polymer and glycerol had relatively low viscosity change in this experiment. In Fig. 3, QCM-D measurement of PVA, PVP and glycerol were shown. We dropped these solutions on the bare QCM and observed damping behavior. By changing concentrations and materials, there were decreased amplitudes and damping times. When we focused on one material, viscosity was able to be estimated by the damping time. Because there was the relationship between viscosity, concentration and damping time (ESI Fig. S1 and S5†). On the other hands, when we compared materials, some solutions had same damping time but they had not same viscosity. For example, the damping time (a.u.) of PVA (aq) 10 wt% and glycerol (aq) 40 wt% were about 0.7 and their viscosity were 487 cP and 3.7 cP respectively. From these discussions we considered that the absolute damping time was not directly related to viscosity and the relationship between damping time and viscosity was determined by the solved materials.Although we needed to consider the case of same damping time by different materials, the viscosity which related with concentration was able to be estimated by regularly decreased damping times.
The schematic images of different shear vibration of QCM by attached viscous solutions were shown in Fig. 4. Short decay time which means the high viscosity was observed in the case of high concentration or polymer solution and we considered that the reason of short damping time was organic materials canceled the shear vibration of QCM. Because it was considered that the contained material was not solved uniformly by higher densities (PVA: 1.19 g cm−3, PVP: 1.2 g cm−3 and glycerol: 1.26 g cm−3) compared with water (1.0 g cm−3) and there was much material at the interface of liquid and QCM. Moreover, in the case of polymer solution, viscosity was increased by the entanglement of polymer even low concentration. We considered that the difficulty of universal viscosity measurement thorough this system was caused by the different attached behavior of materials and that is why we needed to care about the solved materials for viscosity measurement.
3.3. Hydrophilic coating on QCM
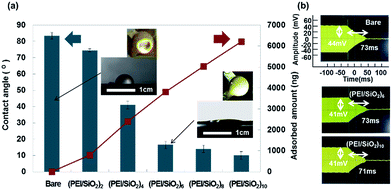
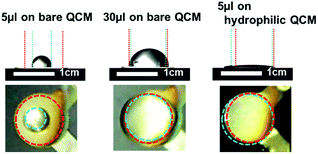
In order to reduce viscous liquids for measurement, we fabricated silica/polyelectrolyte coating on QCM as a thin hydrophilic layer by LbL method. Fig. 5(a) showed that the contact angles were decreased from 85.4° by hydrophilic layer. This thin hydrophilic layer was fabricated by water based environmental friendly process within several minutes and adsorbed amount was very small. When we coated 8 or 10 bilayers, the contact angles were decreased well; however, it showed shorter decay time than the case of bare QCM and it was difficult to ignore the adsorbed amount as shown in Fig. 5(b). From our previous study we investigated the relationship between the organic–inorganic composited film with different inorganic material ratio and the film hardness by QCM-D.51 The damping time which related to film hardness was determined by the ratio of inorganic material and film structure. This difference was also observed by abrasion tests. We considered the 8 or 10 bilayer were different composited ratio or film structure compared with the case of 6 bilayer. Although the amplitude was decreased from 44 mV to 41 mV by adsorbed amount, 6 bilayers showed almost the same damping time (73 ms) with the bare QCM and the wettability was enough for covering entire area even by 10 μL water. That is why we decided to utilize 6 bilayers as a hydrophilic layer in this paper. Comparison of other hydrophilic treatment and repeatability of damping time measurement with LbL coating were also shown in ESI Fig. S3 and S4.†Bare and hydrophilic QCM were used to measure the viscosity of small quantity (<10 μL) of glycerol (aq). Fig. 6 showed the wettability of glycerol–water mixtures on bare or hydrophilic LbL coated QCM. By using hydrophilic QCM the quantity of viscous liquid to cover whole area of QCM was decreased. In this case 5 μL was enough to cover the QCM surface.
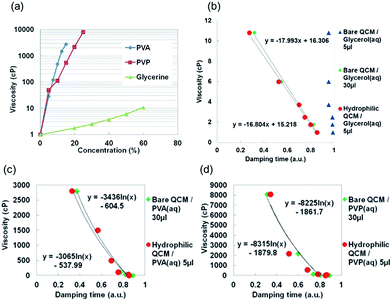
Fig. 7 showed the relationship between viscosity and damping time (a.u.) of viscous liquids. We fabricated the solutions with different concentrations and the absolute viscosities were measured by conventional rotational viscometer as shown in Fig. 7(a). Fig. 7(b)–(d) were the relationship between absolute viscosity and relative damping time of glycerol, PVA and PVP aqueous solutions. The vertical axis of Fig. 7(b)–(d) were absolute viscosities which related to concentrations. The horizontal axis was relative damping time which were obtained by calculation as bellow; each measured damping time was divided by the damping time of bare and hydrophilic QCM as shown in ESI Table S1.†
In the case of bare QCM with glycerol–water mixtures as shown in Fig. 7(b) there were same damping times even different concentrations and it was difficult to estimate viscosity by 5 μL solutions. Because a liquid droplet was not able to cover whole area of QCM and the damping time depended on the position of liquid on QCM. Entire area was covered by 30 μL solutions and we were able to get linear relationship between damping time (a.u.) and viscosity; however, it used much amount of liquid. Viscosity and damping times of 30 μL glycerol (aq) by bare QCM-D were 1.8, 2.5, 3.7, 6.0, 10.8 cP and 60.3, 55.0, 51.6, 40.0, 23.3 ms respectively. On the other hands, we utilized only 5 μL mixtures for stable measurement by hydrophilic LbL coated QCM-D and there was no difference with bare QCM-D. Viscosity was same with above and the damping times were 58.3, 54.6, 51.0, 38.3, 20.0 ms respectively. Linear relationship between damping time (a.u.) and viscosity was also observed and we were able to decrease the amount from 30 μL to 5 μL for viscosity measurement. From these results hydrophilic LbL coating on QCM was useful for covering large area even by a small liquid droplet and saving viscous materials.
To confirm the difference of materials, damping times of PVA and PVP were also studied in Fig. 7(c) and (d). We compared bare QCM with 30 μL solutions and hydrophilic QCM with 5 μL mixtures. Viscosity and damping time of PVA (aq) by bare QCM-D with 30 μL were 29, 100, 487, 1499, 2800 cP and 60.0, 56.7, 50.7, 41.7, 27.0 ms respectively. In the case of hydrophilic QCM-D with 5 μL, viscosity was same with above and the damping times were 62.0, 55.0, 50.3, 41.3, 24.0 ms respectively. Viscosity and damping time of PVP (aq) by bare QCM-D with 30 μL were 50, 112, 540, 2150, 8060 cP and 58.7, 54.0, 50.7, 43.7, 22.7 ms respectively. In the case of hydrophilic QCM-D with 5 μL, viscosity was same with above and the damping times were 63.0, 57.0, 50.0, 37.5, 25.0 ms respectively.
In each case there was no difference and we were able to save viscous liquids by using hydrophilic layer. In the case of PVA and PVP, viscosity was changed exponentially by the increased concentration and the damping time also had exponential changes by the increased concentration (ESI Fig. S5†). That is why there were the exponential relationship between the damping time and viscosity. From the results of polymer solutions 5 μL viscous liquid was enough for stable measurement by utilizing hydrophilic QCM-D.
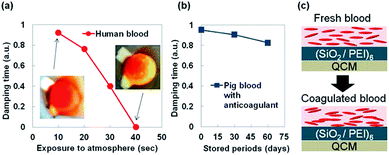
3.4. Blood coagulation test
This sensor was also applied for blood coagulation test. We used human blood and pig blood with anticoagulant as shown in Fig. 8. When we measured human blood by hydrophilic QCM-D the damping time was rapidly decreased and there was no signal over 40 s. It was considered that the decreased damping time was related to the human blood coagulation behavior and viscosity change was sensed. Because human blood was coagulated and changed from liquid to solid within short time. On the other hands, when we measured a 5 μL pig blood the decreased damping time was not well observed until using sample which was stored for dozens of days due to the contained anticoagulant.From these results we considered that coagulation behavior of various bloods was also able to be sensed by the change of damping times with a small liquid droplet and this hydrophilic QCM-D was useful for not only artificial organic solutions but also biomaterials. For further research we need to fabricate more sensitive sensor to detect small differences of viscous liquids and automation sensing system to observe rapid change of a solution. The small viscosity differences lead to detect state of solutions and these sensors will be utilized to save precious and expensive materials in medical or industrial regions.
4. Conclusions
Viscosity of small quantity liquids such as 5 μL was successfully sensed by hydrophilic QCM-D. We fabricated silica/PEI hydrophilic coating on QCM by LbL method in order to utilize the dissipation time of QCM which related with viscosity and cover the entire QCM surface with a small liquid droplet for accurate measurement. The water contact angle of QCM surface was enhanced from 85.4° to 16.5° by the hydrophilic LbL coating and a liquid spread to the whole area of hydrophilic QCM easily. Moreover, this coating didn't hinder the dissipation behavior and we got almost the same result with the bare QCM because only amplitude was influenced by this hydrophilic thin coating and damping time was not affected. By enhanced wettability we were able to reduce the viscous liquid quantity from 30 μL to 5 μL compared with the bare QCM. As viscous solutions PVA, PVP and glycerol aqueous solutions were measured by QCM-D and there was liner or exponential relationship between damping time and viscosity. It was also found that the blood coagulation behavior and the difference of viscosity were successfully investigated by hydrophilic QCM with a small quantity of liquid droplet.Conflict of interest
The authors declare no competing financial interest.Acknowledgements
We are deeply grateful to Mr Taihei Taniguchi and Mr Shingo Nishizawa for the developing experimental equipments.References
- S. Nimisha, D. D. Robertson and A. B. Mark, Anal. Chem., 2005, 77, 383–392 CrossRef PubMed.
- O. Cakmak, E. Ermek, N. Kilinc, S. Bulut, I. Baris, I. H. Kavakli, G. G. Yaralioglu and U. Hakan, Lab Chip, 2015, 15, 113–120 RSC.
- X. Su, Y. J. Wu, R. Robelek and W. Knoll, Front. Biosci., 2005, 10, 268–274 CrossRef CAS.
- R. Philipp, C. Damiano and D. Jurg, Lab Chip, 2013, 13, 4794–4799 RSC.
- P. D. Aleksandra, M. Agnes, J. Luc, R. Michael, C. Arkadiusz, H. Fredrik, N. Tommy and S. Emma, Nanoscale, 2015, 7, 583–596 RSC.
- H. Feng, W. B. Gerald, R. L. Jennifer, O. N. Linda, N. B. David and I. R. Vladimir, Anal. Biochem., 2010, 399, 141–143 CrossRef PubMed.
- M. Glen, H. Chris, G. Rile, D. Nicola, W. K. A. Ray, M. M. Jordan, R. B. Mark and I. N. Michael, Anal. Chem., 2008, 80, 5806–5811 CrossRef PubMed.
- P. Calvert, Chem. Mater., 2001, 13, 3299–3305 CrossRef CAS.
- D. Jang, D. Kim and J. Moon, Langmuir, 2009, 25, 2629–2635 CrossRef CAS PubMed.
- C. J. James, D. E. Mulcahy and B. J. Steel, J. Phys. D: Appl. Phys., 1984, 17, 225–230 CrossRef CAS.
- G. Asaf and P. M. Allen, Anal. Chem., 2012, 84, 10732–10736 CrossRef PubMed.
- S. Nimisha and A. B. Mark, Lab Chip, 2006, 6, 744–751 RSC.
- D. G. Francesco, D. Gaetano, G. Francesco, D. S. Ilaria, A. N. Paolo and L. M. Pier, Lab Chip, 2015, 15, 783–792 RSC.
- S. Chandrasekhar, Proc. Lond. Math. Soc., 1959, s3, 141–149 CrossRef.
- V. N. Thanh, D. N. Minh, T. Hidetoshi, M. Kiyoshi and S. Isao, Lab Chip, 2015, 15, 3670–3676 RSC.
- M. Perez, L. Salvo, M. Suéry, Y. Bréchet and M. Papoular, Phys. Rev. E: Stat. Phys., Plasmas, Fluids, Relat. Interdiscip. Top., 2000, 61, 2669–2675 CrossRef CAS.
- S. S. James, Soft Matter, 2012, 8, 399–407 RSC.
- G. Sauerbrey, Z. Phys., 1959, 155, 206–222 CrossRef CAS.
- K. K. Kanazawa and J. G. Gordon, Anal. Chem., 1985, 57, 1770–1771 CrossRef CAS.
- M. Yang and M. Thompson, Anal. Chem., 1993, 65, 1158–1168 CrossRef CAS.
- R. Michael, H. Fredrik, K. Anatol, B. Peter and K. Bengt, Rev. Sci. Instrum., 1995, 66, 3924–3930 CrossRef.
- R. Michael and K. Bengt, Rev. Sci. Instrum., 1996, 67, 3238–3241 CrossRef.
- M. Rodahl, F. Höök, C. Fredriksson, C. Keller, A. Krozer, P. Brzezinski, M. Voinova and B. Kasemo, Faraday Discuss., 1997, 107, 229–246 RSC.
- C. A. Keller and B. Kasemo, Biophys. J., 1998, 75, 1397 CrossRef CAS PubMed.
- E. F. Irwin, J. E. Ho, S. R. Kane and K. E. Healy, Langmuir, 2005, 21, 5529–5536 CrossRef CAS PubMed.
- N. Martin, S. Matthias and V. Janos, Sens. Actuators, A, 2011, 165, 415–421 CrossRef.
- Y. H. Imad and M. Adam, Soft Matter, 2015, 11, 5571–5579 RSC.
- C. A. Dean, J. J. Malcolm, B. Chris, C. J. Booth and C. J. Adrian, Meas. Sci. Technol., 2003, 14, 1955–1962 CrossRef.
- P. Wang, J. J. Fang, S. Qin, Y. H. Kang and D. M. Zhu, J. Phys. Chem. C, 2009, 113, 23800 Search PubMed.
- Q. Sheng, T. Xuefeng, Z. Lifei, W. Yifeng, D. Xianbin and M. Z. Da, J. Colloid Interface Sci., 2012, 383, 208–214 CrossRef PubMed.
- P. Roach, G. McHale, C. R. Evans, N. J. Shirtcliffe and M. I. Newton, Langmuir, 2007, 23, 9823–9830 CrossRef CAS PubMed.
- F. N. Nunalee and R. S. Kenneth, Langmuir, 2004, 20, 7083–7089 CrossRef CAS PubMed.
- F. Jiajie, Z. Tao, S. Jie, J. Zhongying and M. Yuqiang, Sci. Rep., 2015, 5, 8491 CrossRef PubMed.
- S. Krzysztof, W. Agnieszka, P. Tomasz, W. Karol, O. M. Anna, G. Teodor and H. Robert, Soft Matter, 2014, 10, 7762–7768 RSC.
- I. Atsushi and I. Motoko, Meas. Sci. Technol., 2011, 22, 015402 CrossRef.
- U. Michael and D. Leonid, Langmuir, 1994, 10, 2836–2841 CrossRef.
- F. Jiajie, R. Chunlai, Z. Tao, W. Kaiyu, J. Zhongying and M. Yuqiang, Analyst, 2015, 140, 1323–1336 RSC.
- Z. Ziliang, J. Xiangling, D. Rumiana, L. Reinhard and L. Yonggang, Macromolecules, 2015, 48, 1824–1831 CrossRef.
- K. D. Esmeryan, G. McHale, C. L. Trabi, N. R. Geraldi and M. I. Newton, J. Phys. D: Appl. Phys., 2013, 46, 345307 CrossRef.
- K. Ping, L. A. David and T. Srinivas, IEEE Sens. J., 2011, 11, 2723–2731 CrossRef.
- E. Pontus, B. Eva, C. Per, H. A. Inge, S. Johan and K. Anna, J. Colloid Interface Sci., 2002, 247, 342–350 CrossRef PubMed.
- K. Serkan, V. Sondre, K. Mürşide and S. Johan, Energy Fuels, 2012, 26, 5060–5068 CrossRef.
- T. Tekla, M. Juha, S. J. Leena and S. Per, Langmuir, 2004, 20, 10900–10909 CrossRef PubMed.
- R. Ilya, F. R. Fernanda, N. M. Alexander and T. Marcus, J. Chem. Phys., 2005, 122, 204711 CrossRef PubMed.
- M. Lothar, S. Stefan, D. Hartmut, Z. Christiane, P. W. Hans, N. Hinnak and K. G. Frank, Anal. Chem., 2010, 82, 658–663 CrossRef PubMed.
- S. Shiratori and M. Rubner, Macromolecules, 2000, 33, 4213–4219 CrossRef CAS.
- P. Paul, S. Lang, E. Yaseen, B. Peter, L. Jaebeom, M. Ashwini, K. Winardi, R. C. Mary, S. Max, K. John, L. Joerg and A. K. Nicholas, Langmuir, 2007, 23, 7901–7906 CrossRef PubMed.
- N. Fukao, K. H. Kyung, K. Fujimoto and S. Seimei, Macromolecules, 2011, 44(8), 2964–2969 CrossRef CAS.
- Y. Kosaki, H. Izawa, S. Ishihara, K. Kawakami, M. Sumita, Y. Tateyama, Q. Ji, V. Krishnan, S. Hishita, Y. Yamauchi, J. P. Hill, A. Vinu, S. Shiratori and K. Ariga, ACS Appl. Mater. Interfaces, 2013, 5(8), 2930–2934 CAS.
- L. Yiming, A. S. Mohammad, D. Ke, C. Tsengming, H. C. Chang and A. S. Svetlana, ACS Appl. Mater. Interfaces, 2013, 5, 12617–12623 Search PubMed.
- K. Fukada, T. Taniguchi and S. Shiratori, RSC Adv., 2015, 5, 52837–52843 RSC.
- M. Rodahl and B. Kasemo, Sens. Actuators, B, 1996, 37, 111–116 CrossRef CAS.
Footnote |
| † Electronic supplementary information (ESI) available: The damping time (a.u.) calculation results and the relation between viscosity, concentration and damping time. See DOI: 10.1039/c6ra02597h |
| This journal is © The Royal Society of Chemistry 2016 |


