Deformation of a concrete matrix subject to a cyclic freeze–thaw process
P. Du*ab,
Y. Yao*c,
L. Wangc,
D. Y. Xuab,
Z. H. Zhouab,
S. F. Huangab and
X. Chengab
aShandong Provincial Key Laboratory of Preparation and Measurement of Building Materials, University of Jinan, Jinan 250022, China. E-mail: mse_dup@163.com; Tel: +86-531-82767163
bSchool of Materials Science and Engineering, University of Jinan, Jinan 250022, China
cStates Key Laboratory of Green Building Materials, China Building Materials Academy, Beijing 100024, China. E-mail: yaoyan@cbmamail.com.cn; Tel: +86-10-51167111
First published on 27th May 2016
Abstract
The cyclic freeze–thaw process has been recognized as one of the most primary factors leading to structural and function failure of concrete. Strain, which may have certain inherent advantages when compared to traditional test parameters such as real-time non-destructive monitoring, which is more accurate and continuous with little error caused by manual intervention, was used to characterize the deformation and deterioration of a concrete matrix under a cyclic freeze–thaw process in this study. With the cyclic freeze–thaw process, the strain hysteretic loop is raised upwards indicating that residual strain is generated in the concrete matrix. The residual strain generated proves that damage in the concrete matrix is continuously accumulated and an irreversible deterioration process. The variation of freeze characteristic temperature ΔTf and the apparent frost heaving coefficient Δαf defined in this study can be used to characterize the degree of freeze–thaw damage and the frost resistance of concrete, respectively. Through theoretical analysis, a numerical model, which can show the relationship between concrete freeze–thaw damage and residual strain has been deducted and verified, which indicates that residual strain can be used to characterize the frost resistance of concrete subjected to a cyclic freeze–thaw process such as traditional parameters. Moreover, the residual strain generated in 3.5 wt% NaCl solution is larger than in water, showing that chloride attack accelerates the freeze–thaw damage of concrete.
1. Introduction
It is known that concrete is one type of porous solid comprised cement paste and aggregates. At normal atmospheric pressure, water freezes with 9 vol% expansion below 0 °C. Therefore, under cyclic freeze–thawing, the concrete matrix is widely accepted to generate hydrostatic pressure1 and crystallization pressure,2 which may be considered as a type of inner tensile stress. A number of microcracks may generate and propagate when the inner tensile stress exceeds the ultimate tensile strength of the concrete matrix.3,4 When cyclic freeze–thawing is conducted in salt solution, the damage is more severe.5,6 Freeze–thaw damage of concrete can be classified into two types, one being surface scaling7 and the mass loss used to characterize the degree of surface scaling of concrete. The other being internal micro-cracks and their propagation;5 the initiation and propagation of microcracks inevitably results in the deformation of the matrix. At present, the most frequently-used test parameter of internal damage is the relative dynamic elastic modulus. In recent years, strain, which is able to reflect the deformation of a concrete matrix has increasingly been monitored as a measure of internal damage8,9 and has been shown to increase progressively with the progress of deterioration.This study is an attempt to analyze the strain–temperature variation and residual strain of concrete with different water cement ratios under a cyclic freeze–thaw process or under freeze–thaw cycling coupled with chloride attack. The cooling phase was divided into an initial freezing phase and freezing phase, and the freezing phase was analyzed emphatically. Furthermore, the variation of the freeze characteristic temperature ΔTf defined in this study was used to characterize the degree of freeze–thaw damage and the variation of the apparent frost heaving coefficient Δαf was used to characterize the frost resistance of concrete. The test results of residual strain have been compared with traditional test parameters and a numerical model developed, which can show the relationship between concrete freeze–thaw damage and residual strain, and the ability of residual strain in characterizing concrete freeze–thawing damage.
2. Experimental
2.1 Materials
The binder materials were Portland cement (strength grade P.I 42.5, composition tested by S8 TIGER X-ray Fluorescence Spectrometry given in Table 1) with a specific surface area of 347 m3 kg−1 and volume density of 3.10 g cm−3, river sand with a fineness modulus of 2.8 and silt content less than 1 wt%, crushed gravel with particle sizes of 5–10 mm and 10–20 mm in a ratio of 4![[thin space (1/6-em)]](https://www.rsc.org/images/entities/char_2009.gif) :
:![[thin space (1/6-em)]](https://www.rsc.org/images/entities/char_2009.gif) 6, and triterpenoid-saponin air entraining agent (the allowed maximum dosage is 0.03 wt% of the cementitious material content).
6, and triterpenoid-saponin air entraining agent (the allowed maximum dosage is 0.03 wt% of the cementitious material content).
| SiO2 | Al2O3 | Fe2O3 | CaO | MgO | SO3 | NaO2eq. | Loss | f-CaO | Cl− |
|---|---|---|---|---|---|---|---|---|---|
| 21.57 | 4.45 | 2.76 | 63.90 | 1.88 | 2.57 | 0.57 | 1.51 | 0.60 | 0.008 |
2.2 Preparation of the specimens
The mix proportions and the physical properties of the concrete samples are listed in Table 2. Only the water cement ratios are different in the mix proportions of specimens A, B1 and C, being 0.5, 0.6 and 0.65, respectively. The purpose to choose these W/C ratios was to obtain more obvious contrast results of strain. Based on the mix proportion of B1, the air entraining agent (AEA) was doped into the specimen B2 and B2-1, analyzing the effect of chloride attack on the freeze–thaw damage of concrete. AEA doping may bring amount evenly distributed stable and closed tiny air pores in the concrete matrix, which can relieve the expansion that is caused by frozen water, NaCl solution and the hydrostatic pressure produced.| No. | Cement (kg m−3) | W/C | Sand (kg m−3) | Gravel (kg m−3) | AEA (%) | Slump (mm) | Air content (%) | 28 d compressive strength (MPa) | Freeze–thaw process |
|---|---|---|---|---|---|---|---|---|---|
| a The mix proportion of specimen B2-1 is the same as that of specimen B2 and only the freeze–thaw process was different, so the same test result for the physical properties was used. | |||||||||
| A | 330 | 0.5 | 733 | 1120 | 0 | 25 | 2.5 | 40.7 | In water |
| B1 | 330 | 0.6 | 733 | 1120 | 0 | 60 | 2.8 | 34.2 | In water |
| C | 330 | 0.65 | 733 | 1120 | 0 | 75 | 3.2 | 30.1 | In water |
| B2 | 330 | 0.6 | 733 | 1120 | 0.01 | 105 | 4.5 | 27.4 | In water |
| B2-1 | 330 | 0.6 | 733 | 1120 | 0.01 | 105 | 4.5 | 27.4 | In NaCl solution |
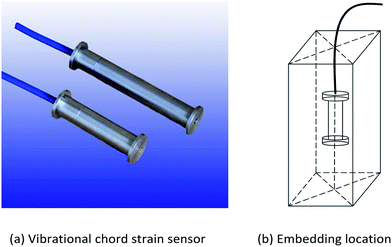
One group of each numbered concrete specimen with dimensions of 100 mm × 100 mm × 100 mm was employed to test the 28 d compressive strength. The other two groups of each numbered concrete specimen with dimensions of 100 mm × 100 mm × 400 mm were also employed. Of these two groups, one was used to test the mass loss and dynamic elastic modulus, and the other was used to continuously test the strain using a VWS-10 vibrational chord strain sensor (as shown in Fig. 1(a), its long cylindrical shape with both ends of the base makes it convenient to be fixed to the specimen).
According to the mix proportions, the raw materials were water mixed within the time specified. After mixing, the fresh concrete was used to test the slump and air content and immediately placed into the moulds. The strain sensors were embedded in the center of the concrete specimens with dimensions of 100 mm × 100 mm × 400 mm, as shown in Fig. 1(b). The specimens were demolded after 24 h and then placed into a curing room at 20 ± 2 °C and ≥90% relative humidity. After 24 d of curing, the specimens were moved into vacuum water-saturation equipment and saturated in water or 3.5 wt% NaCl solution for 4 d.
2.3 Methods
Traditional parameters. The dynamic elastic modulus and mass loss of the specimens were tested every 25 cycles. The test is finished when the value of the relative dynamic elastic modulus was reduced to 5% or the value of the mass loss reached 5% or the number of freeze–thaw cycles reached 300.
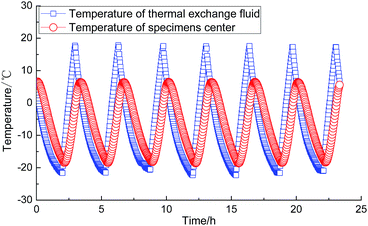
Strain. The strain sensors were connected to a MCU-32 automatic strain data-logger. The data acquisition rate was set every 5 min. Then, the freeze–thaw cycles were started and strain variations were measured and recorded using the test system, which comprised a data-logger and computer. The strain ε was calculated using eqn (1).
| ε = kΔF + bΔT = k(F − F0) + (b − a)(T − T0) | (1) |
3. Results and discussion
3.1 Generation of residual strain
It is found from Fig. 4 that the strain variation paths of the concrete matrix during the cooling phase and the heating phase of every freeze–thaw cycle are not overlapped, forming a hysteresis loop. The phenomenon is generally considered to be caused by “the ink bottle effect”.8,10 There are a number of small-end and big-center pores similar to the ink bottle in concrete. The big pores freeze first during the cooling phase and the small pores thaw in advance during the heating phase. There is some ice captured due to them not being able to move out of “the ink bottles” during the heating phase, causing the values of strain tested at the same temperature during the cooling phase and the heating phase to be different, thereby generating the hysteretic loop. However, the value was not able to return to the beginning when the hysteresis loop was over, indicating that irreversible damage was generated during every freeze–thaw cycle in the concrete matrix.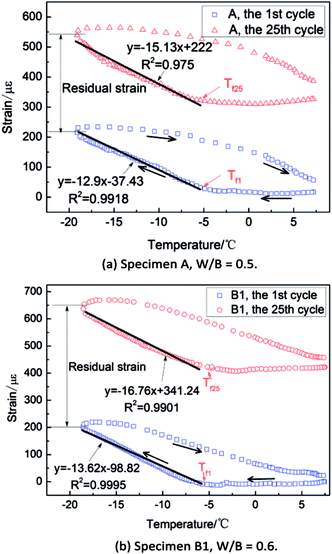 | ||
| Fig. 4 Strain variation of specimen A and B1 with temperature during the 1st cycle and the 25th cycle. | ||
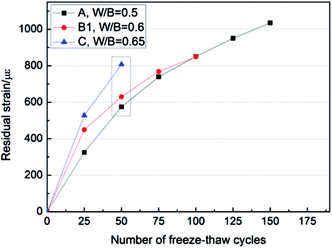
In addition, the hysteretic loops of specimen A and specimen B1 both move up after 25 cycles. The phenomenon could not be explained by “the ink bottle effect” and the most possible reason was that irreversible freeze–thaw damage was generated caused by the initiation and propagation of cracks in the concrete. In other words, residual strain was generated in the concrete matrix. In this study, the residual strain was defined as the difference value between the values of strain tested at the lowest temperature in different freeze–thaw cycle, using the value of strain at the lowest temperature in the first cycle as the initial value. After 25 cycles, the residual strain of specimen A and specimen B1 were 325 με and 449 με, respectively. The smaller the water cement ratio was, the less residual strain was generated.
3.2 Freeze characteristic temperature and apparent frost heaving coefficient
After observing Fig. 4(a) and (b), it was found that there was an obvious strain inflection point in the freezing phase of every hysteresis loop. Ref. 11 defines the corresponding temperature for the strain inflection point as the freeze characteristic temperature Tf, which is influenced not only by the ice crystal nucleation temperature of concrete, but also by the pore structure characteristic parameters, including total porosity and pore distribution. Because the pore sizes are different in concrete, the freezing points of the pore solution are different. Tf is considered to be the temperature when a large amount of the pore solution in concrete begins to freeze, rather than the exact freezing point of the pore solution. Therefore, the cooling phase was divided into to two stages, i.e., before and after Tf, named the initial freezing phase and freezing phase, respectively. The strain tested in these two stages both vary linearly. During the initial freezing phase, most of the pore solution is under supercooled conditions11 and the motivation of strain variation lies in the migration and redistribution of the pore solution, as well as the freezing of a small amount of the pore solution, which causes expansive stress. The expansive stress was not enough to counteract the stress caused by cold contraction, so the strain decreases linearly slightly. During the freezing phase, a large amount of the pore solution in concrete freezes causing the constantly generated expansive stress to increase; therefore, the strain increases linearly with increasing temperature.From the above, the linear part after Tf was used to characterize the deformation of the concrete matrix in which a large amount of the pore solution freezes, so we can conclude that to study the freezing phase was more meaningful. Ref. 9 defines the absolute value of the slope of the linear part as apparent frost heaving coefficient αf, which characterizes the variation velocity of strain after a large amount of the pore solution in concrete freezes, as shown in eqn (2):
 | (2) |
Table 3 shows the Tf, ΔTf, αf and Δαf values of the concrete specimens derived from Fig. 4(a) and (b). It is obvious that the Tf values for specimen B1 in which the water cement ratio was higher in the 1st cycle and the 25th cycle are both higher than those of specimen A. The water cement ratio largely influences the pore structure of the concrete specimen. The higher the water cement ratio, the larger pores content and while the freezing points of the larger pores are higher, the Tf values of specimen B1 are higher. In addition, the Tf values of specimen A and specimen B1 both increase after 25 cycles, because cyclic freeze–thawing causes an increase in the number of pores and larger pores in the concrete sample. The ΔTf value of specimen B1 was higher, indicating that the larger pores content of specimen B1 increases more quickly than that of specimen A; in other words, the degree of damage in specimen B1 was higher during the freeze–thaw cycles. Therefore, ΔTf can be used to characterize the degree of damage in concrete in which the water cement ratios are different and subjected to freeze–thaw cycles.
| Calculated values | Specimen A, W/B = 0.5 | Specimen B1, W/B = 0.6 | ||
|---|---|---|---|---|
| 1st cycle | 25th cycle | 1st cycle | 25th cycle | |
| a ΔTf = the variation of the freeze characteristic temperature and Δαf = the variation of the apparent frost heaving coefficient. | ||||
| Tf (°C) | −6.39 | −6.13 | −6.27 | −5.91 |
| ΔTf = Tf25 − Tf1 (°C) | 0.26 | 0.36 | ||
| αf (10−6 per °C) | 12.9 | 15.13 | 13.62 | 16.76 |
| Δαf = |αf25 − αf1| (10−6 per °C) | 2.23 | 3.14 | ||
The αf values of specimen B1 in the 1st cycle and the 25th cycle are also higher than those of specimen A. In other words, the strain variation velocity of specimen B1 was higher with increasing temperature. Strain can be used to characterize the deformation capacity of the concrete matrix. The higher the deformation rate of the matrix, the looser the matrix, and the poorer the frost resistance of concrete is. After 25 cycles, the αf values of specimen A and specimen B1 increase 2.23 × 10⁻⁶ per °C and 3.14 × 10⁻⁶ per °C, respectively, indicating that the higher the water cement ratio, the higher the Δαf value of concrete. In other words, the more quickly the strain variation increases with temperature, the looser the concrete matrix is, the higher the freeze–thaw damage degree is and the poorer the frost resistance of concrete is. Therefore, Δαf can be used to characterize the frost resistance of concrete in which the water cement ratios are different and subjected to freeze–thaw cycles.
3.3 Residual strain and traditional parameters
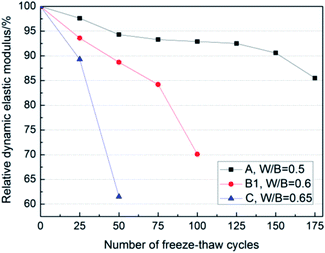 | ||
| Fig. 8 The relative dynamic elastic modulus of concrete with different W/B ratios under freeze–thaw cycling. | ||
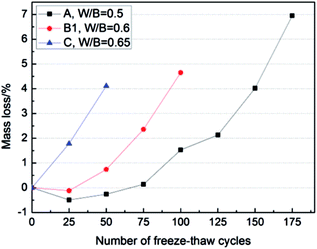
The test results reflected by residual strain and traditional parameters are consistent, indicating that residual strain can be used to characterize the frost resistance of concrete subjected to freeze–thaw cycling-like traditional parameters.
| No. | Number of cycles and increment | Air content (%) | Average bubble diameter (μm) | Specific surface area of bubble (μm2 μm−3) | Bubble distance coefficient (μm) |
|---|---|---|---|---|---|
| A | 0 cycles | 1.952 | 242.673 | 0.0251 | 508.147 |
| 50 cycles | 2.564 | 249.388 | 0.0244 | 491.098 | |
| Increment (%) | 31.352 | 2.767 | −2.789 | −3.355 | |
| B1 | 0 cycles | 2.284 | 248.333 | 0.0246 | 482.674 |
| 50 cycles | 3.197 | 258.702 | 0.0236 | 461.538 | |
| Increment (%) | 39.974 | 4.175 | −4.065 | −4.379 |
Table 4 shows that after 50 freeze–thaw cycles, the air content and bubble diameter increased, while the specific surface area of the bubble and the bubble distance coefficient decreased. The results were attributed to the appearance and extension of the internal microcracks of the concrete sample, which result in an increase in the degree of connectivity and the number of air pores that are connected with the cracks after certain freeze–thaw cycles. Because of this, freezing and expansion occurs and the percentage of air pore volume increases due to the effect of hydrostatic pressure and osmotic pressure, which finally results in the change of all the structural parameters of the concrete sample. The pore distance coefficient is a parameter, which reflects the average length of the pore solution. The decrease in the pore distance coefficient with an increase in the number of freeze–thaw cycles can be used to reflect the increase in the degree of damage in the inner part of the concrete sample and is consistent with the residual strain.
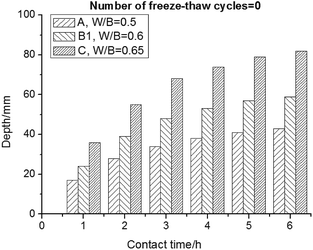
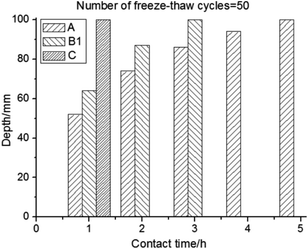
The Cl− migration height of every specimen was higher after 50 freeze–thaw cycles than before within the same steeping time (Fig. 10). Taking 1 h steeping time for example, the Cl− migration heights of specimen A, B1 and C were 17 mm, 24 mm and 36 mm before cyclic freeze–thawing and 52 mm, 64 mm and 100 mm after 50 freeze–thaw cycles. This further proves that the internal damage in concrete occurs after cyclic freeze–thawing, meaning the initiation and propagation of microcracks leading to the connectivity between the cracks and air voids. The irreversible residual strain was generated in this way.
3.4 Establishing a concrete damage numerical model based on residual strain
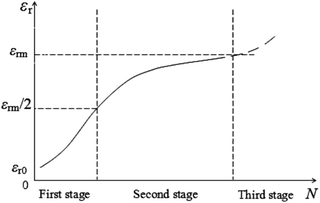
Accelerated growth period: freeze–thaw cycles just begin, so the microcracks and air voids in concrete do not have a large degree of connectivity. “The ink bottle effect”,8,10 which indicates that the large pores freeze first during the cooling phase and the small pores thaw in advance during the heating phase, makes most of the pore solution and ice in concrete unable to migrate freely. The freeze induced tensile stress leads to the generation of the new microcracks, the propagation of the original microcrack tip and increasing water saturation. The repeated and irreversible damage process leads to increasing deformation of the concrete matrix, that is to say, the residual strain increases rapidly. In short, the main driving force of the generated irreversible deformation derives from the freezing and expansion of the pore solution in the concrete matrix.
Slow growth period: with the progress of cyclic freeze–thawing, the degree of connectivity in concrete gradually increases, which makes the number of isolated microcracks with “ink bottle” shapes decrease. Most of the pore solution and ice in the loose concrete can migrate freely during the freeze–thaw cycles. On the other hand, because of the accumulated damage caused by the accelerated growth period, the microcracks in concrete start to connect and their connectivity can relieve the effect of the freeze induced tensile stress, i.e., the residual strain increases slowly. The main driving force of the deformation may be the moisture migration in concrete during this period. This stage shares a large proportion of the whole process and it is the most stable segment.
Aggravated destroy period: the connectivity of the microcracks in concrete increases, leading to a large amount of the external solution to easily enter into the looser concrete to generate a more destructive freeze induced tensile stress. The concrete matrix is too loose to undergo freeze induced tensile stress and the solution migration acting force, so the concrete matrix collapses in an instant, causing a sharp deformation. Consequently, the strain sensor breaks away from the concrete matrix. This stage occurs almost suddenly, sharing little proportion of the whole process, so it may be ignored.
Therefore, the first stage and second stage of residual strain variation can be used to characterize the freeze–thaw damage in concrete. The maximum residual strain value of the second stage can be used as the critical destroy value εrm, which can be directly obtained experimentally.
The residual strain is εr(N) after N freeze–thaw cycles and εr(N) is a continuously differentiable function. Recording the residual strain generated when the first freeze–thaw cycle reaches the lowest temperature as the initial residual strain εr0, a set number of freeze–thaw cycles at the moment is 0 and growth rate of residual strain as λ, and λ is the proportionality coefficient of the increase in εr(N) and εr(N) with unit time. According to the fundamental assumption that λ is a constant value, the increase in residual strain from N to N + ΔN is:
| εr(N + ΔN) − εr(N) = λεr(N)ΔN | (3) |
Namely:
 | (4) |
Taking the integral of the abovementioned equation, then it can be acquired that:
εr(N) = εr0![[thin space (1/6-em)]](https://www.rsc.org/images/entities/char_2009.gif) eλN eλN
| (5) |
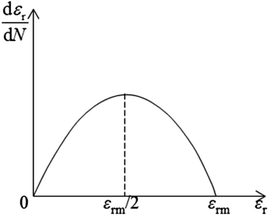
This indicates that the residual strain presents infinite growth according to exponential laws (λ > 0). However, under physical conditions and according to previous analysis, the damage in concrete is staged. It can be known by only reserving the first two stages that the variation velocity of residual strain will increase and then decrease, which is actually in accordance with the blocking model.
 | (6) |
Substituting the abovementioned equation into eqn (4), it can be acquired that:
 | (7) |
Taking the integral of the abovementioned equation it can be acquired that:
 | (8) |
Setting the damage degree variable of concrete after N times of freeze–thaw cycles as ρ, the closer the ρ value is to 1, namely, the closer the εr(N) is to damage critical point εrm, and the closer the concrete will be to complete damage, then:
 | (9) |
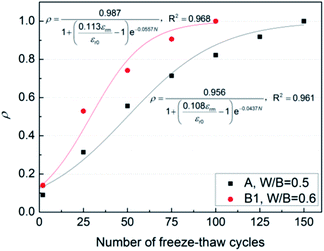
As the frost-heaving force generated within concrete in freeze–thawing process is actually not a constant cyclic strain, the variation velocity of the residual strain is not in accordance with the normal distribution as much, as shown in Fig. 12, and kε is introduced to correct the specific strain value. In addition, by processing the abovementioned freeze–thaw cycle, the residual strain variation is divided into three stages. This study takes the maximum value of residual strain in the second stage as the concrete damage point; however, it is rather hard to accurately quantify this value, i.e., taking the damage value of the damage degree variable as 1 is not entirely accurate. Therefore, kρ was introduced to conduct a correction and it can be acquired that:
 | (10) |
The final damage model is shown in eqn (10) and this model establishes the relationship between the damage degree variable ρ and the number of rapid freeze–thaw cycles. In the equation, for each concrete with a fixed mix proportion, εrm/εr0 is a fixed value, which can be acquired experimentally, while kε, kρ and λ can be acquired by fitting the experimental results.
3.5 Deformation of concrete subjected to freeze–thaw cycling and chloride attack
The residual strain variations in specimens with the same mix proportion under freeze–thaw cycling and freeze–thaw cycling coupled with chloride attack are shown in Fig. 14. It was found that after the same number of freeze–thaw cycles except before 25 cycles, the residual strain values of specimen B2-1 are all higher than those of specimen B2. Taking 50 freeze–thaw cycles for example, the residual strain values of specimen B2-1 and B2 were 45 με and 30 με, respectively.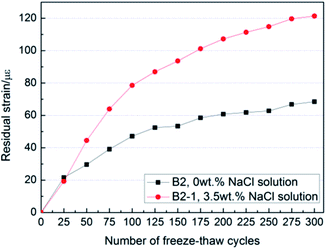 | ||
| Fig. 14 Residual strain of concrete with same mix proportion under freeze–thaw cycles and freeze–thaw cycles coupled with chloride attack. | ||
The residual strain values of specimen B2 tested during the first 25 cycles are higher. While with the process of freeze–thaw cycling, the residual strain values of specimen B2-1 are all higher than those of specimen B2 and the increasing rate was also larger. The possible reason for this finding was that the frost resistance of the concrete specimen was better in the earlier period of the freeze–thaw cycling process. The freezing point of the NaCl solution is lower than water; therefore, the duration of frost stress decreases and the residual strain values of specimen B2-1 decreases. With the process of freeze–thaw cycling, the cracks in concrete are constantly generated and propagate. The NaCl solution in the cracks may accelerate the scaling of the cracks walls, accelerating the surface scaling of concrete. Coupled with the synergy action of frost pressure, osmotic pressure and crystal pressure, this causes the higher and higher internal damage and residual strain values of specimen B2-1.
From the abovementioned findings, freeze–thaw cycling and chloride attack interact and influence each other, exacerbating the damage in concrete. On the one hand, using NaCl solution may bring the influence of osmotic pressure and possible crystal pressure at the lower temperature, exacerbating the damage in concrete subjected to freeze–thaw cycling. On the other hand, cyclic freeze–thawing causes the continued initiation and propagation of cracks in concrete, providing the channels for Cl− migration, accelerating the chloride attack.
4. Conclusions
(1) With the freeze–thaw cycling process, the strain hysteretic loop is raised upwards indicating that residual strain was generated in the concrete matrix. The residual strain generated proves that the damage in the concrete matrix was continuously accumulated and an irreversible deterioration process. This process was directly related to the continued initiation and propagation of cracks in the matrix during the freeze–thaw cycling process.(2) The freeze characteristic temperature Tf was considered to be the temperature when a large amount of the pore solution in concrete begins to freeze, rather than the exact freezing point of the pore solution. The apparent frost heaving coefficient αf was used to characterize the variation velocity of strain after a large amount of the pore solution in the concrete sample froze. The variation of the freeze characteristic temperature ΔTf defined in this study was used to characterize the degree of freeze–thaw damage and the variation of the apparent frost heaving coefficient Δαf was used to characterize the frost resistance of concrete.
(3) The test results of the freeze–thaw damage reflected by the residual strain and traditional parameters were consistent and theoretical analysis was used to deduct a numerical model, which showed the relationship between the degree of freeze–thaw damage and residual strain, and accurate verification of this model indicates that the residual strain could be used to characterize the frost resistance of concrete subjected to freeze–thaw cycling-like traditional parameters.
Acknowledgements
Support from the National High-tech Research and Development Program of China (863 Program, Grant No. 2015AA034701), the Natural Science Foundation of Shandong Province, China (Grant No. ZR2014EL007) and the Open Project of State Key Laboratory of Silicate Materials for Architectures (Wuhan University of Technology, China) (Grant No. SYSJJ2016-10) are greatly acknowledged.Notes and references
- T. C. Powers, A working hypothesis for further studies of frost resistance of concrete, J. Am. Concr. Inst., 1945, 16, 245–272 Search PubMed.
- G. W. Scherer, Crystallization in pores, Cem. Concr. Res., 1999, 8, 1347–1358 CrossRef.
- S. Jacobsen, E. J. Sellevold and S. Matala, Frost durability of high strength concrete: effect of internal cracking on ice formation, Cem. Concr. Res., 1996, 26(6), 919–931 CrossRef CAS.
- R. Mu, W. Tian and M. Zhou, Moisture migration in concrete exposed to freeze–thaw cycle, J. Chin. Ceram. Soc., 2010, 38(9), 1713–1717 CAS.
- V. Penttala, Surface and internal deterioration of concrete due to saline and non-saline freeze–thaw loads, Cem. Concr. Res., 2006, 36(5), 921–928 CrossRef CAS.
- W. Sun, R. Mu, X. Luo and C. W. Miao, Effect of chloride salt, freeze–thaw cycling and externally applied load on the performance of the concrete, Cem. Concr. Res., 2002, 32(12), 1859–1864 CrossRef CAS.
- R. Şahin, M. A. Tasdemir, R. Gul and C. Celik, Determination of the optimum conditions for de-icing salt scaling resistance of concrete by visual examination and surface scaling, Constrution and Building Materials, 2010, vol.24(3), pp. 353–360 Search PubMed.
- J. Kaufmann, Experimental identification of ice formation in small concrete pores, Cem. Concr. Res., 2004, 34(8), 1421–1427 CrossRef CAS.
- L. Wang, Y. Cao, Z. D. Wang and P. Du, Evolution and characterization of damage of concrete under freeze–thaw cycles, J. Wuhan Univ. Technol., Mater. Sci. Ed., 2013, 28(4), 710–714 CrossRef.
- N. Banthia, M. Pigeon and L. Lachance, Calorimetric study of freezable water in cement paste, Cem. Concr. Res., 1989, 19, 939–950 CrossRef CAS.
- O. Coussy and P. J. M. Monteiro, Poroelastic model for concrete exposed to freezing temperatures, Cem. Concr. Res., 2008, 38, 40–48 CrossRef CAS.
| This journal is © The Royal Society of Chemistry 2016 |

