Optimization of (Cu2Sn)xZn3(1−x)S3/CdS pn junction photoelectrodes for solar water reduction†
Yubin Chen*,
Zhixiao Qin,
Tao Chen,
Jinzhan Su,
Xiaoyang Feng and
Maochang Liu
International Research Center for Renewable Energy, State Key Laboratory of Multiphase Flow in Power Engineering, Xi'an Jiaotong University, Shaanxi 710049, P. R. China. E-mail: ybchen@mail.xjtu.edu.cn
First published on 13th June 2016
Abstract
Surface modification of p-type Cu2ZnSnS4 films with n-type semiconductors is an efficient way to enhance the properties for photoelectrochemical water reduction. However, the detailed optimization of the pn junction photoelectrodes and examination of the underlying mechanism are seldom reported. Herein, Cu2ZnSnS4-derived (Cu2Sn)0.45Zn1.65S3 (CTZS) nanocrystal films were first fabricated, and subsequently coated with n-type CdS layers to form CTZS/CdS photoelectrodes. To obtain an insight into the pn junction, we have examined the depletion region widths that extended into both CTZS and CdS layers. It was revealed that the CdS layer was fully depleted and the CTZS layer was partially depleted in CTZS/CdS photoelectrodes. Consequently, increased CTZS thickness led to the decreased charge separation, and increased CdS thickness resulted in the improved charge separation. Owing to the balance of light absorption and charge separation, CTZS/CdS films with moderate thicknesses of CTZS and CdS layers showed the highest photocurrent. Meanwhile, the annealing treatment for CTZS/CdS film was indispensable for the improved property. After Pt modification, the incident photon to current conversion efficiency could reach 24.7% at 450 nm, which was among the best values for Cu2ZnSnS4-based photocathodes. This work is expected to provide general guidance for exploring efficient photoelectrodes with pn junction structure.
1. Introduction
Photoelectrochemical (PEC) water splitting for hydrogen generation has been considered as a promising route to convert and store solar energy into chemical fuels.1–3 A number of semiconductors have been investigated as photoelectrode materials for water splitting during the last decades.4–9 However, up to now it has proven difficult to identify a single semiconductor which can simultaneously harvest substantial solar light, own appropriate band positions to drive the surface redox reactions, and show adequate stability in the aqueous electrolytes. Alternatively, it seems more feasible to apply two semiconductor photoelectrodes for the separate hydrogen evolution reaction (HER) and oxygen evolution reaction (OER), and combine them into a tandem PEC cell for overall water splitting.10 Numerous n-type semiconductors have been investigated as photoanodes for OER. Nevertheless, limited work has been carried out on p-type semiconductors as photocathodes for HER.11,12 Since the p-type semiconductor based photocathodes can be cathodically protected from the photooxidation to some extent, the search for efficient photocathodes has not been restricted to metal oxide semiconductors.13The p-type semiconductor Cu2ZnSnS4 has received numerous attentions as a promising light-absorbing material, owing to the high absorption coefficient (>104 M−1 cm−1), narrow bandgap (∼1.5 eV), low toxicity, and abundant elements.14–16 Power conversion efficiency of 8.5% was obtained for Cu2ZnSnS4 solar cell, and an efficiency of 12.6% has been reached by partially replacing S with Se.17,18 Recently, the good property in solar cell has promoted the utilization of p-type Cu2ZnSnS4 as a photocathode material for PEC water reduction.19–26 Wang and coworkers presented the facile non-vacuum routes to fabricate Cu2ZnSnS4 films for water splitting, and good PEC performance and chemical stability were achieved.21,22 Guan et al. demonstrated that ZnS impurities could impede charge transfer in Cu2ZnSnS4 due to high resistance and lower the photocurrent, and a Cu2ZnSnS4 photocathode without ZnS showed a higher photocurrent.23 Li et al. presented a scalable route to fabricate single crystalline Cu2ZnSnS4 nanosheet arrays, which showed a high photocurrent density of −1.32 mA cm−2.25 However, most of the reported bare Cu2ZnSnS4 photoelectrodes exhibited poor photocurrents, which restricted the further application. Recently, our group introduced a series of (Cu2Sn)xZn3(1−x)S3 nanocrystal films by tuning (Cu + Sn)/Zn molar ratios based on Cu2ZnSnS4.27 Compared to Cu2ZnSnS4 (x = 0.75) film, (Cu2Sn)0.45Zn1.65S3 (x = 0.45) film exhibited 4 times higher photocurrent due to its suitable band structure, morphology, and smallest compositional deviation. Nevertheless, the efficiency of (Cu2Sn)xZn3(1−x)S3 photocathode was still limited due to the low charge separation efficiency, and further modification should be carried out.
It was reported that surface modification of p-type photocathode with n-type semiconductor is an efficient way to enhance the PEC property.28 The n-type semiconductor CdS layer has been deposited onto Cu2ZnSnS4 film to form a pn junction, which resulted in the improved PEC performance.21,29 However, the detailed optimization of Cu2ZnSnS4/CdS pn junction photoelectrodes and careful examination of the underlying mechanism were seldom conducted, which is crucial to developing highly efficient photoelectrodes. In addition, the reported modification was based on the less efficient Cu2ZnSnS4 film. If (Cu2Sn)xZn3(1−x)S3 photoelectrode with superior activity is coupled with n-type semiconductor, significantly improved PEC property can be expected.
Herein, (Cu2Sn)0.45Zn1.65S3 (CTZS) film was fabricated by a solution-based method, and CdS layer was coated onto CTZS film via a chemical bath method. The photocurrent of CTZS photocathode could be greatly improved by CdS modification. In order to obtain an insight of the pn junction, we have examined the depletion region widths that extended into both CTZS and CdS layers. By regulating the CTZS thickness, the deposition condition of CdS layer, and the CdS thickness, the photocurrent of CTZS/CdS pn junction photoelectrodes could be optimized. With the further modification using Pt promoter, the observed incident photon to current conversion efficiency could reach 24.7% at 450 nm, which was among the best values for Cu2ZnSnS4-based photocathodes.
2. Experimental
2.1 Thin film fabrication
(Cu2Sn)0.45Zn1.65S3 (CTZS) thin film was fabricated by a solution-based method reported in our previous study.27 In typical, CTZS nanocrystals were firstly synthesized via a hot-injection method, which were subsequently deposited onto fluorine-doped tin oxide (FTO) coated glass substrates by an electrophoretic deposition (EPD) route. The thickness of the CTZS film could be controlled by the number of EPD cycles. CdS layer was prepared by a chemical bath deposition (CBD) method. The obtained CTZS electrode or FTO substrate was immersed into 50 mL of CBD solution with 0.03 M of Cu(OAc)2, 0.35 M of thiourea, and 7.5 M of ammonia, and the deposition process was performed at 75 °C. The thickness of CdS layer could be varied by tuning the deposition time. After coating, the electrode was taken out, rinsed with deionized water, and dried with compressed nitrogen gas. The as-prepared CTZS/CdS or CdS thin film was finally annealed at 200 °C for 30 min. Pt deposition was carried out by a photoelectrochemical method. Typically, the CTZS/CdS electrode was immersed into 100 mL of 0.1 M Na2SO4 aqueous solution with 1 μmol of H2PtCl6, which was illuminated by a 300 W xenon lamp for 5 min under the potential of −0.55 V vs. SCE (saturated calomel electrode).2.2 Characterization
X-ray diffraction (XRD) patterns of varied samples were examined to determine the crystal structure by a PANalytical X'pert MPD Pro X-ray diffractometer. UV-visible-near-IR absorption spectra were recorded to investigate the optical properties by using a HITACHI U-4100 spectrophotometer. The morphology and microstructure of CTZS nanocrystals were examined on a FEI Tecnai G2 F30 S-Twin transmission electron microscope (TEM). The morphology and thickness of the films were analyzed with a JEOL JSM-7800F field-emission scanning electron microscope (FESEM). The elemental composition of the prepared sample was determined by a Noran energy dispersive X-ray spectroscopy (EDX) system attached to the FESEM. The EDX measurement was carried out in an area of 10 × 10 μm2. Every sample was examined 3 times in different regions. Mott–Schottky plots and electrochemical impedance spectra (EIS) were recorded with a CHI 760D electrochemical workstation. Mott–Schottky measurements were carried out at the frequency of 5 kHz. EIS measurements were done at 0 V vs. RHE. The amplitude of the sinusoidal wave was 5.0 mV and the frequency range examined was from 100 KHz to 0.1 Hz.2.3 Photoelectrochemical measurement
The photoelectrochemical (PEC) tests were carried out in a three-electrode cell with a SCE as the reference electrode and a platinum wire as the counter electrode. A 300 W xenon lamp was used as the light source. The 0.1 M Na2SO4 aqueous solution (pH adjusted to 3 by H2SO4) was used as the electrolyte. The current–potential and current–time curves were recorded with a CHI 760D electrochemical workstation. To facilitate the analysis, all potentials vs. SCE were converted to the RHE scale according to the Nernst equation in eqn (1) where ERHE is the potential vs. RHE, EθSCE = 0.2415 V at 25 °C, and ESCE is the experimentally measured potential vs. SCE. The incident photon to current conversion efficiency (IPCE) measurement was carried out using a home-built system. Broad solar illumination from a 300 W xenon lamp was directed into a monochromator (Newport-74125) and the incident light intensity from the monochromator was determined with a fiber optic spectrometer (AvaSpec-2048). The measured light intensities were shown in Table S1.† The photocurrent was monitored with a CHI 760D electrochemical workstation. The IPCE was calculated based on the photocurrent under monochromatic light irradiation using eqn (2) where I (A m−2) is the photocurrent density, λ (nm) is the incident light wavelength, and J (W m−2) is the measured incident irradiance.| ERHE = ESCE + 0.059pH + EθSCE | (1) |
 | (2) |
3. Results and discussion
3.1 Morphology, crystal structure, and optical property
The morphologies of the prepared (Cu2Sn)0.45Zn1.65S3 (CTZS) and CTZS/CdS films were characterized by FESEM. As shown in Fig. 1a and b, CTZS nanocrystals were densely and evenly deposited on the substrate without noticeable cracks. The CTZS film owned a thickness of ca. 250 nm, and close-packed CTZS nanocrystals were tightly adhered to the FTO substrate. TEM images in Fig. S1† revealed that the as-prepared CTZS nanocrystals with a size of ca. 15 nm were highly crystallized and displayed single-crystal character. The FESEM and TEM results indicated that the polycrystalline CTZS film with good quality was successfully acquired by the solution-based method. CdS coating layer was deposited on the surface of the CTZS film by a CBD route. Fig. 1c presents the top-view FESEM image of the CTZS/CdS composite film. Compared to the CTZS film, the surface of the CdS layer became much rougher, which should result from the aggregated CdS nanoparticles. The side-view FESEM image in Fig. 1d clearly showed a CdS thin layer of ca. 70 nm. It was noted that the CdS layer was closely attached to the CTZS layer, and the CTZS layer was closely adhered to the FTO substrate. These close contacts between different layers should be crucial to the efficient charge transfer. The elemental compositions of CTZS and CdS samples were examined by an EDX system attached to the FESEM. As observed in Table S2,† the relative elemental compositions determined by EDX were in good agreement with the stoichiometric compositions.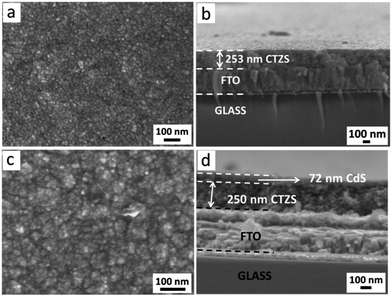 | ||
| Fig. 1 Top-view (a) and side-view (b) FESEM images of the CTZS film. Top-view (c) and side-view (d) FESEM images of the CTZS/CdS film. | ||
Fig. 2a shows the XRD patterns of CTZS and CTZS/CdS films. The diffraction peaks for CTZS film observed at 2θ values of 28.51°, 47.46°, and 56.15° were indexed to kesterite structure.27 Meanwhile, diffraction peaks attributed to tin oxide from the FTO substrate could be observed, since the prepared CTZS film was quite thin. The XRD pattern of CTZS/CdS film exhibited the typical peaks of kesterite CTZS. Besides, the diffraction peaks at 2θ values of 26.61°, 44.31° and 51.60° corresponding to zinc-blende CdS (JCPDS no. 89-0440) could be found, which was in agreement with the reported results for CdS prepared by the CBD method.30 It should be noted that the kesterite structure is derived from the zinc-blende structure.31 Therefore, the similar crystal structures could ensure the formation of high-quality heterojunction between kesterite CTZS and zinc-blende CdS.
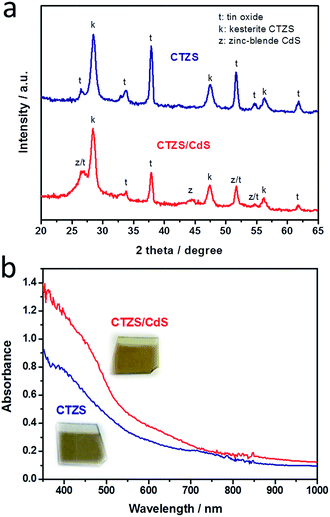 | ||
| Fig. 2 (a) XRD patterns of CTZS and CTZS/CdS films. (b) UV-visible-near-IR absorption spectra and the photographs (inset) of CTZS and CTZS/CdS films. | ||
UV-visible-near-IR absorption spectra of the prepared CTZS and CTZS/CdS films were examined to study the optical properties. As shown in Fig. 2b, the CTZS film displayed broad absorption up to 900 nm, indicating the good utilization of the visible light and near-infrared light. The CTZS/CdS film showed apparently improved absorption in the UV and visible region compared to CTZS film, due to the successful CdS coating. In addition, the absorption spectrum exhibited a new onset at ca. 550 nm, which corresponded to the band-to-band absorption of CdS. The accurate optical bandgaps can be determined by extrapolating the linear portion of the (αhν)2 vs. hν plots (Fig. S2†) where α is the optical absorption coefficient and hν is the photon energy.32 It was noted that the bandgaps of CTZS and CdS were respectively 1.64 and 2.3 eV, which were in agreement with the reported results.27,33 The digital photographs of the prepared electrodes (inset of Fig. 2) showed that the CTZS film was dark brown and the CTZS/CdS film was yellow brown, owing to the different absorption features.
3.2 Determination of the depletion region width
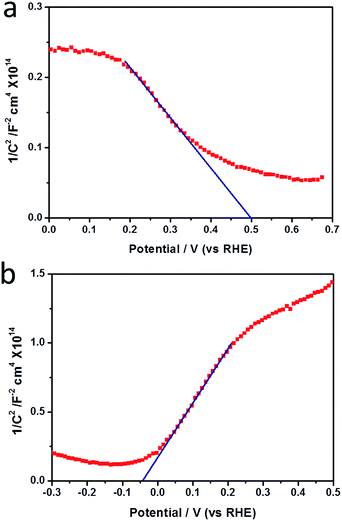
Mott–Schottky (MS) plots of CTZS and CdS films were examined to determine the carrier densities and flat potentials. As shown in Fig. 3a and b, the negative and positive slopes of the linear regions demonstrated the p-type character of CTZS and n-type character of CdS. The slopes measured from the MS plots can be used to calculate the carrier densities by the eqn (3), where N is the carrier density, e is the electron charge, k is the slope of the linear region in the MS plot, ε is the relative dielectric constant of the active film, and ε0 is the vacuum permittivity.34,35 With the ε values of 6.7 for CTZS and 10 for CdS,36,37 the carrier densities of CTZS and CdS films were respectively determined to be 2.87 × 1017 cm−3 and 3.54 × 1016 cm−3, which were close to the reported values.38,39
 | (3) |
The flat-band potentials of CTZS and CdS were estimated to be 0.5 and −0.04 VRHE by the x-axis intercepts of the linear regions in the MS plots. The value of the Fermi energy (EF) could be estimated from the flat-band potential.40,41 It was assumed that the difference of the valance band maximum (VBM) and the Fermi energy of CTZS, as well as the difference of the conduction band minimum (CBM) and the Fermi energy of CdS were 0.2 eV.39,42 Since the bandgaps of CTZS and CdS were respectively 1.64 eV and 2.3 eV in the present study, the energy positions of VBM for CTZS and CdS should be 0.7 eV and 2.06 eV, and the energy positions of CBM should be −0.94 eV and −0.24 eV. As a consequence, a type II band alignment was constructed in the CTZS/CdS composite film.
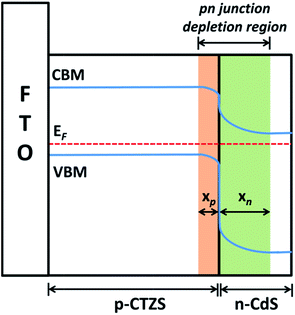
When the p-type CTZS film was coated with the n-type CdS layer, it was believed that a pn junction was generated between two semiconductors. Considering the type II band alignment of the CTZS/CdS composite film, the energy-band diagram for the pn junction in thermal equilibrium could be depicted in Fig. 4, where a depletion region was formed at the interface. The depletion region widths extended into the p-type and n-type semiconductors were respectively denoted as xp and xn. The conduction and valance band energies would bend through the depletion region, since the relative positions of the conduction and valence bands with respect to the Fermi energy changed between p and n regions. When CTZS/CdS film was illuminated by the incident light, the photogenerated electrons and holes would be obtained in CTZS and CdS layers. As a result of the built-in electric field induced by the pn junction, the photogenerated electrons in the CBM of CTZS could migrate to the CBM of CdS, and the photogenerated holes in the VBM of CdS could migrate to the VBM of CTZS, leading to the efficient charge separation in CTZS/CdS film.43,44 It should be noted that only the photoexcited charges in or close to the depletion region can be driven by the built-in electric field.45 Therefore, the depletion region width is crucial to the charge separation efficiency.
According to the Poisson's equation, xp at the applied voltage of 0 VRHE can be calculated by eqn (4),45 where Np and Nn are respectively the activated carrier densities of the p- and n-type layers, εp and εn are respectively the relative dielectric constants of the p- and n-type layers, and Vbi is the built-in potential barrier, which can be determined as the difference between the intrinsic Fermi levels in the p and n regions.46 Herein, the value of Vbi is 0.54 VRHE. Similarly, xn at the applied voltage of 0 VRHE can be determined by eqn (5). Consequently, the calculated xp in the CTZS layer and xn in the CdS layer should be 14.7 and 119.4 nm, respectively.
 | (4) |
 | (5) |
3.3 Optimization of the CTZS thickness
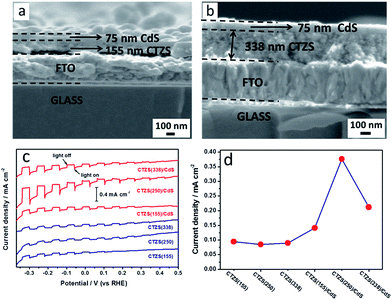
It was considered that the thickness of CTZS layer played an important role in the PEC performance of the CTZS/CdS pn junction photoelectrode. On one hand, the thick CTZS film could harvest more photons, which led to more generated charge carriers. On the other hand, the thick CTZS film might result in low charge separation efficiency, since the depletion region width in CTZS was only 14.7 nm. In order to investigate the detailed effect of the CTZS thickness, CTZS films with varied thicknesses were fabricated by controlling the number of EPD cycles. As shown in Fig. 5a, 1d and 5b, CTZS films with one, two, and three deposition cycles were respectively modified with the CdS layer. It was noticed that the CTZS film thickness was gradually increased from 155 to 250, and 338 nm with the increased EPD cycle. All samples owned the similar CdS thickness of ca. 70 nm, because the CBD condition was kept constant.Fig. 5c shows the current-potential curves of different CTZS and CTZS/CdS films under chopped illumination. Herein, the as-prepared films were denoted as CTZS(X) and CTZS(X)/CdS, where X represented the thickness (nm) of CTZS films. It was found that the bare CTZS film generated cathodic photocurrents, reflecting its p-type behavior. The CTZS films with different thicknesses exhibited close photocurrents, which was in agreement with the previous result.27 After CdS layer was coated, the photocurrent was clearly improved over the entire tested potential range. Meanwhile, the onset potential was increased from +0.25 to +0.45 VRHE. For the PEC water splitting, it was crucial to increase the onset potential of photocathodes and decrease that of photoanodes to lower the applied external bias voltage. As shown in Fig. 5d, the photocurrent densities of CTZS films were around −0.09 mA cm−2 at −0.24 VRHE. However, the photocurrents were different for CTZS/CdS films with varied CTZS thicknesses. The photocurrent densities were in the order of CTZS(250)/CdS > CTZS(338)/CdS > CTZS(155)/CdS. In particular, CTZS(250)/CdS film had a photocurrent density of −0.38 mA cm−2 at −0.24 VRHE, which was more than 4 times higher than that of CTZS(250) film.
As seen from top-view FESEM images, the thickness of CdS layer in CTZS/CdS samples was ca. 70 nm, which was much smaller than the calculated xn of 119.4 nm. Under this condition, the thin CdS layer was fully depleted, resulting in cathodic polarization. However, the thickness of CTZS layer in CTZS/CdS samples greatly exceeded xp of 14.7 nm, indicating that CTZS layer was partially depleted. The photogenerated electrons in the CTZS semiconductor far from its depletion region needed to travel a long way to reach the depletion region so as to be driven into the CdS layer. It was deduced that the increased thickness of CTZS layer in CTZS/CdS film could result in more serious charge recombination due to the longer migration distance. This inference could be supported by the electrochemical impedance spectroscopy (EIS) Nyquist plots. As shown in Fig. 6, with the increased thickness of CTZS, a larger arc radius was observed for CTZS/CdS, indicating the gradually increased impedance. The impedance plots for these electrodes could be fitted to an equivalent circuit consisting of the series resistance (Rs), recombination resistance (Rrec), charge-transfer resistance (Rct), and constant phase element (CPE). The fitted parameters were summarized in Table 1. It was found that Rct was the major resistance, and CTZS(155)/CdS owned the smallest Rct, revealing the most efficient charge transfer.47 In addition to the charge separation, the PEC property was also influenced by the optical property of the as-prepared film. The much thicker CTZS layer could absorb more photons to generate higher concentration of charge carriers for the PEC reaction. Therefore, taking both light absorption and charge separation into account, the highest photocurrent was achieved for CTZS(250)/CdS film.
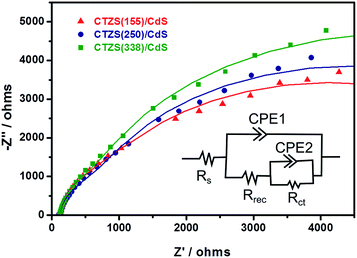 | ||
| Fig. 6 EIS Nyquist plots of various CTZS/CdS films with different CTZS thicknesses. The inset shows the proposed equivalent circuit. | ||
| Sample | Rs (ohm) | Rrec (ohm) | Rct (ohm) |
|---|---|---|---|
| CTZS(155)/CdS | 121.4 | 2943 | 4532 |
| CTZS(250)/CdS | 120.2 | 2355 | 6377 |
| CTZS(338)/CdS | 119.9 | 2702 | 7297 |
3.4 Optimization of the CdS coating
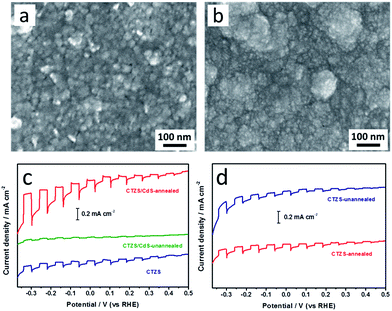
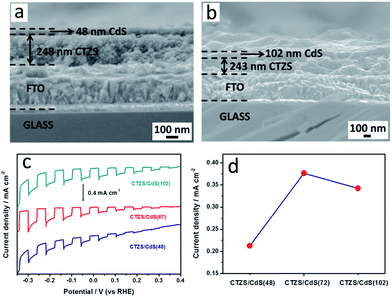
Since CdS modification could promote the charge separation of the CTZS film, the deposition condition of the CdS layer should be essential. In the present study, an annealing process (200 °C for 30 min) was carried out after the CBD of CdS layer. Before annealing, small CdS nanoparticles with the size of ca. 10 nm were found in Fig. 7a. The porous morphology could be also discovered, indicating the loose contacts between different CdS nanoparticles. After annealing, CdS nanoparticles aggregated together to form the secondary particles with the size of ca. 100 nm (Fig. 7b). Meanwhile, the dense CdS film without noticeable pores could be achieved. As shown in Fig. 7c, the annealed CTZS/CdS film exhibited improved photocurrent compared to the CTZS film. However, the photocurrent of the unannealed film was even smaller than that of the CTZS film. To make it clear, we investigated the influence of annealing on the PEC property of the bare CTZS film. As displayed in Fig. 7d, CTZS films before and after annealing displayed similar photocurrents. These results indicated that the annealing treatment mainly affected the properties of the CdS layer, which led to the varied PEC performances. For the unannealed CTZS/CdS film, the crystallinity of CdS nanoparticles might be poor, and numerous defects could be generated. When the photoexcited electrons transferred to the CdS layer, the defects and loose contacts between different nanoparticles would lead to serious charge recombination, thus decreasing the photocurrent. The annealing treatment could improve the crystallinity of CdS nanoparticles and form the dense CdS film, which was beneficial to the efficient charge transfer. As a consequence, the improved photocurrent was achieved.In order to investigate the effect of the CdS thickness on the PEC performance of CTZS/CdS pn junction photoelectrode, CTZS/CdS films with varied CdS thicknesses were fabricated. As shown in Fig. 8a, 1d and 8b, three CTZS films with two EPD cycles were respectively modified by the CdS layers with the CBD time of 1, 2, and 5 min. It was found that the CdS film thickness was gradually increased from 48 to 72, and 102 nm with the increased deposition time. The thicknesses of the CdS layers in all three CTZS/CdS samples were smaller than xn of 119.4 nm to insure the full depletion.
Fig. 8c shows the current–potential curves of CTZS/CdS films with different CdS thicknesses. The as-prepared films were denoted as CTZS/CdS(Y), where Y represented the thickness (nm) of CdS layer. It was found that with the increased CdS thickness, the photocurrent first increased and then decreased. The CTZS/CdS film with the CdS thickness of 72 nm exhibited the highest PEC property. As shown in Fig. 8d, all CTZS/CdS films had higher photocurrents compared to the bare CTZS film (Fig. 5d). CTZS/CdS(72) film had a photocurrent density of −0.38 mA cm−2 at −0.24 VRHE. Since the CdS layer was fully depleted in the CTZS/CdS film, higher charge separation efficiency could be expected with the thicker CdS layer due to the wider depletion region. Hence, the photocurrent of CTZS/CdS(72) film was higher than that of CTZS/CdS(48) film. However, when the CdS thickness was further increased to 102 nm, a large amount of incident light would be harvested by CdS, leading to the poor light-absorption by the CTZS film. The reduced amount of photogenerated charge carriers in the CTZS layer finally resulted in the decreased photocurrent.
3.5 Pt modification
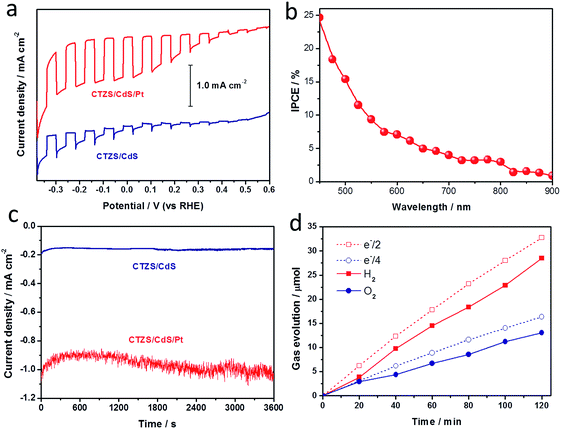
Pt was reported to be an efficient promoter to enhance the activity of photocathodes.48 The CTZS/CdS photoelectrode with the respective CTZS and CdS thicknesses of 250 and 72 nm was used to investigate the effect of Pt modification. The amount of deposited Pt has been measured by EDX. The molar concentration of Pt compared to CTZS was ca. 3.5% in the CTZS/CdS/Pt photoelectrode. It could be observed in Fig. 9a that the PEC property of the CTZS/CdS electrode was greatly improved by the photoelectrochemically deposited Pt promoter, with the photocurrent density up to −1.0 mA cm−2 at 0 VRHE. In addition to the current-potential performance, the photoactivity of the photocathode as a function of wavelength was quantitatively investigated by incident photon to current conversion efficiency (IPCE) performance. The IPCE of the CTZS/CdS/Pt film was measured under irradiation of monochromatic light at 0 VRHE. As shown in Fig. 9b, the obtained IPCE was observed in the whole visible light region, signifying the advantage of narrow bandgap semiconductors for harvesting sunlight. With the decreased wavelength, the IPCE value gradually increased. The observed IPCE could reach 24.7% at 450 nm, which was among the best values for Cu2ZnSnS4-based photocathodes.19–29In addition to the photocurrent, the stability of the photoelectrode was also important for the practical application. In order to examine the durability of the CTZS/CdS and CTZS/CdS/Pt films, the time course of the photocurrent was measured. Fig. 9c presents the current–time curves of the CTZS/CdS and CTZS/CdS/Pt films at 0 VRHE in the 0.1 M Na2SO4 solution (pH ∼ 3). It was noted that the stable cathodic photocurrents were confirmed in 3600 s, indicating the good durability. Since the local environment at the photoelectrode/electrolyte interface tends to be rather hostile owing to the surface redox reactions,13 further improving the stability by depositing a stable metal–oxide layer on the surface of the CTZS/CdS electrode to prevent its direct contact with the electrolyte should be carried out in the future. The evolved hydrogen and oxygen over the CTZS/CdS/Pt film were tested in a three-electrode configuration at 0 VRHE. As shown in Fig. 9d, the simultaneous generation of hydrogen and oxygen with the molar ratio of around 2![[thin space (1/6-em)]](https://www.rsc.org/images/entities/char_2009.gif) :
:![[thin space (1/6-em)]](https://www.rsc.org/images/entities/char_2009.gif) 1 was demonstrated for the PEC process. By comparing the generated hydrogen amount with the expected amount based on the photocurrent, the faradaic efficiency of the CTZS/CdS/Pt photoelectrode was estimated to be 87%.
1 was demonstrated for the PEC process. By comparing the generated hydrogen amount with the expected amount based on the photocurrent, the faradaic efficiency of the CTZS/CdS/Pt photoelectrode was estimated to be 87%.
4. Conclusions
In summary, p-type (Cu2Sn)0.45Zn1.65S3 (CTZS) nanocrystal film was prepared by a solution-based method. The n-type CdS layer was coated onto the CTZS film via a chemical bath method, leading to the formation of CTZS/CdS pn junction photoelectrode. Compared to CTZS film, CTZS/CdS films showed the apparently increased properties for PEC water reduction. The depletion region widths in CTZS and CdS layers were determined for the CTZS/CdS pn junction photoelectrode. It was noticed that CdS layer was fully depleted and CTZS layer was partially depleted. As a consequence, the increased CTZS thickness would lead to the decreased charge separation, and the increased CdS thickness would result in the improved charge separation. Due to the balance of light absorption and charge separation, there were optimal CTZS and CdS thicknesses for CTZS/CdS photocathodes. The annealing treatment was demonstrated to be indispensable for the CTZS/CdS film. It could improve the crystallinity of CdS nanoparticles and form the dense CdS layer, which was beneficial to the efficient charge transfer. After Pt modification, the composite photoelectrode showed significantly improved photocurrent and good stability, with the IPCE of 24.7% at 450 nm, which was among the best values for Cu2ZnSnS4-based photocathodes in water splitting.Acknowledgements
The authors thank the financial support from the National Natural Science Foundation of China (No. 51236007 and 51323011), the grant support from the China Postdoctoral Science Foundation (No. 2014M560768), and the China Fundamental Research Funds for the Central Universities (xjj2015041).References
- S. S. Mao and S. Shen, Nat. Photonics, 2013, 7, 944 CrossRef CAS.
- Y. Tachibana, L. Vayssieres and J. R. Durrant, Nat. Photonics, 2012, 6, 511 CrossRef CAS.
- M. G. Walter, E. L. Warren, J. R. McKone, S. W. Boettcher, Q. X. Mi, E. A. Santori and N. S. Lewis, Chem. Rev., 2010, 110, 6446 CrossRef CAS PubMed.
- M. T. Mayer, Y. Lin, G. Yuan and D. Wang, Acc. Chem. Res., 2013, 46, 1558 CrossRef CAS PubMed.
- X. Chen, S. Shen, L. Guo and S. S. Mao, Chem. Rev., 2010, 110, 6503 CrossRef CAS PubMed.
- A. Kudo and Y. Miseki, Chem. Soc. Rev., 2009, 38, 253 RSC.
- K. Sun, S. Shen, Y. Liang, P. E. Burrows, S. S. Mao and D. L. Wang, Chem. Rev., 2014, 114, 8662 CrossRef CAS PubMed.
- Y. Li and J. Zhang, Laser Photonics Rev., 2010, 4, 517 CrossRef CAS.
- J. Li and N. Wu, Catal. Sci. Technol., 2015, 5, 1360 CAS.
- M. S. Prevot and K. Sivula, J. Phys. Chem. C, 2013, 117, 17879 CAS.
- Q. Huang, Z. Ye and X. D. Xiao, J. Mater. Chem. A, 2015, 3, 15824 CAS.
- N. K. Awad, E. A. Ashour and N. K. Allam, J. Renewable Sustainable Energy, 2014, 6, 022702 CrossRef.
- T. J. Jacobsson, V. Fjällström, M. Edoff and T. Edvinsson, Energy Environ. Sci., 2014, 7, 2056 CAS.
- H. Zhou, W. Hsu, H. Duan, B. Bob, W. Yang, T. Song, C. Hsu and Y. Yang, Energy Environ. Sci., 2013, 6, 2822 CAS.
- W. Yang, H. Duan, K. Cha, C. Hsu, W. Hsu, H. Zhou, B. Bob and Y. Yang, J. Am. Chem. Soc., 2013, 135, 6915 CrossRef CAS PubMed.
- A. Singh, H. Geaney, F. Laffir and K. M. Ryan, J. Am. Chem. Soc., 2012, 134, 2910 CrossRef CAS PubMed.
- M. A. Green, K. Emery, Y. Hishikawa, W. Warta and E. D. Dunlop, Prog. Photovoltaics Res. Appl., 2015, 23, 1 CrossRef.
- W. Wang, M. T. Winkler, O. Gunawan, T. Gokmen, T. K. Todorov, Y. Zhu and D. B. Mitzi, Adv. Energy Mater., 2014, 4, 1301465 Search PubMed.
- D. Yokoyama, T. Minegishi, K. Jimbo, T. Hisatomi, G. Ma, M. Katayama, J. Kubota, H. Katagiri and K. Domen, Appl. Phys. Express, 2010, 3, 101202 CrossRef.
- Y. Zhang, S. Ouyang, Q. Yu, P. Li and J. Ye, Chem. Commun., 2015, 51, 14057 RSC.
- J. Wang, P. Zhang, X. Song and L. Gao, RSC Adv., 2014, 4, 21318 RSC.
- J. Wang, P. Zhang, X. Song and L. Gao, RSC Adv., 2015, 5, 1220 RSC.
- Z. Guan, W. Luo and Z. Zou, CrystEngComm, 2014, 16, 2929 RSC.
- X. Wen, W. Luo and Z. Zou, J. Mater. Chem. A, 2013, 1, 15479 CAS.
- B. J. Li, P. F. Yin, Y. Z. Zhou, Z. M. Gao, T. Ling and X. W. Du, RSC Adv., 2015, 5, 2543 RSC.
- N. Guijarro, M. S. Prevot and K. Sivula, J. Phys. Chem. Lett., 2014, 5, 3902 CrossRef CAS PubMed.
- Y. Chen, C. H. Chuang, K. C. Lin, S. Shen, C. McCleese, L. Guo and C. Burda, J. Phys. Chem. C, 2014, 118, 11954 CAS.
- Y. Chen, X. Feng, M. Liu, J. Su and S. Shen, Nanophotonics DOI:10.1515/nanoph-2016-0027.
- F. Jiang, Gunawan, T. Harada, Y. B. Kuang, T. Minegishi, K. Domen and S. Ikeda, J. Am. Chem. Soc., 2015, 137, 13691 CrossRef CAS PubMed.
- J. Zhao, T. Minegishi, L. Zhang, M. Zhong, M. Nakabayashi, G. Ma, T. Hisatomi, M. Katayama, S. Ikeda and N. Shibata, Angew. Chem., Int. Ed., 2014, 53, 11808 CrossRef CAS PubMed.
- A. Walsh, S. Chen, S. H. Wei and X. G. Gong, Adv. Energy Mater., 2012, 2, 400 CrossRef CAS.
- Z. Qin, Y. Chen, X. Wang, X. Guo and L. Guo, ACS Appl. Mater. Interfaces, 2016, 8, 1264 CAS.
- D. Jing and L. Guo, J. Phys. Chem. B, 2006, 110, 11139 CrossRef CAS PubMed.
- G. Wang, Y. Ling, D. A. Wheeler, K. E. George, K. Horsley, C. Heske, J. Z. Zhang and Y. Li, Nano Lett., 2011, 11, 3503 CrossRef CAS PubMed.
- J. Li, F. Meng, S. Suri, W. Ding, F. Huang and N. Wu, Chem. Commun., 2012, 48, 8213 RSC.
- D. Berlincourt, H. Jaffe and L. R. Shiozawa, Phys. Rev., 1963, 129, 1009 CrossRef CAS.
- C. Persson, J. Appl. Phys., 2010, 107, 3710 CrossRef.
- S. K. Saha, A. Guchhait and A. J. Pal, Phys. Chem. Chem. Phys., 2012, 14, 8090 RSC.
- M. Moriya, T. Minegishi, H. Kumagai, M. Katayama, J. Kubota and K. Domen, J. Am. Chem. Soc., 2013, 135, 3733 CrossRef CAS PubMed.
- D. W. Hwang, J. Kim, T. J. Park and J. S. Lee, Catal. Lett., 2002, 80, 53 CrossRef CAS.
- E. Thimsen, A. B. F. Martinson, J. W. Elam and M. J. Pellin, J. Phys. Chem. C, 2012, 116, 16830 CAS.
- S. R. Morrison, Electrochemistry of Semiconductor and Oxidized Metal Electrodes, Plenum Press, New York, 1980 Search PubMed.
- M. G. Ahmed, T. A. Kandiel, A. Y. Ahmed, I. Kretschmer, F. Rashwan and D. Bahnemann, J. Phys. Chem. C, 2015, 119, 5864 CAS.
- H. Lu, L. Xu, B. Wei, M. Zhang, H. Gao and W. Sun, Appl. Surf. Sci., 2014, 303, 360 CrossRef CAS.
- U. Dasgupta, S. K. Saha and A. J. Pal, Sol. Energy Mater. Sol. Cells, 2014, 124, 79 CrossRef CAS.
- D. A. Neamen, Semiconductor Physics and Devices, McGraw-Hill, New York, 3rd edn, 2003 Search PubMed.
- T. Zhang, J. Su and L. Guo, CrystEngComm, 2016, 18, 665 RSC.
- W. Septina, S. Ikeda, T. Harada, M. Higashi, R. Abe and M. Matsumura, J. Phys. Chem. C, 2015, 119, 8576 CAS.
Footnote |
| † Electronic supplementary information (ESI) available: The intensity of the monochromatic light; the elemental compositions of CTZS and CdS samples; TEM and HRTEM images of CTZS nanocrystals; plots of (αhν)2 vs. photon energy (hν) for CTZS and CdS films. See DOI: 10.1039/c6ra07841a |
| This journal is © The Royal Society of Chemistry 2016 |

