Anna Amat*ab,
Costanza Milianib and
Simona Fantacci*ab
aComputational Laboratory for Hybrid/Organic Photovoltaics (CLHYO), CNR-ISTM, via Elce di Sotto 8, 06123 Perugia, Italy. E-mail: simona@thch.unipg.it
bCNR-ISTM, via Elce di Sotto 8, 06123 Perugia, Italy
First published on 31st March 2016
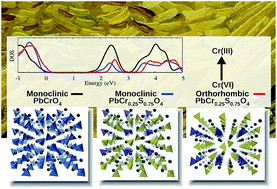
Chrome Yellows (CY) are a family of synthetic pigments of the formula PbCr(1−x)SxO4, used by van Gogh and other nineteenth-century masters, whose photo-degradation threatens the conservation of invaluable works of art. Experimental studies have demonstrated that the darkening of the pigment is provoked by the formation of superficial layers of Cr(III) oxides and sulfates due to the reduction of the native Cr(VI) to the Cr(III) oxidation state. A strong correlation between CY degradation and its chemical composition (sulfate richness) and structure (orthorhombic vs. monoclinic) was also experimentally put forward. Here we investigate a possible sulfate pathway to CY degradation, and investigate PbCr(1−x)SxO4 (x = 0, 0.25, 0.5, 0.75, 1) compounds in both orthorhombic and monoclinic phases by first principles DFT calculations. Our results show that the mixed PbCr(1−x)SxO4 and the native PbCrO4 share a similar electronic structure, though an energy up-shift of the conduction band is computed by both increasing the amount of sulfate and passing from the monoclinic to the orthorhombic phase. Our calculations suggests that, under a purely electronic picture, the Cr(VI) photo-reduction is more difficult for compounds with high sulfur concentration and an orthorhombic phase. Therefore, we conclude that degradation should be ascribed to other factors, such as different solubility and morphology.
A number of paintings where CY were employed, comprising some iconic works by Van Gogh, have shown with time a perceptible darkening of colour which raises serious concerns for their conservation. The penchant for degradation of chromate-based pigments has been extensively investigated in the last few years by employing synchrotron radiation (SR)-based X-ray microprobe techniques as well as electronic and vibrational spectroscopies on both original paint micro-samples and artificially aged paint models.11–21 It has been found that the pigment darkening is likely due to the formation of a superficial micrometric layer made of amorphous Cr(III) oxides (Cr2O3) along with Cr(III) sulphates and/or organo-metallic Cr(III) compounds; the alteration process has been accordingly ascribed to reduction of the native Cr(VI) to the Cr(III) oxidation state.
Both environmental (light, temperature, humidity) and intrinsic (composition of the CY solid solution, paint additives, organic binding media) aspects have been evaluated as potential triggering factors of the formation of superficial Cr(III)-compounds.11,14–16,19,21 It has been proved that the reduction process is mainly photo-activated (by both UV and visible light), although a role can be played also by Cr(V) intermediate compounds thermally formed by interaction of CY with the binding medium (typically a drying oil).19,21 Behind these environmental factors it has emerged, however, that the primary role is ascribable to the chemical composition and structure of PbCr(1−x)SxO4 solid solutions. As a matter of fact, orthorhombic sulphate-rich CY are much more prone to photochemical reduction than the sulphate-poor analogues having a monoclinic crystal phase.14,19
To shed some light on the nature of the material structure/properties relationship and to analyze how the electronic structure of CY is affected by compositional and structural changes, here we investigate the CY pigment and its sulphate-substitution products by first principles electronic structure computational analyses. Theoretical modeling can provide accurate information at the microscopic level of colouring materials used in paintings22–30 and in different applications.31–38 In this study, we have taken into account well defined models and have investigated the interplay between structural and electronic properties as a function of the composition and the crystalline phase. The pure PbCrO4 and PbSO4 reference structures have been investigated by employing Density Functional Theory (DFT) calculations, including both scalar relativistic (SR) and spin–orbit coupling (SOC) effects. After having tested different levels of theory on the reference lead chromate and sulphate compounds, we have focused on the intermediate binary structures PbCr(1−x)SxO4 with x = 0.25, 0.50 and 0.75, in both monoclinic (m-PbCr(1−x)SxO4) and orthorhombic (o-PbCr(1−x)SxO4) phases. These theoretical models can be related to the CY laboratory synthesized samples, with increasing amount of sulphate and proved to have different grades of light fastness.14 Our study shows that due to the peculiar electronic structure of PbCrO4 and of the related PbCr(1−x)SxO4, the Cr(IV) to Cr(III) reduction process becomes less energetically favored for sulphate-rich species or within the orthorhombic phase, thus suggesting that the role of sulphate in the degradation is possibly limited to factors different from pure electronic ones, such as its different solubility and morphology (i.e. smaller particle size).
We optimized the structure of PbCrO4 using as reference the available experimental data. At room temperature PbCrO4 assumes a P121n1 monoclinic phase (m-PbCrO4)42 while at high temperatures an orthorhombic (Pnma) structure (o-PbCrO4) has been reported43 very similar to that of PbSO4 (o-PbSO4), which is found in an anglesite structure with an orthorhombic conformation (Pbnm), see Scheme 1.44 Since a similar change of phase, from the monoclinic to the orthorhombic, has been observed for the mixed systems upon increase the sulfur concentration, the electronic properties of the o-PbCrO4 and o-PbSO4 have also been investigated and compared to that of m-PbCrO4.
The investigated cells of PbCrO4 and PbSO4 contain a total of 24 atoms: 4Pb, 4Cr/S and 16O. The cell of m-PbCrO4 has an angle β of 102.42° while the α and γ angles are equal to 90°. The a and b cell parameters are measured 7.12 and 7.34 Å, respectively, while c is 6.79 Å, being the total volume of the cell 350.80 Å3. The orthorhombic phase of this species, o-PbCrO4, is slightly larger, 367.00 Å3 is the cell volume and a, b and parameters measure 8.80, 5.73 and 7.27 Å, respectively. o-PbSO4 is very similar to the analogous chromate, showing smaller a, b and c parameters 6.96, 8.48 and 5.40 Å, respectively, accounting for a total volume of 318.49 Å3.
Geometry optimization of these structures has been performed both by leaving the cell parameters fixed at the experimental values and optimizing the ions (experimental cell), and by allowing both the cell and the ions to relax (optimized cell). Calculations have been performed using a SR-DFT approach and a full relativistic one, including SOC effects. To investigate how the changes in the chemical composition and crystalline phase are reflected on the electronic structure of CY, we have taken into consideration mixed Cr and S materials (i.e. PbCr(1−x)SxO4) which have also experimentally studied.14,18,19,21 We investigated mixed structures with composition range x = 0, 0.25, 0.5, 0.75, 1; for the x = 0.5 substitutions we have taken into account the three possible distributions of the CrO42− and SO42− octahedra in the crystal, see discussion below. The compounds have been modeled by subsequently replacing the chrome by sulfur atoms in the m-PbCrO4 structure and re-optimizing both cell and ions for the monoclinic phase, and making the reverse process (substitution of sulphate by chromate) starting from o-PbSO4 for the orthorhombic phase.
The SOC-DFT band structures calculated on the optimized geometries employing experimental cell parameters are reported in Fig. 2, see ESI† for the corresponding SR-DFT data. A summary of indirect and lowest direct band gaps are reported in Table 1.
![]() | ||
Fig. 2 SOC-DFT band structures of m-PbCrO4, o-PbCrO4 and o-PbSO4 employing the experimental cell parameters. The zero has been set in both cases at the top of the valence band. |
m-PbCrO4 | o-PbCrO4 | o-PbSO4 | |||||
---|---|---|---|---|---|---|---|
Exp. cell | Opt. cell | Exp. cell | Opt. cell | Exp. cell | Opt. cell | ||
SR | Dir. | 1.81 (A–B) | 1.79 (A–B) | 1.96 (Γ) | 1.53 (Γ) | 4.29 (U) | 4.29 (Γ–Z) |
1.82 (A) | 1.81 (A) | 4.55 (Γ–Z) | 4.56 (U) | ||||
Ind. | 1.73 | 1.71 | 1.96 | 1.52 | |||
SOC | Dir. | 1.74 (A–B) | 1.71 (A–B) | 1.86 (Γ) | 1.45 (Γ) | 3.81 (U) | 3.81 (Γ–Z) |
1.75 (A) | 1.72 (A) | 3.82 (Γ–Z) | 3.82 (U) | ||||
Ind. | 1.65 | 1.63 | 1.85 | 1.44 | 3.59 | 3.59 |
An indirect band gap of 1.73 and 1.65 eV is computed for m-PbCrO4 using SR- and SOC-DFT, respectively. SOC thus induces a small (0.08 eV) decrease in the computed band gap suggesting a moderate involvement of the lead atoms in the band edges. On overall, the results are quite underestimated with respect to the experimental ones reported at ca. 2.3 eV (ref. 47) as expected for standard GGA-DFT calculations.48–50 The top of the valence band is computed between A and B while the bottom of the conduction band is computed at A, the direct band gap in A lays ca. 0.10 eV above the indirect one. The presence of a direct band gap close to the indirect band gap is in line with the previous computational analyses by Errandonea et al.47,51 who found m-PbCrO4 to be an indirect band gap semiconductor, with the direct band gap easily accessible. As it can be noticed from Table 1, the differences between the band gaps computed using the experimental cells or the optimized ones are negligible.
The band gap of o-PbCrO4 is computed to be 1.96 and 1.86 eV by SR- and SOC-DFT, respectively. Here the band gap can be considered as being direct at the Γ point of the Brillouin zone, almost degenerate with the computed indirect ones. Upon cell relaxation, the orthorhombic phase slightly deviates from orthogonality and while the b axis remains unchanged, the a and c axis are reduced and increased by 8% and 6%, respectively, resulting in a total reduction of the volume of ca. 4%. Structural changes lead to a dramatic drop of the band gap by as much as 0.4 eV, bringing it below that of the monoclinic phase. These variations are not surprising when considering that o-PbCrO4 has been only reported at high temperatures and is not stable at standard conditions. The band gap of the relaxed cell structure is still computed at Γ and the structure of the band is very similar to that computed for the experimental cell, with a very flat region of the valence band and a clear minimum of the conduction band at Γ.
The indirect band gap of o-PbSO4 is computed 4.05 and 3.59 eV by SR- and SOC-DFT, respectively, and lays ca. 0.2 eV below the lowest direct band gap computed at U. The bottom of the conduction band is computed at U while the top of the valence band is computed between Γ and Z. In o-PbSO4 SOC lowers the band gap by ca. 0.5 eV, a stronger effect than what found for PbCrO4 due to the larger Pb character of the conduction band with respect to the lead chromates, as discussed below. The SOC-DFT band gap is overestimated by ca. 0.4 eV with respect to the experimental one, reported at ca. 3.2 eV.52 While the origin of such overestimate is presently not clear, we notice that a comparable discrepancy was found for similar oxides.47,51
The density of states (DOS) of the investigated pure phases is reported in Fig. 3. The valence band has a similar composition for the three compounds and is mainly due to the oxygen orbitals, with a minor involvement of the Pb s orbitals, a contribution which decreases passing from m-PbCrO4 to o-PbCrO4 and o-PbSO4. The valence band of o-PbCrO4 phase is up-shifted by ca. 0.25 eV with respect to the monoclinic phase (alignment done considering the Pb 5d states), it is shown as a more structured band with a higher energy low intensity peak. This up-shift in the o-PbCrO4 valence band is responsible for the decrease of the band gap discussed previously and it is due to the structural reorganization and the decrease of the cell volume. This is confirmed by looking at the valence band structure of o-PbCrO4 using the experimental cell parameters, which does not show a band gap lowering, see ESI.†
The conduction band of PbCrO4, in both crystalline phases shows mainly contributions from Cr d orbitals and O p orbitals and a low but meaningful amount of Pb p states. In o-PbSO4, the conduction band is essentially delocalized on the Pb and O centers and is up-shifted by ca. 2 eV with respect to PbCrO4. This change reflects in an opening of the band gap as experimentally found to go from 2.3 eV for m-PbCrO4 to 3.2 eV for o-PbSO4. The larger involvement of lead atoms in the conduction band of o-PbSO4 than in PbCrO4 accounts for the larger SOC effects computed for the sulphate with respect to the chromate analogue, as discussed above. A conduction band character similar to that of o-PbSO4 has been also observed for PbMoO4 and PbWO4, tetragonal oxides, both showing a larger computed band gap than PbCrO4, 3.3 and 3.9 eV, respectively.53
The electronic structure of PbCrO4 presents a few peculiarities with respect to the previous cited metal oxides. The CrO42− ion shows a weaker crystal field splitting compared to the MoO42− and WO42− tetrahedral anions. The antibonding combination of the Cr d orbitals and oxygen lone-pairs lies at lower energies with respect to the unoccupied localized Pb states, thus becoming the final states of charge transfer excitations. In addition, the Pb contribution to the conduction band of PbCrO4 seems to have implications on the CY pigment colour. This contribution is obviously absent in SrCrO4, an oxide in the monazite crystal structure, which, even presenting similar contributions of Cr and O in the valence and conduction bands, has a larger band gap with respect to the analogue Pb ternary oxide.51,53 The Pb presence in the conduction band is due to hybridization of deep occupied Pb and O states; and the antibonding Pb–O component shifts to lower energies the conduction band, mainly of Cr–O character, making it more accessible and easier to be (photo) reduced. In the case of sulphate, the Pb character of the conduction band changes completely the nature of charge-transfer transitions and the chemical–physical properties of this compound.
m-PbCr(1−x)SxO4 | o-PbCr(1−x)SxO4 | |||||||||
---|---|---|---|---|---|---|---|---|---|---|
x = 0 | x = 0.25 | x = 0.5 | x = 0.75 | x = 1 | x = 0 | x = 0.25 | x = 0.5 | x = 0.75 | x = 1 | |
Volume (Å3) | 2351 | 2319 | 2293 | 2261 | 2232 | 2354 | 2280 | 2221 | 2181 | 2141 |
A (Å) | 7.107 | 7.097 | 7.066 | 7.034 | 7.000 | 7.633 | 7.414 | 7.178 | 7.188 | 7.124 |
B (Å) | 7.427 | 7.376 | 7.344 | 7.297 | 7.259 | 8.391 | 8.503 | 8.691 | 8.622 | 8.632 |
C (Å) | 6.762 | 6.726 | 6.715 | 6.692 | 6.669 | 5.835 | 5.741 | 5.653 | 5.587 | 5.530 |
A (°) | 89.9 | 89.8 | 90.0 | 90.0 | 90.0 | 90.0 | 90.0 | 90.0 | 89.7 | 90.0 |
B (°) | 102.5 | 102.6 | 102.8 | 102.7 | 102.6 | 90.0 | 90.0 | 90.0 | 90.0 | 90.0 |
Γ (°) | 90.1 | 90.4 | 90.0 | 89.9 | 90.1 | 90.0 | 90.0 | 90.0 | 90.0 | 90.0 |
VB (eV) | 0.00 | −0.10 | −0.11 | −0.12 | −0.10 | 0.21 | 0.19 | 0.08 | 0.13 | 0.10 |
CB (eV) | 1.63 | 1.74 | 1.84 | 1.97 | 3.75 | 1.71 | 1.99 | 2.22 | 2.34 | 3.69 |
Egap (eV) | 1.63 | 1.84 | 1.95 | 2.09 | 3.85 | 1.50 | 1.80 | 2.14 | 2.21 | 3.59 |
Upon increasing the amount of sulfur a reduction of the cell volume is predicted, nicely matching the experimental observations;54,55 the volume contraction is 5% for the monoclinic phase, while for the orthorhombic phase the volume contracts by 9%. To get insight into the possible changes of the structural parameters which accompany the substitution of chromate with sulfate, the PbO, CrO and SO distances of the polyhedrons have been analyzed but no relevant effects have been noticed, ESI.†
The band gap is strongly influenced by the presence of sulfur. For the monoclinic phase the band gap increases by 0.21 eV (x = 0.25), 0.35 eV (x = 0.50) and 0.46 eV (x = 0.75) with respect to PbCrO4, while the band gap of the orthorhombic phase markedly increases by 0.30, 0.64 and 0.71 eV for x = 0.25, 0.50 and 0.75, respectively, see Table 2. Despite the known flaws of PBE in computing absolute band gap energies, we are confident that the methodology is accurate enough to qualitatively, at most, reproduce the band gap evolution as a function of sulphate richness. For pure m-PbSO4 (o-PbSO4) the band gap is computed to be 2.22 eV (2.09 eV) larger than that of m-PbCrO4 (o-PbCrO4) due to a completely different conduction band composition, in line with that discussed above for the pure phases. For the mixed monoclinic structures, the valence band is stabilized by 0.10 eV with respect to the pure m-PbCrO4, while the conduction band is progressively up-shifted by increasing the sulfur amount, see Table 2, being both shifts responsible of the band gap opening. The same trend is found for the orthorhombic species.
Except for the conduction band of PbSO4, the valence and conduction bands of the orthorhombic structures are up-shifted with respect to their monoclinic counterparts. For the valence band we computed shifts in between 0.2 and 0.3 eV, while the variations of the conduction band is far more pronounced, see Table 2. It can be noticed that the conduction band of the reference pure species are very similar in both crystalline phases, with computed differences below 0.1 eV, while for x = 0.25, 0.50 and 0.75 we compute an up-shift of 0.25, 0.38 and 0.37 eV, respectively, of the conduction band going from monoclinic to orthorhombic phase, see Table 2. These changes deliver band gaps in the orthorhombic phase that are lower for x = 0 (−0.13 eV) and x = 1 (−0.26 eV) compared to their monoclinic counterparts, while they are almost unchanged for x = 0.25 and larger for x = 0.5 and x = 0.75, see ESI.†
The total and projected DOS of the investigated oxides are reported in Fig. 5. Since the oxygen atoms of chromate and sulfate are not electronically equivalent, we have analyzed separately those belonging to the CrO42− tetrahedra, hereafter OCr, from those coming from SO42−, hereafter OS. On overall, for the mixed m-PbCr(1−x)SxO4 species the valence band is mainly composed of p orbitals of both OCr and OS in different ratios depending on the composition, with a small contribution from Pb s orbitals.
The composition of the conduction band of the mixed species is quite stable with the progressive substitution of chromium by sulfur and show almost exclusively contributions from the OCr p and the Cr d states with a minor participation of the Pb p orbitals, analogously to that found for the reference m-PbCrO4. For the m-PbCr(1−x)SxO4 species, we therefore find, up to a minimal Cr concentration (0.25), a conduction band up-shifted with respect to pure m-PbCrO4 due to the reduced density of the contributing Cr states. In m-PbSO4 the composition of the conduction band completely differs from that containing chromium being mainly due to the Pb p orbitals, as discussed above for the orthorhombic phase, o-PbSO4.
To analyze in details the partial DOS (PDOS) of the mixed species, the areas of the PDOS with respect to the total DOS in defined regions of energy have been integrated (see the integration limits in ESI†) and expressed in percentages with reference to the total areas of the accounted band. For the monoclinic phase, in the region of the valence band in between ca. −1.2 and 0.4 eV PDOS of OS contribute for 0%, 6%, 49%, 72% and 93% to the total DOS going from x = 0 to x = 1 while the PDOS of OCr contribute for 89%, 84%, 42%, 19% and 0, showing a good correlation with the CrO42− amount in the crystalline cell. The contribution of Pb 6s orbitals in this energy region is constant at ∼5%. In the conduction band region between ca. 1.5 and 3 eV, for all the species containing CrO42−, the PDOS of Cr is constant contributing 51–52%, independently from the amount of CrO42−, also the PDOS of OCr consistently contribute to the conduction band (36–31%) while the Pb d orbitals contribute for 8%. This Pb contribution is originated from the antibonding counterpart of the Pb–OCr mixing induced by Cr, as discussed for m-PbCrO4, and is therefore not present for PbSO4. Indeed, for the PDOS of m-PbSO4 only a single band at ca. 10.2 eV is observed, 93% OS p and 7% Pb, whose character is similar to that of the orthorhombic phase.
For the o-PbCr(1−x)SxO4 systems, the highest-energy peak in the valence band, characteristic of the total DOS o-PbCrO4 structure is maintained, even though smoothed, only for the species with x = 0.25. The valence band character is essentially oxygen and in the intermediate mixed species the composition in terms of OCr/OS reflects the ratio of chromate/sulfate of the considered system. For the o-PbCr(1−x)SxO4 species (x = 0.00–0.75), we evaluated the contribution of the Cr, O and Pb by integrating the conduction band areas of the PDOS, with integration limits 1.5–3.0 eV. The Cr states constantly contribute for ∼51% to the conduction band of all the oxides, 37–35% is the contribution of OCr, and 9–10% is that of Pb. It is interesting to notice that independently to the presence of S or Cr, the character of the conduction band of the mixed o-PbCr(1−x)SxO4 species (x = 0.0–0.75) is the same, analogously to that of the monoclinic phase; we observe only a decrease in the density of the Cr and OCr states.
The composition of the orthorhombic valence and conduction bands is very similar to that retrieved for the monoclinic structure, the up-shift of the conduction band is essentially related to the lower number of Cr and OCr states contributing to the conduction band and this decrease is probably related to the lightening of the CY pigment by increasing the amount of sulfate.14 Incidentally, SR-DFT calculations provide a qualitatively similar electronic properties as calculated including spin–orbit coupling, see ESI.†
On overall, our calculations do not show any peculiar electronic features between monoclinic and orthorhombic series which could explain the different inclination to degradation. We therefore believe that other reasons, probably related to the morphology of the materials, make the orthorhombic phase, with an amount of SO42− larger than x = 0.4, more prone to photo-induced blackening.
Both the introduction of sulfur and the change of phase induce an up-shift of the conduction band. Taking the top of the conduction band as an estimate of the material reduction potential, our data suggest that (photo) reduction becomes more difficult for the species with high sulfur concentration or with an orthorhombic phase. On overall, we can conclude that in a purely electronic picture, PbCrO4 is more prone to light induced reduction than the sulfate analogues. A possible explanation of the higher light sensitivity of sulfate-rich CYs (x > 0.4) pigments may then lay in an higher tendency to release CrO42− anions into the paint matrix which could be the actual responsible of the photoredox process experimentally observed. Thus, other properties of the PbCr(1−x)SxO4 system will be modeled such as the effect of sulfate substitution on both thermodynamic and kinetic solubility of the pigment into the organic binding medium. We hope that our study, providing a quantitative description of the electronic structure of the pigment models, being able to follow how the electronic properties respond to compositional and structural modifications, may complement the analytical and spectroscopic data and provide an alternative perspective in the pigments analysis.
Footnote |
† Electronic supplementary information (ESI) available: Cell parameters for the experimental and optimized cells. Relative stabilities of the m–o-PbCr0.5S0.5O4 compounds. Band structure and DOS of the limit structures at the experimental cells. Composition of the first peaks of the valence and conduction bands for all the studied species. Valence, conduction band and band gap energies vs. composition for the monoclinic and orthorhombic mixed structures. Main geometrical parameters for all the mixed structures. See DOI: 10.1039/c6ra01444e |
This journal is © The Royal Society of Chemistry 2016 |