 Open Access Article
Enhanced Zn2+ ion-sensing behavior of a benzothiazole derivative on encapsulation by β-cyclodextrin†
Rajathi Queen
Paulpandi
a,
Sivaraj
Ramasamy
a,
Mosae Selvakumar
Paulraj
a,
F. Guillermo
Díaz Baños
c,
G.
Villora
d,
José P.
Cerón-Carrasco
e,
Horacio
Pérez-Sánchez
*e and
Israel V.
Muthu Vijayan Enoch
*ab
aDepartment of Chemistry, Karunya University, Coimbatore 641114, Tamil Nadu, India. E-mail: drisraelenoch@gmail.com
bDepartment of Nanosciences & Technology, Karunya University, Coimbatore 641114, Tamil Nadu, India
cDepartment of Physical Chemistry, University of Murcia, Campus of Espinardo, E-30071, Murcia, Spain
dDepartment of Chemical Engineering, Faculty of Chemistry, Regional Campus of International Excellence “Campus Mare Nostrum”, University of Murcia, Campus of Espinardo, E-30071, Murcia, Spain
eBioinformatics and High Performance Computing Research Group, Universidad Católica San Antonio de Murcia (UCAM), Spain. E-mail: hperez@ucam.edu
First published on 8th February 2016
Abstract
We report, in this paper, a benzothiazole derivative which shows selective binding of zinc ions among a pool of metal ions and the enhanced selectivity of the same metal ion by the derivative in its β-cyclodextrin bound form. The Zn2+ ion binding is studied using UV-visible absorption and fluorescence spectroscopy. The stoichiometry and binding mode of the benzothiazole derivative-β-cyclodextrin complex are determined using 1D and 2D NMR spectroscopic analysis. The cyclodextrin molecule slides over the benzothiazole derivative and resides above the aminomethyl group linking the benzothiazole and dihydroxyphenyl moieties. The site of binding of the Zn2+ ion with the compound remains the same both in the compound's free and cyclodextrin-complexed forms. Molecular modeling studies were also carried out in order to obtain more details about the cyclodextrin-compound and Zn2+-compound interactions, and their results are in close agreement with obtained experimental data.
Introduction
Mobile zinc is an essential factor in many biological processes such as brain function, physiological processes, such as Alzheimer's disease, epilepsy, stroke, and infantile diarrhea.1 Mobile Zn2+ ions are associated with biological processes including signaling and regulation,2 nucleation of protein self-assembly,3 and modification of cellular metabolism.4 Essential tasks of the central nervous system, prostate, and pancreas are performed by mobile zinc.5 Alterations to prostatic zinc trafficking are linked to the onset and progression of prostate cancer.6 Detection and quantification of mobile Zn2+ ion in solution therefore draws attention. Zinc is spectroscopically silent and various fluorescent chemosensors of Zn2+ at physiological pH have been reported.7The cyclic oligosaccharide, β-cyclodextrin, with its tapered-cone-like structure and a cavity able to accommodate guest molecules of appropriate size and shape, are known to alter the fluorescence emission of complexed guest molecules. Fluorescence enhancement is the most observed property on such host–guest complex formation,8 whereas quenching of fluorescence also is scarcely reported.9 Knowing the exact structure of the host–guest complex is of paramount importance in understanding the alteration of the physicochemical properties and the spectroscopic behavior of the guest molecules. Benzothiazoles are pharmacologically active molecules and their derivatives have been prepared using a wide range of methodologies.10 Although the literature is abundant with reports on the structure of β-cyclodextrin complexes, reports on relationship between the host–guest complex structure and the metal ion binding activity of the complexes are very scarce. In this paper, we report the structure of the β-CD complex of a benzothiazole derivative based on experimental and theoretical studies and the molecule's enhanced Zn2+ ion binding behavior in the β-CD-bound form.
Results and discussion
Compound 1–β-cyclodextrin complex
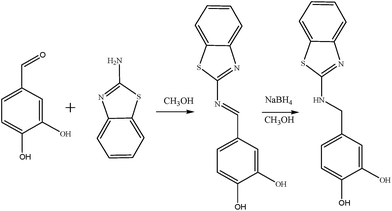
Compound 1 was formed on the reduction of the Schiff base formed from the reaction of 2-aminobenzothiazole and 3,4-dihydrozybenzaldehye [for the H1 and C13 NMR spectra of compound 1 see ESI 1(a) and (b)†]. We investigated the fluorescence properties of 1 in aqueous β-cyclodextrin medium. Keeping the concentration of 1 constant, β-CD solution was added in aliquots so that the concentration of β-CD increased stepwise up to 1 × 10⁻² mol dm−3. The structureless band of the absorption spectrum of 1 in aqueous solution was centered at 261 nm. This band corresponds to the n–π* transition of 1. Addition of β-CD lead to a continuous blue shift of absorption band, and at the final concentration level of β-CD, the absorption wavelength of the band envelope was 256 nm. The gradual blue shift at each addition of β-CD is a result of the change in the microenvironment of 1 as it dislodges from the polar water solvent cage to a non-polar surrounding. This occurs due to the entry of 1 into the hydrophobic cavity of β-CD. The second observation was that the absorption intensity got (or absorbance) continuous enhanced until the largest concentration (1 × 10⁻² mol dm−3) was reached (hyperchromic shift). This is a result of enhanced absorption of light, the free movement of electrons into various energy levels,11 and hence the enhanced transition probability of the delocalization of electrons in 1. The complex formation of 1 with β-CD was further followed using steady state fluorescence spectroscopy (exciting at the absorption wavelength maximum) of the same samples used for recording UV-visible spectra. The fluorescence band at 300 nm of 1 in aqueous solution got enhanced at the addition of β-CD (Fig. 1(a)).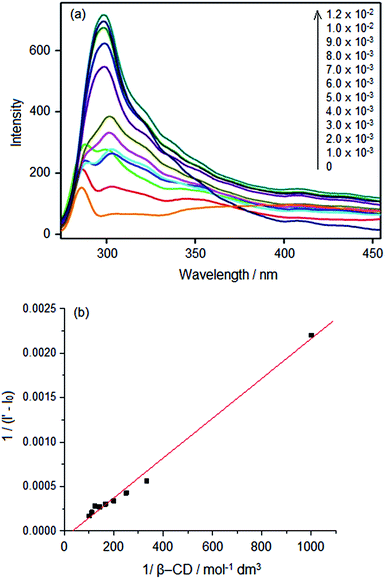 | ||
Fig. 1 (a) Fluorescence spectra of 1 at various added amounts of β-CD (b) Benesi–Hildebrand plot of the 1–β-CD 1![[thin space (1/6-em)]](https://www.rsc.org/images/entities/char_2009.gif) : :![[thin space (1/6-em)]](https://www.rsc.org/images/entities/char_2009.gif) 1 complex. 1 complex. | ||
This enhancement of fluorescence is more pronounced than absorption. Hence, we used the fluorescence spectral intensities for doing the Benesi–Hildebrand plot (Fig. 1(b)), which was employed to derive the stoichiometry and binding constant of 1–β-CD complex. The binding equilibrium is given by
| Host + guest ⇌ host–guest | (1) |
 | (2) |
![[thin space (1/6-em)]](https://www.rsc.org/images/entities/char_2009.gif) :
:![[thin space (1/6-em)]](https://www.rsc.org/images/entities/char_2009.gif) 1. The magnitude of the binding constant of a 1
1. The magnitude of the binding constant of a 1![[thin space (1/6-em)]](https://www.rsc.org/images/entities/char_2009.gif) :
:![[thin space (1/6-em)]](https://www.rsc.org/images/entities/char_2009.gif) 1 complex of a β-CD inclusion complex is usually a few hundreds, if the complex formed is a strong one.13 Hence, compound 1 should have formed a weaker bound host–guest complex.
1 complex of a β-CD inclusion complex is usually a few hundreds, if the complex formed is a strong one.13 Hence, compound 1 should have formed a weaker bound host–guest complex.
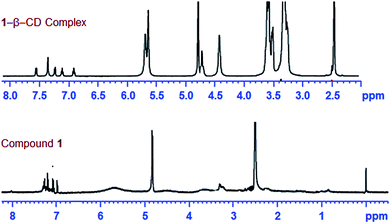
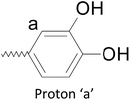
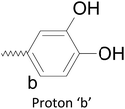
In order to comprehend the mode of encapsulation of 1 by β-CD, we analyzed the chemical shift of various protons of the 1–β-CD complex and free β-CD.11 The changes of proton NMR chemical shifts on complex formation are shown in Fig. 2 and the chemical shift values are given in Table 1.
Further evidence to the inference, that the β-CD covered up the –NH–CH2– units, was gained from an insight into the 2D rotating-frame overhauser effect spectrum (2D ROESY) of the 1–β-CD complex.
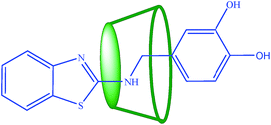
The partial ROESY spectrum (Fig. 3(a)) shows off-diagonal peaks, indicating the close prorumity of the H-5 and H-3 protons (ppm and ppm respectively) of β-CD and methylene protons of the –NH–CH2– bridging the benzothiazole and the dihydroxybenzene moieties (for the full 2D ROESY spectrum, see ESI 3†). The H-3, H-5 protons are lined in the inner rim of β-CD and hence the above observation means that the β-CD molecule slips over the aromatic rings of 1 to stand at the centre of the molecule, completely covering up the –NH–CH2– unit. Off-diagonal cross peaks were not obtained in the aromatic region of the spectrum and hence the encapsulation of the guest molecule at its edges are found unlikely. It further means that the two phenol –OH groups are not encapsulated by β-CD and are free for binding to metal ions, which is discussed in the next sections. The proposed structure of the 1–β-CD complex is represented in Scheme 1.
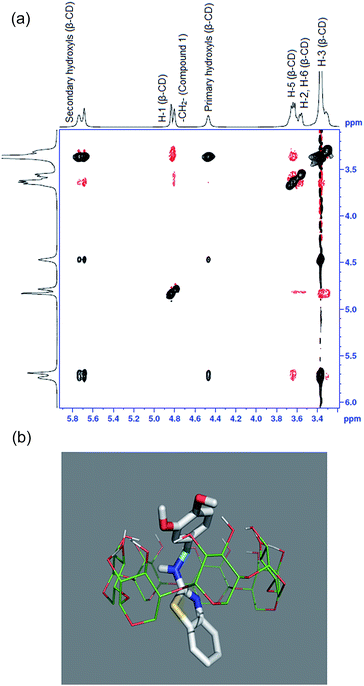 | ||
| Fig. 3 (a) Partial 2D ROESY spectrum of compound 1–β-CD complex. (b) Docking results obtained for the complexation of 1 with β-CD. | ||
In order to understand how 1 interacted with β-CD, docking simulations were carried out. Additionally, the structural information about the binding pose obtained by docking is shown in Fig. 3(b). We can see that 1 binds tightly into β-CD's internal cavity. These results are in agreement with 1H 2D-ROESY NMR data obtained. Also, it is clear that with this conformation, 1 binds tightly into β-CD's hydrophobic core.
Cation-binding property of compound 1
In order to investigate the application of 1 as a chemosensor, the metal ion binding characteristics were investigated towards metal cations which are relevant to biology and present in human body, viz., and the physiological pH (7.4) was maintained and the buffer used was HEPES. Although the absorption spectra of 1 in the presence of various added metal ions were not significantly different (ESI 4†), the fluorescence spectra (Fig. 4(a)) showed interesting result revealing the selectivity of 1. The changes of the fluorescence of 1 on metal ion addition were more pronounced than that of the absorption spectrum. The fluorescence spectrum showed a quenching behavior when each of the metal ion from the pool of different metals was added. However, at the addition of Pb2+ or Zn2+, the fluorescence of 1 got enhanced. In particular, addition of Zn2+ made the spectral band at 400 nm enhance in intensity by 2.5 times, which made the 1–Zn2+ spectrum stand out. The fluorescence spectrum of 1 showed two prominent bands, viz., 340 nm and 410 nm. The shorter wavelength band seemingly contributed by the dihydroxy benzene moiety of 1 is the one which shows enhancement, whereas the longer wavelength band remains unaltered. This implies that the phenolics –OH groups are involved in the metal ion binding. A comparison of the intensities of fluorescence is shown in Fig. 4(b).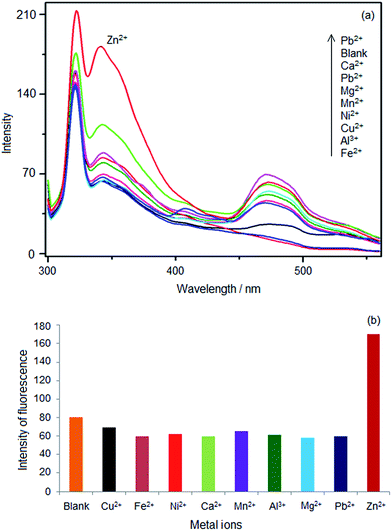 | ||
| Fig. 4 (a). Fluorescence spectra of 1 with various added metal ions in HEPES (b) fluorescence intensities of 1 with various added metal ions in HEPES. | ||
Fig. 5 illustrates the optimized DFT structures of 1–Zn2+ and 1–Ca2+ complexes as well as the free form of 1. As showed, the intramolecular hydrogen bonding established between both hydroxyl groups are disrupted when moving from the free form to the corresponding complexes. This is the logical consequence of the Zn2+ and Ca2+ coordination, which is governed by the interactions with the oxygen atoms and force the twist of one of the –OH groups. The performed simulations reveal such process is favored in the case of Zn2+, with an associated equilibrium constant of 647.63, significantly larger than the obtained for Ca2+, which is only 0.06. The optimized Zn2+–O (2.08 Å) and Ca2+–O (2.44 Å) distances match to the observed relative energy pattern: the shorter the ligand–cation bond, the stronger the interaction. That dissimilarity leads to a larger O–Zn2+–O bond angle compared to the obtained for O–Ca2+–O, 75.5° and 63.4°, respectively. Consequently, both Keq and geometries stand for the larger stability of 1–Zn2+ compared to its 1–Ca2+ counterpart since the ligand better accommodate the former cation in their structure. This finding hints the potential ability of DFT calculations to predict the relative stability order for 1-like complexes.
The stoichiometry of the 1–Zn2+ complex was obtained from the Job's plots made using the data obtained from the concentration dependent changes of the absorbance and the fluorescence intensity. The spectra are shown in ESI 5(a) and (b)† respectively. The Job's plots of the absorbance or the intensity of fluorescence at 360 nm vs. the molar fraction of 1, with a constant total concentration are shown in Fig. 6(a) and (b).
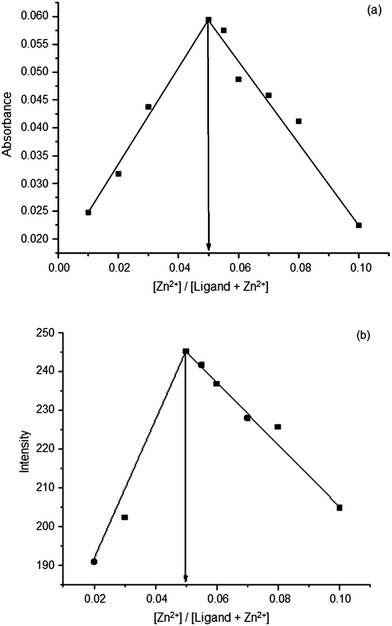 | ||
| Fig. 6 (a) Job's plot of the 1–Zn2+ complex formation, made using absorbance data (b) Job's plot of the 1–Zn2+ complex formation, made using fluorescence intensities. | ||
The maximum absorbance or the fluorescence intensity was found when the molar fraction was 1.0. This indicated that the 1–Zn2+ complex formed in a 1![[thin space (1/6-em)]](https://www.rsc.org/images/entities/char_2009.gif) :
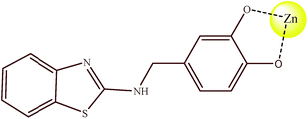
:![[thin space (1/6-em)]](https://www.rsc.org/images/entities/char_2009.gif) 1 fashion. Based on the above observation, the binding pattern of the 1–Zn2+ complex can be depicted as in Scheme 2.
1 fashion. Based on the above observation, the binding pattern of the 1–Zn2+ complex can be depicted as in Scheme 2.
Zn2+ binding by compound 1–β-CD complex
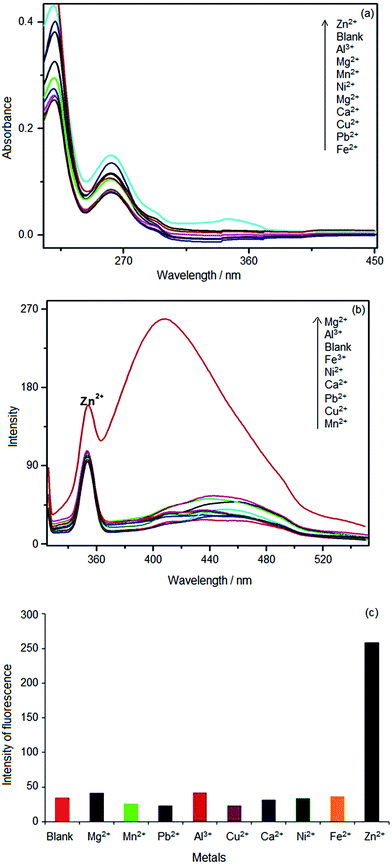
Metal ion binding experiments in a fashion, similar to the previous section, was done using 1–β-CD complex at the saturation concentration of β-CD. Zn2+ selectivity was observed similar to the one seen in aqueous medium. However, this time the fluorescence intensity of the Zn2+ ion-added 1–β-CD solution showed a four-fold enhancement. The absorption and fluorescence spectral titrations of 1 against various metal ions are shown in Fig. 7(a) and (b) respectively. Fig. 7(c) shows a comparison of the fluorescence intensities of various metal ion-added 1 in the presence of aqueous β-CD. The Job's plot made of the binding of Zn2+ to the 1–β-CD complex, using absorption and fluorescence spectral data, are shown in Fig. 8(a) and (b) respectively. The absorption and the fluorescence spectra of the binding titrations of Zn2+ against 1–β-CD complex in HEPES are shown in ESI 6(a) and (b).†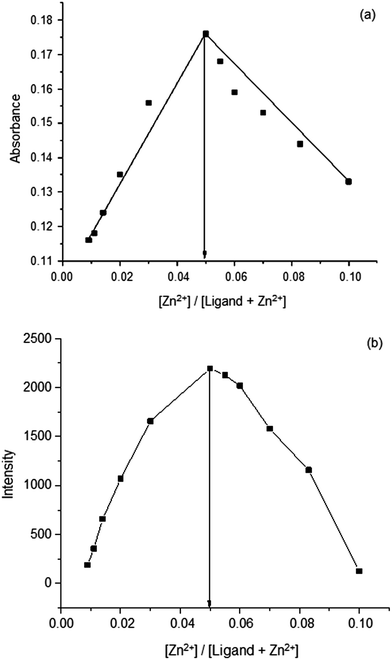 | ||
| Fig. 8 (a) Job's plot of the 1–Zn2+ complex formation, made using absorbance (b) Job's plot of the 1–Zn2+ complex formation, made using fluorescence intensities. | ||
The effect of pH on the fluorescence intensity of 1 at 420 nm is shown in ESI 7.† It shows the fluorescence intensity reaches saturation above pH 6 and the intensity is stable above this pH up to pH 8. Hence, the sensor is quite stable under the physiological pH.
The influence of other metal ions on the 1–Zn2+ binding was studied at 1 × 10⁻⁵ mol dm−3 concentration of the metal ions. The fluorescence got enhanced when Zn2+ was added in the presence of each of the other metal ions (Fig. 9(a)). This enhancement of fluorescence was similar to that occurred when Zn2+ ion alone was added. An experiment on the 1–β-CD complex – Zn2+ ion binding showed similar result, however, with an enhanced selectivity for Zn2+ by 1 in its β-CD complexed form (Fig. 9(b)). Hence, the β-CD encapsulation resulted in a better Zn2+ ion sensing. The log![[thin space (1/6-em)]](https://www.rsc.org/images/entities/char_2009.gif) K values of the 1–Zn2+ and 1–β-CD–Zn2+ binding were 8.9 ± 0.2 and 8.8 ± 0.2 respectively. This result suggests that the enhancement of fluorescence of 1 by β-CD encapsulation contributed to the enhanced sensing of Zn2+.
K values of the 1–Zn2+ and 1–β-CD–Zn2+ binding were 8.9 ± 0.2 and 8.8 ± 0.2 respectively. This result suggests that the enhancement of fluorescence of 1 by β-CD encapsulation contributed to the enhanced sensing of Zn2+.
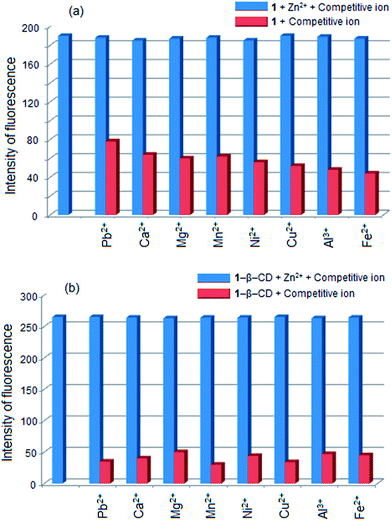 | ||
| Fig. 9 Competitive binding of Zn2+ to (a) 1 and (b) 1–β-CD complex in the presence of other metal ions. | ||
We carried out titrations of 1 (1 × 10⁻⁵ mol dm−3) against Zn2+, adding 0 to 110 equivalents of Zn2+ in water and aqueous β-CD media. Saturation point was reached at 110 equivalents of Zn2+. The plots of relative intensity versus the concentration of Zn2+ ion in low ranges in water and in β-CD are shown in Fig. 10(a) and (b) respectively. The detection limits of Zn2+ by 1 in water and in β-CD are 8.21 × 10⁻⁸ and 8.71 × 10⁻⁸ mol dm−3 respectively.
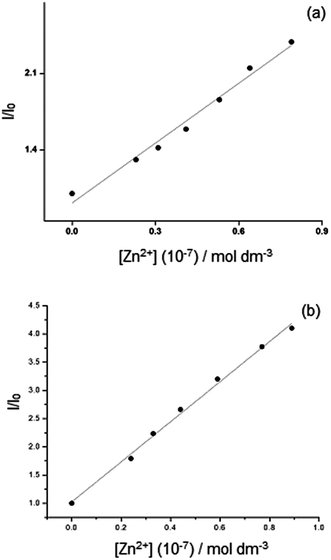 | ||
| Fig. 10 Relative fluorescence intensity of (a) 1 and (b) 1–β-CD complex as a function of the Zn2+ concentration (0 to 9 × 10⁻⁸ mol dm−3). | ||
Conclusions
A novel fluorescent sensor is designed and synthesized by coupling benzothiazole and dihydroxybenzene units. The compound exhibits high selectivity in the detection of Zn2+ over other biologically relevant metal ions with a turn-on fluorescence effect. Molecular modeling calculations explain this result due to the fact that distance Zn2+–O is the shortest one, and the shorter the ligand–cation bond, the stronger the interaction. The compound forms a 1![[thin space (1/6-em)]](https://www.rsc.org/images/entities/char_2009.gif) :
:![[thin space (1/6-em)]](https://www.rsc.org/images/entities/char_2009.gif) 1 host–guest complex with β-cyclodextrin. β-Cyclodextrin encapsulates the –NH–CH2– moiety of the compound, and this result is also predicted by the application of molecular modeling techniques. The host–guest complex selectively binds with Zn2+ similar to the free compound in solution with enhanced sensitivity and selectivity. It gives indirect evidence that the two phenolic groups are involved in the Zn2+ binding as the β-cyclodextrin molecule covers up the –NH–CH2– group of the benzothiazole moiety. Partial encapsulation by β-cyclodextrin can thus enhance the sensing of metal ions in solution provided the binding site of the chemosensor is not hidden from the possible binding of Zn2+ ions.
1 host–guest complex with β-cyclodextrin. β-Cyclodextrin encapsulates the –NH–CH2– moiety of the compound, and this result is also predicted by the application of molecular modeling techniques. The host–guest complex selectively binds with Zn2+ similar to the free compound in solution with enhanced sensitivity and selectivity. It gives indirect evidence that the two phenolic groups are involved in the Zn2+ binding as the β-cyclodextrin molecule covers up the –NH–CH2– group of the benzothiazole moiety. Partial encapsulation by β-cyclodextrin can thus enhance the sensing of metal ions in solution provided the binding site of the chemosensor is not hidden from the possible binding of Zn2+ ions.
The range of selectivity and the sensitivity shown by sensors towards metal ions and other analytes are varied.14 In the present study, although the benzothiazole derivative shows a lesser efficiency than few of the reported Zn2+ ion sensors,15 it is notable that β-CD enhances the efficiency of sensing. Similar study can be done on already existing chemosensors (applying fluorescence-based methods and showing high selectivity) by using CD complex formation.
Materials and methods
Reagents and instruments
2-Aminobenzothiazole, 3,4-dihydroxybenzaldehyde, and β-cyclodextrin were purchased from sigma Aldrich, Bangalore. The sulfates of lead, calcium, magnesium, manganese, nickel, copper, aluminium, iron and zinc were the product of Sigma Aldrich, Bangalore. Triply distilled water was used throughout and the buffer used was HEPES (PH 7.4). The UV-visible absorption spectra were measured on a Jasco V-630 spectrophotometer (Japan) using 1 cm path length quartz cuvettes. Absorption measurements were done keeping the corresponding reference solution without the fluorophore. Fluorescence spectra were recorded on a Jasco FP-8300 spectrofluorometer (Japan). The 1H and 13C NMR spectra were recorded on a Bruker 400 MHz (USA) spectrometer with the use of tetramethylsilane as the internal standard and dimethyl sulfoxide (DMSO) as the solvent.Synthesis of 4-[(1,3-benzothiazole-2-ylamino)methyl]benzene-1,2-diol (compound 1)
Compound 1 was prepared by treating a solution of 3,4-dihydroxybenzaldehyde (0.2 g, 0.001 mmol) in ethanol (10 ml) with the solution of 2-aminobenzothiazole (0.15 g, 0.001 mmol) in ethanol (10 ml) at 60 °C in the presence of NaOH. The mixture was stirred and refluxed for 6 hours to get a yellow coloured product (melting point, 123 °C). The product, 4-(1,3-benzothiazol-2-ylimino)methylbenzene-1,2-diol was reduced using NaBH4 to get final yellow coloured solid. The solid was collected by filtration and recrystallized from ethanol (melting point: 123 °C). The formation of products was followed using thin-layer chromatography (TLC) on glass plats coated with SiO2 GF254. The scheme of synthesis of compound 1 is depicted in Scheme 3.Preparation of test solution for UV-visible and fluorescence measurements
The UV-visible and fluorescence was recorded just after the addition of metal salts in ethanol solution, while keeping the ligand concentration constant (1 × 10⁻⁵ mol dm−3). The solution of metal ions were prepared from the sulfates salts of Zn2+, Fe2+, Al3+, Ca2+, Cu2+, Mg2+, Mn2+, Ni2+, and Pb2+. The blank solution was prepared just in HEPES buffer and without any added metal ion.Job's plot
The binding stoichiometry of sensor–metal complex was determined by the continuous variation method. From the stock solutions, various concentrations of Zn2+viz., 1 × 10⁻⁴, 8 × 10⁻⁶, 4 × 10⁻⁶, 6 × 10⁻⁵, 4 × 10⁻⁵, 2 × 10⁻⁶, 8 × 10⁻⁵, and 1 × 10⁻⁵ mol dm−3 were prepared and added to the solution of compound 1. Each test solution had a total volume of 10 ml. After mixing for a few seconds, the fluorescence spectra were taken at 25 °C.Molecular modeling
Aiming to better understand the experimental measures, additional theoretical calculations have been conducted for the 1–Zn2+ and 1–Ca2+ complexes, the systems that exhibit the highest and smallest peaks in the fluorescence spectra, respectively (see Fig. 7 in discussion section). More specifically, the structures of both complexes are fully optimized within the density functional theory (DFT) framework. The M06-L/Def2-SVPD level of theory has been selected as it produces meaningful predictions on the Zn coordination chemistry.16 Solvent effect are accounted for through the well-known polarizable continuum model (PCM)17 considering water as solvent. Vibrational frequencies are subsequently computed with the same theoretical approach to ensure that the optimized structures correspond to minima in the potential energy surface (i.e. non-imaginary frequencies) as well as to obtain the free energies corrections. The equilibrium constants are computed by using the usual eqn (3):| Keq = e−ΔG0/RT | (3) |
The molecular docking protocol we have previously developed19 for the study of the complexation processes between cyclodextrins and host molecules, was applied here for the investigation of the formation of the complex between β-cyclodextrin and 1. The molecular structure used for β-cyclodextrin was extracted from the crystal structure of Protein Data Bank (PDB) with code 3CGT. Molecular docking calculations were carried out using default parameters in AutoDock Vina.20 Graphical representations of the docking results were prepared using PyMOL (Molecular Graphics System, version 1.3, Schrödinger, LLC).
Acknowledgements
This work was partially supported by the Fundación Séneca del Centro de Coordinación de la Investigación de la Región de Murcia under Project 18946/JLI/13, 19499-PI-14 and by the Nils Coordinated Mobility under grant 012-ABEL-CM-2014A, in part financed by the European Regional Development Fund (ERDF). “Powered@NLHPC: this research was partially supported by the supercomputing infrastructure of the NLHPC (ECM-02)”. Also, this work was partially supported by the computing facilities of Extremadura Research Centre for Advanced Technologies (CETA-CIEMAT), funded by the European Regional Development Fund (ERDF). CETA-CIEMAT belongs to CIEMAT and the Government of Spain. The authors also thankfully acknowledge the computer resources and the technical support provided by the Plataforma Andaluza de Bioinformática of the University of Málaga. P. M. S. K. is thankful to the Science and Engineering Research Board (SERB), Department of Science and Technology, India, for the financial support (Project Number SB/FT/CS-068/2012).References
- A. I. Bush, W. H. Pettingell, G. Multhaup, M. Paradis, J.-P. Vonsattel, J. F. Gusella, K. Beyreuther, C. L. Masters and R. E. Tanzi, Science, 1994, 265, 1464–1467 CAS.
- M. D. Pluth, E. Tomat and S. J. Lippard, Annu. Rev. Biochem., 2011, 80, 333–335 CrossRef CAS PubMed.
- E. D. Gundelfinger, T. M. Boecheers, M. K. Baron and J. U. Bowie, Trends Biochem. Sci., 2006, 366–373 CrossRef CAS PubMed.
- L. C. Costello, R. B. Franklin and P. Feng, Mitochondrion, 2005, 5, 143–153 CrossRef CAS PubMed.
- S. L. Sensi, P. Paoletti, J. Y. Koh, E. Aizenman, A. Bush and M. Hershfinkel, J. Neurosci., 2011, 31, 16076–16085 CrossRef CAS PubMed.
- (a) S. K. Gosh, P. Kim, X. A. Zhang, S. H. Yun, A. Moore, S. J. Lippard and Z. Medarova, Cancer Res., 2010, 70, 6119–6127 CrossRef PubMed; (b) S. Tepaamorndech, L. Huang and C. P. Hirschke, Cancer Lett., 2011, 308, 33–42 CrossRef CAS PubMed; (c) V. Kolenko, E. Teper, A. Kutikov and R. Uzzo, Nat. Rev. Urol., 2013, 10, 219–226 CrossRef CAS PubMed.
- (a) E. L. Que, D. W. Domaille and C. J. Chang, Chem. Rev., 2008, 108, 1517–1549 CrossRef CAS PubMed; (b) P. Jiang and J. Guo, Coord. Chem. Rev., 2004, 248, 205–229 CrossRef CAS; (c) P. Carol, S. Sreejith and A. Ajayagosh, Chem.–Asian J., 2007, 2, 338–348 CrossRef CAS PubMed; (d) E. Kimura and S. Aoki, BioMetals, 2001, 14, 191–204 CrossRef CAS PubMed.
- (a) I. V. M. V. Enoch and S. Yousuf, J. Solution Chem., 2013, 42, 470–484 CrossRef CAS; (b) I. V. M. V. Enoch and M. Swaminathan, Collect. Czech. Chem. Commun., 2004, 69, 748–758 CrossRef.
- S. Chandrasekaran, Y. Sameena and I. V. M. V. Enoch, Aust. J. Chem., 2014, 67, 256–265 Search PubMed.
- (a) M. Singh, S. K. Singh, M. Gangwar, G. Nath and S. K. Singh, RSC Adv., 2014, 4, 19013–19023 RSC; (b) N. P. Prajapati, R. H. Vekariya, M. A. Borad and H. D. Patel, RSC Adv., 2014, 4, 60176–60208 RSC; (c) Q. Lei, L. Zhang, Y. Xia, T. Ye, F. Yang, Y. Zhu, X. Song, N. Wang, Y. Xu, X. Liu and L. Yu, RSC Adv., 2015, 5, 41341–41351 RSC.
- Y. Sameena, A. Ritty, P. M. Selvakumar, I. V. M. V. Enoch, P. S. Subramanian and Y. Sun, ChemistryOpen, 2015, 4, 497–508 CrossRef PubMed.
- H. A. Benesi and J. H. Hildebrand, J. Am. Chem. Soc., 1949, 71, 2703–2707 CrossRef CAS.
- (a) S. Chandrasekaran, Y. Sameena and I. V. M. V. Enoch, J. Mol. Recognit., 2014, 27, 640–652 CrossRef CAS PubMed; (b) Y. Sameena, N. Sudha, S. Chandrasekaran and I. V. M. V. Enoch, J. Biol. Phys., 2014, 40, 347–367 CrossRef CAS PubMed; (c) N. Sudha, S. Chandrasekaran, D. Premnath and I. V. M. V. Enoch, Bull. Korean Chem. Soc., 2014, 35, 2114–2122 CrossRef.
- (a) V. K. Gupta, B. Sethi, R. A. Sharma, S. Agarwal and A. Bharti, J. Mol. Liq., 2013, 177, 114–118 CrossRef CAS; (b) V. K. Gupta, A. K. Singh, M. Al Khayat and B. Gupta, Anal. Chim. Acta, 2007, 590, 81–90 CrossRef CAS PubMed; (c) A. K. Jain, V. K. Gupta, S. Radi, L. P. Singh and J. R. Raisoni, Electrochim. Acta, 2006, 51, 2547–2553 CrossRef CAS; (d) V. K. Gupta, A. K. Jain and P. Kumar, Sens. Actuators, B, 2006, 120, 259–265 CrossRef CAS; (e) V. K. Gupta, A. K. Jain, G. Maheshwari and H. Lang, Sens. Actuators, B, 2006, 117, 99–106 CrossRef CAS; (f) R. N. Goyal, V. K. Gupta and N. Bachheti, Anal. Chim. Acta, 2007, 597, 82–89 CrossRef CAS PubMed; (g) V. K. Gupta, S. Chandra and H. Lang, Talanta, 2005, 66, 575–580 CrossRef CAS PubMed; (h) R. Prasad, V. K. Gupta and A. Kumar, Anal. Chim. Acta, 2004, 508, 61–70 CrossRef CAS; (i) V. K. Gupta, R. Prasad and A. Kumar, Talanta, 2003, 60, 149–160 CrossRef CAS PubMed; (j) V. K. Gupta, S. Jain and S. Chandra, Anal. Chim. Acta, 2003, 486, 199–207 CrossRef CAS; (k) V. K. Gupta, S. Chandra and R. Mangla, Electrochim. Acta, 2002, 47, 1579–1586 CrossRef CAS; (l) V. K. Gupta, R. Mangla, U. Khurana and P. Kumar, Electroanalysis, 1999, 11, 573–576 CrossRef CAS; (m) V. K. Gupta, S. Jain and U. Khurana, Electroanalysis, 1997, 9, 478–480 CrossRef CAS.
- Z. Xu, J. Yoon and D. R. Spring, Chem. Soc. Rev., 2010, 39, 996–2006 Search PubMed.
- O. Trott and A. J. Olson, J. Comput. Chem., 2010, 31, 455–461 CAS.
- E. A. Amin and D. G. Truhlar, J. Chem. Theory Comput., 2008, 4, 75–85 CrossRef CAS PubMed.
- J. Tomasi, B. Mennucci and R. Cammi, Chem. Rev., 2005, 105, 2999–3093 CrossRef CAS PubMed.
- M. J. Frisch, G. W. Trucks, H. B. Schlegel, G. E. Scuseria, M. A. Robb, J. R. Cheeseman, G. Scalmani, V. Barone, B. Mennucci, G. A. Petersson, H. Nakatsuji, M. Caricato, X. Li, H. P. Hratchian, A. F. Izmaylov, J. Bloino, G. Zheng, J. L. Sonnenberg, M. Hada, M. Ehara, K. Toyota, R. Fukuda, J. Hasegawa, M. Ishida, T. Nakajima, Y. Honda, O. Kitao, H. Nakai, T. Vreven, J. A. Montgomery Jr, J. E. Peralta, F. Ogliaro, M. Bearpark, J. J. Heyd, E. Brothers, K. N. Kudin, V. N. Staroverov, R. Kobayashi, J. Normand, K. Raghavachari, A. Rendell, J. C. Burant, S. S. Iyengar, J. Tomasi, M. Cossi, N. Rega, J. M. Millam, M. Klene, J. E. Knox, J. B. Cross, V. Bakken, C. Adamo, J. Jaramillo, R. Gomperts, R. E. Stratmann, O. Yazyev, A. J. Austin, R. Cammi, C. Pomelli, J. W. Ochterski, R. L. Martin, K. Morokuma, V. G. Zakrzewski, G. A. Voth, P. Salvador, J. J. Dannenberg, S. Dapprich, A. D. Daniels, O. Farkas, J. B. Foresman, J. V. Ortiz, J. Cioslowski and D. J. Fox, Gaussian 09 Revision A.02, Gaussian Inc., Wallingford CT, 2009 Search PubMed.
- J. M. López-Nicolás, M. E. Camps, H. Pérez-Sánchez and F. García-Carmona, J. Agric. Food Chem., 2013, 61, 11347–11354 CrossRef PubMed.
Footnote |
| † Electronic supplementary information (ESI) available. See DOI: 10.1039/c6ra01202g |
| This journal is © The Royal Society of Chemistry 2016 |

