Band gap and Schottky barrier engineered photocatalyst with promising solar light activity for water remediation

V. Jabbaria, M. Hamadanian*bc, M. Shamshiric and D. Villagrána
aDepartment of Chemistry, The University of Texas at El Paso, El Paso, Texas 79968, USA. E-mail: vahid_jabbari.azeri@yahoo.com
bInstitute of Nanoscience and Nanotechnology, University of Kashan, P.O.Box 87317-51167, Kashan, Iran. E-mail: hamadani@kashanu.ac.ir; Fax: +98 31 55912397; Tel: +98 31 55912382
cDepartment of Physical Chemistry, Faculty of Chemistry, University of Kashan, Kashan, Iran

Received 14th November 2015 , Accepted 26th January 2016

First published on 28th January 2016


Abstract

A novel nanophotocatalyst of Mo- and S-doped TiO2 (Mo,S-codoped TiO2) was synthesized via a modified sol–gel method in conjunction with photochemical reduction. The XRD results showed that all of the prepared nanocatalysts only contain the anatase phase. The SEM and TEM analyses revealed that the doping of Mo and S does not cause any change in the morphology of the TiO2 catalyst. Chemical composition analysis carried out using EDX confirmed the successful doping of TiO2 by Mo and S, and DRS illustrated band gap reduction in TiO2 after doping. The photocatalytic performance of the samples was tested using the degradation of methyl orange (MO) as a model organic pollutant. The results showed that the photocatalytic activity of the Mo(0.06%), S(0.05%)-codoped TiO2 catalyst was higher than that of other catalysts under UV and visible light irradiation. Indeed, due to the synergetic effect of doping S and Mo, the Mo,S-codoped TiO2 catalyst has a higher photoactivity than the pure TiO2 and TiO2 doped solely with either Mo or S. Finally, it is proposed that the newly developed Mo,S-codoped TiO2 photocatalyst could be a great candidate for environmental applications such as air and water purification.

1. Introduction

Due to its resistance to photocorrosion, good physical and chemical stability, low cost, non-toxicity and strong oxidizing power, TiO2 is the most widely used photocatalyst in the photodegradation of organic pollutants for air and water purifications.1–5 However, TiO2 has a relatively large band gap (3.20 eV for anatase TiO2) which enables it to absorb only the UV portion of solar light (∼5%). Many techniques have been examined for the extension of the light absorption threshold of TiO2 to the visible light and near-IR region of solar light such as dye sensitization,6 transition metals doping,7 noble metal deposition,8 and anion doping.9,10

Lately, the doping of non-metal elements into TiO2 photocatalysts has become a hot research topic, which opens up a new possibility for the development of solar- or visible light-active photocatalytic materials. The doping of non-metal ions into TiO2 can shift its optical absorption edge from the UV to visible light range.11 This red shift in doped TiO2 was attributed to the charge-transfer transition between the d-orbital electrons of the dopant and the conduction band (CB) or valence band (VB) of TiO2.12 Regarding non-metal doping, Umebayashi et al.13–15 succeeded in synthesizing S-doped TiO2, which was used as an efficient visible-light-induced photocatalyst for the photocatalytic degradation of methylene blue. They found the substitution of lattice oxygen in TiO2 by a sulfur anion. Ohno et al.16–18 found that S atoms could be incorporated as cations and replace lattice Ti in TiO2. Zhao et al.19 and Majima and co-workers20 reported that the doping of TiO2 with sulfur can also reduce its band gap and shift its optical response to the visible-light region.

In order to further improve the photocatalytic activity, the codoping of TiO2 with binary non-metals,21–24 a metal and non-metal,25–28 a metal and metal29,30 and other semiconductors31 has been explored. In this respect, the codoping of TiO2 with a rare-earth transition metal and non-metallic element has aroused great interest.32,33 Several studies demonstrated that codoping with a transition metal and nonmetallic element could effectively modify the electronic structures of TiO2 and shift its absorption edge to lower energies.34,35

The codoping of TiO2 with transition metal and nonmetal elements has some positive aspects: narrowing the band gap and inhibition of charge recombination of the photo-generated electron–hole pairs. In a previous study, it was reported that the TiO2 absorption spectrum can be extended to the visible light region by incorporating Cr as a metal and S as a nonmetal into the TiO2 crystallite.36 The same results were reported for In- and S-codoped TiO2.37 Ag and S co-doped TiO2 degraded acetaldehyde ten times faster under visible light and 3 times faster under UV light illuminations compared to that of undoped TiO2.38 It was also reported that La and N codoped TiO2 nanoparticles showed a superior photocatalytic activity for the degradation of methyl orange under visible light irradiation compared to solely N-doped or La-doped TiO2.39

The aim of the current study, which to the best of our knowledge is done for the first time, is to study the synergetic effect of the codoping of Mo and S on the photocatalytic activity of a TiO2 photocatalyst. The physico-chemical characteristics of the prepared catalysts were investigated using XRD, SEM, TEM, EDX and UV-Vis DRS. Methyl orange (MO) was used as a model organic pollutant to analyze the photocatalytic performance of the prepared catalysts. Finally, it was found that Mo,S-codoped TiO2 has a nanoscale size with strong light absorbance and high quantum efficiency and the 0.06Mo–0.05S/TiO2 catalyst exhibited superior photocatalytic activity compared to the bare TiO2 and solely Mo- or S-doped TiO2 photocatalysts under UV and visible light irradiation.

2. Experimental

2.1. Chemicals

Ammonium heptamolibdate tetrahydrate ((NH4)6Mo7O24·4H2O), thiourea, titanium(IV) isopropoxide, glacial acetic acid, ethanol, and nitric acid were purchased from Merck and were used without any further purification. Deionized water prepared using an ultra-pure water system (smart-2-pure made by the TKA company of Germany) was used throughout.

2.2. Synthesis of Mo and S doped TiO2 nanocatalysts

The typical synthesis procedure of pure TiO2 nanoparticles was described in our previous work.36 The preparation procedure of S-doped TiO2 nanoparticles was the same as that for pure TiO2, except the added water contained thiourea as a source of S (corresponding to 0.05, 0.1, 0.15, 0.2, and 0.25 mol% with respect to TiO2).37

The preparation of Mo,S codoped TiO2 nanoparticles was carried out via a sol–gel method followed by photochemical reduction. In this regard, different amounts of (NH4)6Mo7·4H2O as a Mo precursor (corresponding to 0.03, 0.06 and 0.09 mol% with respect to TiO2) were added to S-doped TiO2 suspended in 200 ml of water, followed by purging with N2 for 30 min to remove oxygen from the suspension. Afterwards, the pot was tightly capped and put under UV irradiation for 12 h and Mo nanoclusters were formed and decorated over the S-doped TiO2 nanoparticles.

2.3. Assessment of photocatalytic performance of the prepared catalysts

The photocatalytic activity of the prepared catalysts was analyzed using MO degradation under UV and visible light irradiation. Each time, 0.1 g of photocatalyst was dispersed into 100 ml of 10 ppm MO aqueous solution with a pH of around 2–3 in a quartz reactor (with dimensions of 12 cm × 5 cm, height and diameter, respectively). Two 400 W Osram lamps were used as the sources of visible and UV light, located 40 cm and 25 cm away from the reactor, respectively. Before light irradiation, the reaction system was stirred in the dark for 30 min to achieve absorption equilibrium.

2.4. Nanophotocatalyst characterization

The crystalline phases of the prepared samples were analyzed using an X-ray powder diffractometer (XRD, Bruker D8 Discover X-ray Diffractometer). The morphology was revealed using a transmission electron microscope (TEM, Hitachi H-7650) and scanning electron microscope (SEM, Hitachi S-4800) equipped with an energy dispersive X-ray detector (EDX). The diffused reflectance spectroscopy (DRS) spectra of the samples were recorded using a Shimadzu 1800 spectrometer. The UV-Vis absorption spectra of MO after the degradation tests were obtained using a UV-Vis spectrophotometer (Perkin Elmer Lambda2S, Germany). The Raman spectra of the samples were collected using a DXR™ Raman Microscope, Thermo Scientific.

3. Results and discussion

3.1. Crystalline structure

The X-ray diffraction patterns of the prepared nanocatalysts of 0.05% S/TiO2 with different amounts of Mo doping (0.03, 0.06 and 0.09%) (Fig. 1) and 0.06% Mo with different amounts of S doping (0.05, 1, 0.15, 0.2 and 0.25%) (Fig. 2) suggested that all the samples possess high crystallinity with only an anatase TiO2 structure (2θ = 25.2, 37.76, 48.02, 54.05, 55.03, 62.80, 68.85, 70.19 and 75.07).36 Furthermore, the XRD patterns did not show any metal-related phase (as the metallic or metal oxide state) and it was concluded that the metal ions are uniformly loaded over the TiO2 surface.
image file: c5ra24096d-f1.tif
Fig. 1 XRD patterns of the 0.05% S/TiO2 nanocatalysts with (a) 0.03, (b) 0.06, and (c) 0.09% Mo, prepared via the photochemical deposition method.

image file: c5ra24096d-f2.tif
Fig. 2 XRD patterns of the 0.06% Mo/TiO2 nanocatalysts with (a) 0.05, (b) 0.1, (c) 0.15, (d) 0.2, and (e) 0.25% S prepared via the sol–gel method.

Fig. 3 illustrates the XRD patterns of pure TiO2 and Mo(0.06),S(0.05)-codoped TiO2 nanocatalysts. As shown, the incorporation of metal and non-metal elements such as Mo and S does not cause a significant change in the crystalline structure of TiO2, and a small shift in the positions of the anatase peaks are observed in Mo(0.06),S(0.05)-codoped TiO2 nanocatalysts compared to that of pure TiO2.


image file: c5ra24096d-f3.tif
Fig. 3 XRD patterns of the pure TiO2 (a) and Mo(0.06),S(0.05)-codoped TiO2 nanocatalysts (b).

The average particle size (D, in nm) of the prepared catalysts was determined using the XRD patterns according to Scherrer’s equation. The peak at 25.4° was used to calculate the average crystal size using the Scherrer equation:

 
D = /β[thin space (1/6-em)]cos[thin space (1/6-em)]θ (1)
where D is the crystallite size, λ the wavelength of X-ray radiation (0.1541 nm), K is a constant usually taken as 0.89, and β is the peak width at half-maximum height after the subtraction of equipment broadening, 2θ = 25.4° for anatase TiO2. The average crystal sizes of pure TiO2, S-doped TiO2, Mo-doped TiO2 and Mo,S-codoped TiO2 were found to be around 12–17 nm.

3.2. Morphological and elemental analysis

Fig. 4 shows the SEM micrographs of the pure and Mo,S-codoped TiO2 nanoparticles. The morphology of the nanoparticles was found to be uniform with slightly agglomerated spherical particles. Fig. 4 also reveals that the doping of Mo and S does not cause any change in the morphology of TiO2.35
image file: c5ra24096d-f4.tif
Fig. 4 SEM micrographs of pure TiO2 (A and B) and Mo(0.06),S(0.05)-codoped TiO2 (C and D).

Fig. 5 shows the corresponding EDX results of Mo,S-codoped TiO2 as the peaks of the nonmetal element S appear in the spectrum. The EDX spectrum further provides direct proof that Mo and S are successfully doped in TiO2 as their characteristic peaks appears in the spectrum.37


image file: c5ra24096d-f5.tif
Fig. 5 EDX result of the Mo(0.06),S(0.05)-codoped TiO2 catalyst.

The size and morphology of the prepared pure TiO2 and Mo,S-codoped TiO2 nanoparticles were also explored using TEM. Selected images are exhibited in Fig. 6. As is obvious from Fig. 6, the nanoparticles are successfully synthesized with a spherical-shape morphology.


image file: c5ra24096d-f6.tif
Fig. 6 TEM micrographs of pure TiO2 (A) and Mo(0.06),S(0.05)-codoped TiO2 (B).

3.3. Band gap analysis using DRS spectroscopy

The DRS results of the prepared nanocatalysts are shown in Fig. 7. The DRS results show a red shift in the absorption onset value in the case of Mo and S doped TiO2, indicating decreases in the band gap of the TiO2 photocatalyst. Non-metal elements have been proven to be beneficial in reducing the band gap energy of TiO2 through mixing of their p-orbital with the O2p-orbital, but the doping of transitional metals shifts the TiO2 optical absorption edge from the UV to visible light range without a prominent change in the TiO2 band gap.40–42 The enhancement of absorbance in the UV-Vis region increases the number of photogenerated electrons and holes to participate in the photocatalytic reaction, which results in the enhancement of the photocatalytic activity of TiO2.43
image file: c5ra24096d-f7.tif
Fig. 7 UV-Vis DRS results of the pure TiO2, and Mo- and S-doped TiO2 nanocatalysts.

3.4. Raman analysis

In order to investigate the chemical properties of the prepared nanocatalysts and the effect of binary doping on the chemical structure of TiO2, Raman analysis was undertaken and the corresponding results are shown in Fig. 8. Anatase TiO2 shows six peaks as follows: 144 cm−1 (Eg), 197 cm−1 (Eg), 399 cm−1 (B1g), 513 cm−1 (A1g), 519 cm−1 (B1g) and 639 cm−1 (Eg), while the rutile phase has four bands at 143 cm−1 (B1g), 447 cm−1 (Eg), 612 cm−1 (A1g), and 826 cm−1 (B2g).44 The findings related to Mo(0.06%),S(0.05%)-codoped TiO2 show identical signals of pure anatase TiO2 with a slight chemical shift. In addition, the intensity of the peaks for Mo(0.06%),S(0.05%)-codoped TiO2 varies from that of pure TiO2 which could be due to the surface coverage of it by Mo nanoclusters.45
image file: c5ra24096d-f8.tif
Fig. 8 Raman spectra of the pure TiO2, and Mo(0.06%),S(0.05%)-codoped TiO2 nanocatalysts.

3.5. Photocatalytic performance of the prepared nanocatalysts

The photocatalytic degradation of MO by the undoped as well as Mo, and S-doped TiO2 nanocatalysts under UV and visible light irradiation was evaluated. Fig. 9 and Table 1 show MO degradation using the S/TiO2 nanoparticles prepared by the sol–gel method with different doses of S under UV and visible light irradiation.
image file: c5ra24096d-f9.tif
Fig. 9 The photocatalytic results of MO degradation using the TiO2 nanoparticles doped with different amounts of S under UV and visible light irradiation.
Table 1 The photocatalytic results of MO degradation using the TiO2 nanoparticles doped with different amounts of S under UV and visible light irradiation
UV light
Elem. (%) 0.05 0.10 0.15 0.20 0.25
Time (min)
5 1.6 12.7 8.3 8.6 1.3
10 3.2 13.9 19.1 18.8 8.9
20 10.1 27.8 30.9 30.1 17.4
30 14.5 32.1 39.1 34.9 25.5
45 29.1 42.7 46.8 47.6 34.9
60 39.8 50.3 54.5 54.7 43.9
80 51.6 58.6 65.7 64.3 54.7
100 64.5 66.1 73.8 73.4 61.4
130 77.3 71.4 84.1 85 68.6
160 86.2 81.2 88.8 91.5 75.3
220 99.2 87.9 91.1 98.3 86
280 100 95.5 100 100 92.7

Visible light
Elem. (%) 0.05 0.10 0.15 0.20 0.25
Time (min)
5 7.2 7.5 4.1 1.2 7.6
10 8 12.5 5.7 2.4 8.5
20 8.9 13.1 6.1 5.9 8.9
30 9.2 14.1 8.3 7.6 9.6
45 10.1 16.1 10.9 12.7 11.4
60 10.8 17.0 14.8 13.9 16.6
80 11.6 18.2 16.8 15.5 22.1
100 21.5 20.6 18.9 17.3 23.1
130 21.7 21.1 22.7 17.8 24.3
160 22.4 29.1 28 19.0 26.6
220 25.2 23.4 32.2 20.7 28.8
280 29.6 25 51.1 28.6 32.9


Fig. 10 and Table 2 show the degradation of MO under UV and visible light irradiation for the Mo-doped TiO2 nanoparticles with 0.05% S/TiO2. Fig. 11 shows the degradation of MO under UV and visible light irradiation for the Mo,S-codoped TiO2 nanoparticles with 0.06% Mo and 0.05% S.


image file: c5ra24096d-f10.tif
Fig. 10 The photocatalytic results of MO degradation using the TiO2 nanoparticles doped with 0.05% S and different amounts of Mo under UV and visible light irradiation.
Table 2 The photocatalytic results of MO degradation using the Mo-doped TiO2 nanoparticles with 0.05% S under UV and visible light irradiation
UV light
Elem. (%) 0.03 0.06 0.09
Time (min)
5 29.9 24.5 32.3
10 54.6 40.3 59.5
20 81.7 68 78.7
30 94.3 84.7 92.3
45 99.6 95.9 98.7
60 100 100 100

Visible light
Elem. (%) 0.03 0.06 0.09
Time (min)
5 5.3 10.1 3.7
10 12.7 16.9 10.2
20 18.6 21.8 12.4
30 22.8 29.5 22.1
45 35.1 42.1 29.7
60 47.3 51 35.4
80 56.9 62.5 46.3
100 64 77.9 55.4
130 71.1 85.2 66.5
160 79.9 95.1 79
220 94.2 100 92.6
280 99.6 99


image file: c5ra24096d-f11.tif
Fig. 11 The photocatalytic results of MO degradation using the Mo,S-codoped TiO2 nanoparticles with 0.05% S and 0.06% Mo.

During the photocatalytic process, the absorption of the photons by the photocatalyst leads to the excitation of the electrons from the VB to the CB and generates electron–hole pairs. The electron in the conduction band is captured by oxygen molecules dissolved in the suspension and the hole in the VB can be captured by OH or H2O species adsorbed on the surface of the catalyst, to produce the hydroxyl radical. Hydroxyl radicals then oxidize the pollutants. Thus, the recombination of photogenerated electrons and holes is one of the most significant factors impacting the photoactivity of TiO2.43

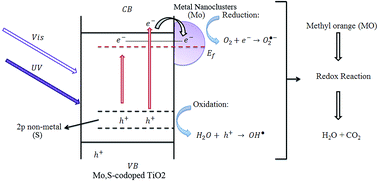
The results exhibit that the Mo,S-codoped TiO2 nanoparticles prepared by the photochemical method have higher activity than that of undoped TiO2 or TiO2 doped with either Mo or S. In particular, the doping of TiO2 by either Mo or S increases the photocatalytic activity, but codoping of Mo and S enhances the photocatalytic activity with a higher rate. The significantly higher photocatalytic performance of Mo,S-codoped TiO2 may be due to the synergetic effect of the co-doping of S and Mo in the TiO2 nanoparticles. The presence of S reduces the band gap of TiO2 and Mo nanoclusters located over the TiO2 catalyst function as electron scavengers (the formation of a Schottky barrier) and inhibit the charge recombination of photogenerated electron–hole pairs at the surface of the catalyst as shown in Scheme 1.46 Overall, it is speculated that the higher photocatalytic activity of Mo,S-codoped TiO2, is due to either one or a combination of the following factors: (i) increased light absorption capability of Mo,S-codoped TiO2 compared to undoped TiO2; (ii) alleviation of the surface poison phenomenon; (iii) reduction of the recombination rate of the photogenerated electron–hole pairs. Mo can act as both an electron and hole trap to reduce the recombination rate and enhance the photocatalytic activity of TiO2.47


image file: c5ra24096d-s1.tif
Scheme 1 Mechanism of the degradation of MO by pure TiO2 and Mo,S-codoped TiO2 photocatalysts. The scheme shows the band gap reduction and formation of the Schottky barrier in the Mo,S-codoped TiO2 photocatalyst compared to that of the pure TiO2.

Overall, we think that due to the excellent features deriving from the synergetic effects of binary metal and non-metal doping, the newly developed Mo,S-codoped TiO2 photocatalyst can be a promising candidate for environmental applications such as air and water purification.

4. Conclusions

The sulfur and molybdenum codoped TiO2 photocatalysts of Mo,S-codoped TiO2 were successfully prepared using a modified sol–gel method in conjunction with photochemical reduction and the synthesized photocatalysts were used to degrade MO as a model organic pollutant. The XRD patterns showed the highly crystalline nature of the prepared catalysts in which only the anatase phase was detected in all the undoped and doped samples. Morphological analyses performed using SEM and TEM showed relatively agglomerated spherical nanoparticles. EDX and DRS analyses further confirmed the successful doping of Mo and S in TiO2 and the synthesis of Mo,S-codoped TiO2. In general, our findings showed that the codoping of TiO2 with Mo and S led to a smaller particle size, lower band gap value, red shift in the light absorption threshold, and the formation of a Schottky barrier at the interface between the TiO2 and Mo nanoclusters. The photocatalytic activity of the samples was tested using the degradation of MO as a model organic pollutant and the findings showed that Mo,S-codoped TiO2 nanoparticles have a higher photocatalytic activity than undoped TiO2 as well as solely Mo- or S-doped TiO2 samples under UV and visible light. This promotion in photocatalytic performance was ascribed to the synergetic effect of S and Mo. In conclusion, our results show Mo,S-codoped TiO2 is a promising photocatalyst and could be a good candidate for various environmental applications.

Acknowledgements

We are grateful to the Council of the University of Kashan, Iran Nanotechnology Initiative Council and the University of Texas at El Paso (UTEP) for providing financial support. We also thank Dr Maryam Zarei-Chaleshtori for helping us with SEM and XRD analyses, Dr Peter Cooke from New Mexico State University (NMSU) for helping us with TEM analysis, Dr Luis Echegoyen’s lab for access to the Raman instrument, and the College of Engineering at UTEP for allowing access to their SEM and XRD instruments.

References

  1. N. Zhang, M.-Q. Yang, S. Liu, Y. Sun and Y.-J. Xu, Chem. Rev., 2015, 115, 10307 CrossRef CAS PubMed.
  2. M.-Q. Yang, N. Zhang, M. Pagliaro and Y.-J. Xu, Chem. Soc. Rev., 2014, 43, 8240 RSC.
  3. Y. Zhang, Z. R. Tang, X. Fu and Y. J. Xu, ACS Nano, 2010, 4, 7303 CrossRef CAS PubMed.
  4. X. Chen and S. S. Mao, Chem. Rev., 2007, 107, 2891 CrossRef CAS PubMed.
  5. C. Han, M.-Q. Yang, N. Zhang and Y.-J. Xu, J. Mater. Chem. A, 2014, 2, 19156 CAS.
  6. N. Clifford, E. Palomares, K. Nazeeruddin, R. Thampi, M. Grtzel and J. R. Durrant, J. Am. Chem. Soc., 2004, 126, 5670 CrossRef PubMed.
  7. W. Zhao, C. C. Chen, X. Z. Li and J. C. Zhao, J. Phys. Chem. B, 2002, 106, 5022 CrossRef CAS.
  8. M. Jakob, H. Levanon and P. V. Kamat, Nano Lett., 2003, 3, 353 CrossRef CAS.
  9. R. Asahi, T. Morikawa, T. Ohwaki, K. Aoki and Y. Taga, Science, 2001, 293, 269 CrossRef CAS PubMed.
  10. D. M. Chen, D. Yang, Q. Wang and Z. Y. Jiang, Ind. Eng. Chem. Res., 2006, 45, 4110 CrossRef CAS.
  11. J. C. S. Wu and C. H. Chen, J. Photochem. Photobiol., A, 2004, 163, 509 CrossRef CAS.
  12. M. Anpo and M. Takeuchi, J. Catal., 2003, 216, 505 CrossRef CAS.
  13. T. Umebayashi, T. Yamaki, H. Itoh and K. Asai, Appl. Phys. Lett., 2002, 81, 454 CrossRef CAS.
  14. T. Umebayashi, T. Yamaki, S. Tanala and K. Asai, Chem. Lett., 2003, 32, 330 CrossRef CAS.
  15. T. Umebayashi, T. Yamaki, S. Yamamoto, A. Miyashita, S. Tanala, T. Sumita and K. Asai, J. Appl. Phys., 2003, 93, 5156 CrossRef CAS.
  16. T. Ohno, T. Mitsui and M. Matsumura, Chem. Lett., 2003, 32, 364 CrossRef CAS.
  17. T. Ohno, M. Akiyoshi, T. Umebayashi, K. Asai, T. Mitsui and M. Matsumura, Appl. Catal., A, 2004, 265, 115 CrossRef CAS.
  18. T. Ohno, Water Sci. Technol., 2004, 49, 159 CAS.
  19. W. Zhao, W. Ma, C. Chen, J. Zhao and Z. Shuai, J. Am. Chem. Soc., 2004, 126, 4782 CrossRef CAS PubMed.
  20. T. Tachikawa, S. Tojo, K. Kawai, M. Endo, M. Fujitsuka, T. Ohno, K. Nishijima, Z. Miyamoto and T. Majima, J. Phys. Chem. B, 2004, 108, 19299 CrossRef CAS.
  21. D. Chen, Z. Jiang, J. Geng, Q. Wang and D. Yang, Ind. Eng. Chem. Res., 2007, 46, 2741 CrossRef CAS.
  22. L. Lin, R. Y. Zheng, J. L. Xie, Y. X. Zhu and Y. C. Xie, Appl. Catal., B, 2007, 76, 196 CrossRef CAS.
  23. X. Li, R. Xiong and G. Wei, Catal. Lett., 2008, 125, 104 CrossRef CAS.
  24. F. Wei, L. Ni and P. Cui, J. Hazard. Mater., 2008, 156, 135 CrossRef CAS PubMed.
  25. D. B. Hamal and K. J. Klabunde, J. Colloid Interface Sci., 2007, 311, 514 CrossRef CAS PubMed.
  26. K. Obata, H. Irie and K. Hashimoto, Chem. Phys., 2007, 339, 124 CrossRef CAS.
  27. W. Pingxiao, T. Jianwen and D. Zhi, Mater. Chem. Phys., 2007, 103, 264 CrossRef.
  28. H. Huang, K. Liu, K. Chen, Y. Zhang, Y. Zhang and S. Wang, J. Phys. Chem. C, 2014, 118, 14379 CAS.
  29. D. R. Zhang, Y. H. Kim and Y. S. Kang, Curr. Appl. Phys., 2006, 6, 801 CrossRef.
  30. R. Khan, S. W. Kim, T.-J. Kim and C.-M. Nam, Mater. Chem. Phys., 2008, 112, 167 CrossRef CAS.
  31. X. Yang, L. Xu, X. Yu and Y. Guo, Catal. Commun., 2008, 9, 913 CrossRef.
  32. X. Huili, Z. Huisheng, X. Dongchang and Z. Tao, J. Wuhan Univ. Technol., Mater. Sci. Ed., 2008, 467–471 Search PubMed.
  33. C. Liu, X. Tang, C. Mo and Z. Qiang, J. Solid State Chem., 2008, 181, 913 CrossRef CAS.
  34. M. Hamadanian, S. Karimzadeh, V. Jabbari and D. Villagrán, Mater. Sci. Semicond. Process., 2016, 41, 168 CrossRef CAS.
  35. V. Jabbari, M. Hamadanian, A. Reisi-Vanani, P. Razi, S. Hoseinifard and D. Villagrán, RSC Adv., 2015, 5, 78128 RSC.
  36. M. Hamadanian, A. Sadeghi Sarabi, A. Mohammadi Mehra and V. Jabbari, Appl. Surf. Sci., 2011, 257, 10639 CrossRef CAS.
  37. M. Hamadanian, A. Reisi-Vanani, P. Razi, S. Hoseinifard and V. Jabbari, Appl. Surf. Sci., 2013, 285, 121 CrossRef CAS.
  38. D. B. Hamal and K. J. Klabunde, J. Colloid Interface Sci., 2007, 311, 514 CrossRef CAS PubMed.
  39. H. Wei, W. Wu, N. Lun and F. Zhao, J. Mater. Sci., 2004, 39, 1305 CrossRef CAS.
  40. L. Gomathi Devi, S. Girish Kumar, B. Narasimha Murthy and N. Kottam, Catal. Commun., 2009, 10, 794 CrossRef.
  41. R. Long and N. J. English, Phys. Rev. B: Condens. Matter Mater. Phys., 2011, 83, 155209 CrossRef.
  42. R. Long and N. J. English, Chem. Mater., 2010, 22, 1616 CrossRef CAS.
  43. H. Huang, X. Li, J. Wang, F. Dong, P. K. Chu, T. Zhang and Y. Zhang, ACS Catal., 2015, 5, 4094 CrossRef CAS.
  44. K. L. Frindell, M. H. Bartl, A. Popitsch and G. D. Stucky, Angew. Chem., Int. Ed., 2002, 41, 959 CrossRef CAS.
  45. K. R. Zhu, M. S. Zhang, Q. Chen and Z. Yin, Phys. Lett. A, 2005, 340, 220 CrossRef CAS.
  46. M. Hamadanian, M. Shamshiri and V. Jabbari, Appl. Surf. Sci., 2014, 317, 302 CrossRef CAS.
  47. M. Hamadanian, V. Jabbari, M. Asad, M. Shamshiri and I. Mutlay, J. Taiwan Inst. Chem. Eng., 2013, 44, 748 CrossRef CAS.

This journal is © The Royal Society of Chemistry 2016