Towards the development of eco-friendly disposable polymers: ZnO-initiated thermal and hydrolytic degradation in poly(L-lactide)/ZnO nanocomposites†
E. Lizundia*a,
L. Ruiz-Rubio a,
J. L. Vilasab and
L. M. Leónab
aMacromolecular Chemistry Research Group (LABQUIMAC), Dept. of Physical Chemistry, Faculty of Science and Technology, University of the Basque Country (UPV/EHU), Spain. E-mail: erlantz.liizundia@ehu.eus
bBasque Center for Materials, Applications and Nanostructures (BCMaterials), Parque Tecnológico de Bizkaia, Ed. 500, Derio 48160, Spain
First published on 1st February 2016
Abstract
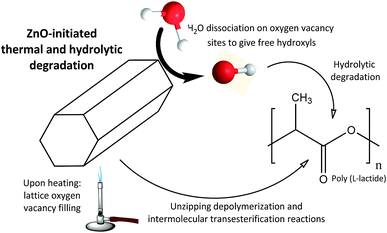
In this work poly(L-lactide)/ZnO nanocomposites with homogeneously distributed nanoparticles have been fabricated by a solvent-precipitation method. The obtained nanocomposites have been submitted to thermal and hydrolytic degradation processes in order to elucidate the catalytic effect of ZnO nanoparticles. The resulting degradation products from the thermally-initiated catalysis have been identified by Fourier transform infrared spectroscopy (FTIR). It has been found that the presence of ZnO gives rise to a 65-fold increase in the formation of CO2 in comparison to acetaldehyde. FTIR results of hydrolytically degraded nanocomposites show an increased amount of carboxylic acid groups as ZnO concentration increases, while the C![[double bond, length as m-dash]](https://www.rsc.org/images/entities/char_e001.gif) O stretching band splitting denoted larger crystalline regions as degradation proceeds. The obtained results are explained from the viewpoint of lattice oxygen vacancies in ZnO. Upon thermodegradation nanoparticles initiate unzipping depolymerization/intermolecular transesterification reactions in PLLA, while during hydrolytic degradation H2O is dissociated on oxygen vacancy sites, giving hydroxyl groups that initiate the hydrolysis of ester bonds, and thus reducing PLLA to soluble monomers. The obtained findings are expected to allow the development of eco-friendly disposable polymeric waste by opening new possibilities in the use of naturally-available materials as efficient catalysts for feedstock recycling of biopolymers by common chemical processes.
O stretching band splitting denoted larger crystalline regions as degradation proceeds. The obtained results are explained from the viewpoint of lattice oxygen vacancies in ZnO. Upon thermodegradation nanoparticles initiate unzipping depolymerization/intermolecular transesterification reactions in PLLA, while during hydrolytic degradation H2O is dissociated on oxygen vacancy sites, giving hydroxyl groups that initiate the hydrolysis of ester bonds, and thus reducing PLLA to soluble monomers. The obtained findings are expected to allow the development of eco-friendly disposable polymeric waste by opening new possibilities in the use of naturally-available materials as efficient catalysts for feedstock recycling of biopolymers by common chemical processes.
Introduction
Nowadays there is an increasing interest from both academia and private industry towards the development of a sustainable society. In this trend of obtaining sustainable materials, especially interesting is the development of biopolymer-based parts to be used in the packaging industry, where the use of non-biodegradable materials for short-term use applications is very widespread. In this sense, biodegradable polymers such as poly(L-lactide) (PLLA) have been gaining both scientific and commercial significance due to their inherent physicochemical characteristics and their renewable character.1,2 Besides fulfilling the requirements of the traditionally available thermoplastics such as polyethylene terephthalate (PET), polystyrene (PS) and polypropylene (PP), their economically feasible industrial production makes polylactides interesting candidates to replace current petroleum-based plastics.3,4At the present time, the feedstock recycling of biopolymers by common chemical processes remains insufficiently explored and is still open to debate. Thereby, it results highly desirable to develop industrial processes in which the plastic recycling would be carried out at low cost and in a controllable way. In this framework, Fan et al. have shown that alkali earth metal oxides such as calcium oxide (CaO) and magnesium oxide (MgO) selectively produce L,L-lactide and lowered thermal degradation temperature, which would serve for the feed stock recycling of PLLA.5 In a similar work, Motoyama et al. found that the catalytic activity of MgO markedly increases in presence of smaller particles because of the increase in the catalytic surface area.6 In view to those results, in this work we use more economically feasible catalyst particles as a cost-effective approach to reduce PLLA and in that way develop eco-friendly disposable materials. Among all the available materials, zinc oxide nanoparticles (ZnO) are of special interest since they present higher catalytic efficiency in regard to other materials in both aqueous and air media.7–9 Since catalytic reactions usually take place at the particle surfaces, the use of large surface area nanorods is desirable for enhancing the activity of zinc oxide.10 At the same time, by using biocompatible zinc oxide nanoparticles UV-absorbing films with high visible transparency would be achieved,11 preventing food photodegradation when PLLA is used as packaging material.12–15
Spectroscopic and non-destructive techniques such as Fourier transform infrared spectroscopy (FTIR) are of key relevance to understand degradative processes of polymers since they allow identifying compounds while enable the determination of crystalline phases when intermolecular interactions take place.16 In this sense, the degradation mechanism induced by the presence of ZnO nanoparticles could be identified by the FTIR analysis of the evolved gases resulting from the chain cleavage of the PLLA/ZnO nanocomposites. Moreover, the analysis of the carbonyl (C![[double bond, length as m-dash]](https://www.rsc.org/images/entities/char_e001.gif) O) stretching band, which remains almost uncoupled from the vibrational modes of the backbone chain,17 would provide information about the conformational changes occurring during the hydrolytic degradation of PLLA-based materials.
O) stretching band, which remains almost uncoupled from the vibrational modes of the backbone chain,17 would provide information about the conformational changes occurring during the hydrolytic degradation of PLLA-based materials.
ZnO nanoparticles have been previously used to improve the photocatalytic activity of thermoplastic polymers such as polypropylene (PP).18 However, to the best of our knowledge, no previous work have been devoted to the systematic study of the reactions occurring in both thermally and hydrolytically catalyzed reactions in biopolymers in presence of ZnO. Thereby, in this work we attempt to elucidate how the presence of ZnO nanoparticles affects the resulting catalytic processes of PLLA, which would help the packaging industry to develop new disposable materials. FTIR has been carried out to identify thermodegradation compounds together with the conformational changes occurring during the hydrolytic degradation of PLLA-based materials. According to the 12 Principles of Green Chemistry,19 the development of renewable PLLA-based nanocomposites with well-dispersed ZnO nanoparticles would open new insights towards the development of eco-friendly disposable polymeric waste.
Experimental
Materials and sample preparation
PLLA with a number-average molecular weight (Mn) of 100.000 g mol−1 and a polydispersity index (Mw/Mn) of 1.85 (see molecular weight distribution in the ESI, Fig. S1†) has been supplied by Purac Biochem. Phosphate buffered saline (PBS) tablets were supplied by Sigma Aldrich, chloroform (reagent ≥ 99.8%) was purchased from LabScan and methanol (reagent ≥ 99.5%) was purchased by Panreac. Zinc oxide (ZnO) nanoparticles, with a purity of ≥99.5% according to obtained X-ray diffraction pattern (Fig. 1a), have been kindly purchased by L'Urederra technological centre (Spain).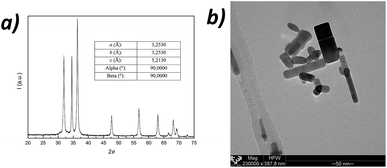 | ||
| Fig. 1 WAXD pattern of ZnO nanoparticles (a) and representative transmission electron microscopy (TEM) image showing the hexagonal structure of ZnO nanoparticles at a 230.000× magnification (b). | ||
Samples have been prepared by solvent-precipitation followed by compression moulding. Firstly, ZnO nanoparticles were homogeneously dispersed in chloroform (CHCl3) via mild-sonication (20% output for 1 minute) in a Vibra-Cell™ CV 334 ultrasonic processor. Finely dispersed nanoparticles were added to dissolved PLLA (in chloroform) to obtain ZnO concentrations ranging from 0.05 wt% to 5 wt%. To obtain a good dispersion of nanoparticles within the polymer, PLLA–ZnO dispersions were submitted to an additional sonication step for 5 minutes before precipitating them in an excess of methanol. This method ensures a homogeneous distribution of nanoparticles (NPs) within the PLLA matrix. Once resulting materials were dried during 48 h at 60 °C in a vacuum-oven, films with a thickness of 80 ± 10 μm were fabricated in a hydraulic hot press by compression moulding at 200 °C for 4 minutes under a pressure of 150 MPa.
Wide angle X-ray diffraction (WAXD)
Room temperature wide angle X-ray diffraction (WAXD) has been conducted in order to elucidate the crystalline structure of ZnO nanoparticles and PLLA/ZnO nanocomposites during their hydrolytic degradation. X-ray powder diffraction patterns were collected in a PHILIPS X'PERT PRO automatic diffractometer in theta–theta configuration, secondary monochromator with Cu-Kα radiation (λ = 1.5418 Å) and a PIXcel solid state detector. The sample was mounted on a zero background silicon wafer fixed in a generic sample holder. Data were collected from 20 to 75° 2θ (step size = 0.026) at RT. The presence of oxygen vacancies in the ZnO lattice has been determined by WAXD measurements on a Bruker D8 Advance diffractometer operating at 30 kV and 20 mA, equipped with a Cu tube (λ = 1.5418 Å), a Vantec-1 PSD detector, and an Anton Parr HTK2000 high-temperature furnace. The powder patterns were recorded in 2θ steps of 0.0167° in the 10 ≤ 2θ ≤ 60 range, counting for 2 s per step (total time 2 h). Data sets were recorded at 30, 200, 225 and 250 °C with a 0.2 °C s−1 heating rate.Morphological characterization
ZnO nanoparticles have been analyzed by transmission electron microscopy (TEM). A droplet of diluted ZnO suspension (0.1% (w/w)) in distilled water was deposited on a carbon-coated grid. TEM was carried out using a Philips CM120 Biofilter apparatus with STEM module at an acceleration voltage of 120 kV. Cryofractured surfaces of nanocomposites have been analyzed in a Hitachi S-4800 field emission scanning electron microscope (FE-SEM) at an acceleration voltage of 5 kV. Surfaces were chromium-coated in a Quorum Q150T ES turbo-pumped sputter coater (5 nm thick coating).Thermogravimetric analysis (TGA)
Thermo-degradative behaviour of nanocomposites was studied by means of Thermal Gravimetric Analysis (TGA METTLER TOLEDO 822e) in alumina pans by heating the samples from room temperature to 500 °C at 10 °C min−1 with nitrogen flux of 50 ml min−1. Thermodegradation products (exhaust gases upon heating the samples) were analyzed using a Thermo Nicolet Nexus 670 FTIR spectrophotometer connected through an interface to DTG-60 Shimadzu thermobalance. Neat PLLA and its PLLA/ZnO 1 wt% nanocomposite were heated from room temperature to 500 °C at 10 °C min−1 under nitrogen atmosphere. FTIR scans were taken every 16 s.Contact angle measurements
Water was used as the probe liquid for the determination of hydrophobicity at the nanocomposite surface. Measurements were carried out by sessile drop method (2 μL per drop at a rate of 2 μL s−1) using a Neurtek Instruments OCA 15 EC at room temperature. The average values were calculated using six measurements of each composition.Hydrolytic degradation
Neat PLLA and its ZnO nanocomposites (square-shaped; 1 cm2) were hydrolytically degraded in an oven at 80 °C. 80 μm thick samples with a surface area to volume ratio of 0.2 cm−1 were immersed in a PBS solution (PBS tablets dissolved in Milli-Q water; pH = 7.4) and they were removed after 1, 3, 6, 10, 12, 18 and 25 days. The pH evolution of the medium has been monitored using a 691 pH meter (Metrohm).Fourier transform infrared spectroscopy (FTIR)
Infrared spectra in transmission KBr mode were recorded on a Thermo Nicolet Nexus 670 FTIR spectrophotometer. Samples were prepared by spreading two drops of a 2 wt% solution over KBr pellets. The solution was dried in vacuum at 60 °C for 24 h before characterization. Each IR spectrum consisted of 64 scans taken in the range 400–4000 cm−1 with a resolution of 2 cm−1. The average values over three replicates are reported for each material.Results and discussion
ZnO nanoparticle characterization
Both X-ray diffraction (WAXD) and Transmission Electron Microscopy (TEM) have been carried out to determine the structure of ZnO nanoparticles, which affects the physicochemical properties of PLLA/ZnO nanocomposites. As depicted in Fig. 1a, WAXD data exhibits featured reflections of hexagonal crystal system of ZnO, known as wurtzite (P63mc space group, with crystal lattice dimensions shown in the insert).20 TEM micrographs confirm the nanoscale nature of ZnO particles, which present a rod-shaped structure of 15–30 nm wide and 25–85 nm long.Thermal degradation of PLLA and PLLA/ZnO nanocomposites
PLLA is one of the most sensitive thermoplastic to high temperatures in comparison with other polyesters such as poly(ε-caprolactone) (PCL) or poly(L-lactide-co-ε-caprolactone) (PLCL).21 Fig. 2 shows thermogravimetric (a) and weight loss rates (b) of neat PLLA and its ZnO nanocomposites with a concentration up to 5 wt%, being their characteristic thermodegradation temperatures summarized in Table 1. Results show a continuous reduction on the thermal stability because of the catalytic behaviour of ZnO. | ||
| Fig. 2 Thermogravimetric traces (a) and weight lost rates (or derivative TGA curve) (b) of PLLA/ZnO nanocomposites as a function of ZnO concentration. | ||
| ZnO wt% | 0 | 0.05 | 0.1 | 0.2 | 0.5 | 1 | 2 | 5 |
| T5% (°C) | 340.2 | 328.3 | 302.2 | 279.8 | 271.1 | 264 | 258.2 | 243.4 |
| T10% (°C) | 347.2 | 337.8 | 310.9 | 288.2 | 280 | 273.4 | 266.2 | 252.9 |
| Tpeak (°C) | 366.8 | 363.5 | 348.2 | 331.5 | 312.9 | 306.7 | 295.4 | 282.5 |
| FWHM (°C) | 21.9 | 24 | 26.3 | 30.5 | 21.6 | 21.9 | 20.4 | 18.5 |
As shown in Table 1, thermal degradation of unreinforced polymer begins (T5 wt%) at 340.2 °C and reaches its maximum rate (Tpeak) at 366.8 °C. Conversely, PLLA/ZnO 5 wt% nanocomposite begins to degrade almost 100 °C below, at 243.4 °C, to attain its maximum rate at 282.5 °C (note that the char residue increases with NP loading due to the high thermal stability of ZnO). As could be seen in Fig. 2b, while the derivative TGA curve (DTG) of neat PLLA shows a bell-shaped curve (representing a single degradation step), nanocomposites containing 0.1 wt% and 0.2 wt% ZnO present a shoulder in their weight lost rates located at temperatures of 307 °C and 294 °C respectively. Accordingly, the maximum weight lost rate decreases with increasing ZnO content from 3.48% per °C for neat PLLA to a minimum value of 2.63% per °C for its 0.2 wt% nanocomposite, which reflects slower degradation rate for these compositions. This fact is accompanied by wider curve as denoted by a full width at half maximum (FWHM) of 21.9 °C for neat polymer in regard to 30.5 °C obtained in the case of 0.2 wt% counterpart. At larger concentrations, both curve-shape and FWHM reach similar values to those obtained for PLLA. It should be noted that the first degradation step in nanocomposites containing low ZnO concentration;22 i.e. 0.1 and 0.2 wt%, may be related to the thermodegradation of PLLA close to ZnO surfaces, the second stage, achieved at higher temperatures, could be associated with the degradation of PLLA that is far from nanoparticles. This behaviour has been previously found in several processes of polymer-based nanocomposites involving chain mobility, where the presence of nanoparticles results in the development of kinetically different phases (for example, in processes concerning crystallization,23,24 structural relaxation and mechanical reinforcement).25,26
On the contrary, at large nanoparticle concentration, the increased exposition of L-lactide units to ZnO surfaces results in the presence of a single degradation step, in which thermodegradation proceeds even in a narrower temperature-range than in the case of neat PLLA as confirmed by a FWHM of 18.5 °C for 5 wt% nanocomposite counterpart with respect to 21.9 °C in the case of neat polymer. This remarkable continuous decrease in thermal stability of PLLA with ZnO concentration, especially up to 0.2 wt%, may arise from the fact that metallic nanoparticles such as Fe, Al, Zn and Sn catalyze depolymerization reactions of the matrix, boosting the occurring thermodegradation process.27–29 Indeed, ZnO nanoparticles coordinate PLLA backbone ester groups, accelerating the unzipping depolymerization reactions as would be further discussed in the following section.30
In order to further understand the catalytic effect of ZnO nanoparticles during the heating of PLLA, the resulting degradation products from the PLLA thermodegradation have been analyzed by FTIR. The spectra corresponding to exhaust gases obtained during the thermal degradation of neat PLLA and PLLA/ZnO 1 wt% nanocomposite are shown in Fig. 3. It should be pointed out that these spectra correspond to 10, 50, 80 and 95 wt% weight loss of the samples, thus, and according to TGA thermograms shown above, the temperatures at which have been collected differ substantially from each another. The main degradation products obtained during the thermal degradation of neat PLLA ((C3H4O2)n) could be identified as acetaldehyde (C2H4O; 2733 cm−1, 1759 cm−1, 1370 cm−1 and 1106 cm−1 bands), carbon monoxide (CO; two sharp peaks at 2176 cm−1 and 2120 cm−1), and carbon dioxide (CO2; three absorption bands positioned at 2362 cm−1, 2334 cm−1 and 669 cm−1). Furthermore, small traces of L-lactic acid (C3H6O3; narrow peak at 1739 cm−1 and a broad band in 1000–1500 cm−1 range with maximum at 1457 cm−1, 1212 cm−1, 1128 cm−1 and 1045 cm−1) and low-molecular-weight by-products such as formic acid (CH2O2; main three bands at 1700–1820 cm−1, 1050–1130 cm−1 and 550–750 cm−1) could be observed. The spectra corresponding to the gaseous products evolved from neat PLLA and PLLA ZnO 1 wt% at weight loss of 40% and their assignments are depictured in the Fig. 4 (enlarged spectra within the 1600–2000 cm−1 region is provided in the ESI, Fig. S2†). These observations agree with the investigations carried out by McNeil and Leiper,31 who found that PLLA chain cleavage produces cyclic oligomers, lactide, acetaldehyde, carbon monoxide and carbon dioxide.
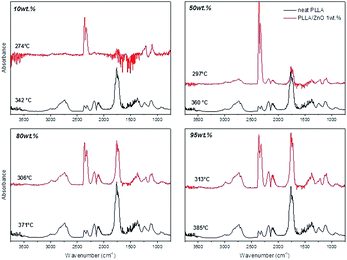 | ||
| Fig. 3 FTIR spectra of thermodegradation products obtained of neat PLLA and PLLA/ZnO 1 wt% at different weight loss percent: 10, 50, 80 and 95 wt%. | ||
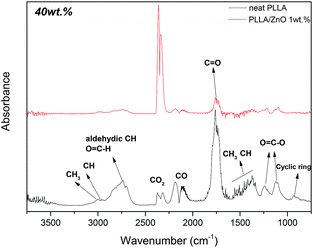 | ||
| Fig. 4 FTIR spectra of the evolved gases of neat PLLA and PLLA/ZnO 1 wt% at 40 wt%, recorded at 294 °C and 357 °C, respectively. | ||
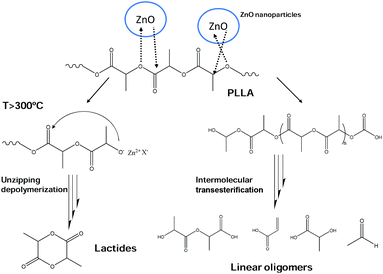
Additionally, during the last part of thermodegradation process water is produced as a consequence of L-lactic acid oligomer fragmentation.32 The results obtained from the analysis of the evolved gases upon thermal decomposition suggest that the degradation of the PLLA/ZnO nanocomposites combines unzipping depolymerization and random transesterification processes. In FTIR spectra of PLLA/ZnO 1 wt% nanocomposite enlarged for 1000–2000 cm−1 region (Fig. S3†) an overlapped presence of aldehyde and L-lactic could be observed. The observation of acetaldehyde and formic acid degradation exhausts corresponds to a transesterification process. Besides, beyond 300 °C a characteristic lactide peak is observed at 940 cm−1 in Fig. S3,† indicating an unzipping depolymerization reaction. In the Scheme 1 a possible reaction mechanisms for PLLA/ZnO nanocomposites is proposed. These results agree with the previous studies of PLLA/metal oxide composites with MgO, CaO and SnO,5,6,32,33 in which a catalytic effect of these oxides have been analysed. The degradation of PLLA catalyzed by ZnO nanoparticles present similarities to MgO catalyzed process since lactides are present at higher temperature than 250 °C observed for CaO.5,6 On the other hand, at Sn-catalyzed degradation a random transesterification have been observed.
Although in both PLLA and PLLA/ZnO 1 wt% degradation processes the same products are formed, there are considerable divergences when considering the relative intensity of absorption bands. Indeed, while acetaldehyde, carbon dioxide and carbon monoxide are formed from the beginning of PLLA thermodegradation (Fig. 3) and their intensity-ratios remains fairly unchanged over the entire decomposition reaction, thermodegradation products of PLLA/ZnO 1 wt% nanocomposite strongly depends on the conversion rate. Table 2 shows the ratio between evolved acetaldehyde and CO2 calculated from the intensity ratio between absorption bands located at 1759 cm−1 and 2362 cm−1. In this sense, it can be clearly observed that acetaldehyde represents the main degradation product of neat polymer, while in presence of 1 wt% of ZnO nanoparticles much larger quantities of CO and CO2 are evolved during the thermodegradation process. This is in line with the work developed by Saleh et al.,34 where it has been showed that ZnO generates ˙OH radicals that could react with gaseous acetaldehyde (CH3CHO) to generate carbon dioxide and water. From the beginning of the PLLA degradation, acetaldehyde/CO2 ratio is found to be about 5, which gradually increases up to 10.54 when 70 wt% has been degraded (at 367 °C). Then, an increase of temperature up to 385 °C reduces the acetaldehyde/CO2 ratio to 5.67. At 95 wt% loss mainly formic acid is generated, which is significantly less volatile compound than acetaldehyde. On the contrary, as denoted by the increase of the absorption bands located at 2362 cm−1 and 2334 cm−1, CO2 yield dramatically rises in presence of ZnO nanoparticles, being the amount of evolved CO2 much larger than that of acetaldehyde (acetaldehyde/CO2 ratio is about 0.08) during the initial stages of thermodegradation, which represents a 65-fold change in comparison with neat polymer.
| ZnO concentration | Mass loss (wt%) | ||||||||
|---|---|---|---|---|---|---|---|---|---|
| 20 | 30 | 40 | 50 | 60 | 70 | 80 | 90 | 95 | |
| 0 wt% | 5.23 | 5.78 | 6.82 | 9.31 | 9.79 | 10.54 | 10.27 | 8.91 | 5.67 |
| 1 wt% | 0.08 | 0.09 | 0.13 | 0.21 | 0.31 | 0.48 | 1.06 | 1.04 | 0.73 |
As shown in Fig. S4,† concerning to the volatility of compounds it is important to note that, for the same temperature, the vapour pressure of CO2 is 42![[thin space (1/6-em)]](https://www.rsc.org/images/entities/char_2009.gif) 753 mmHg, being the vapour pressure of acetaldehyde 57 times smaller (42
753 mmHg, being the vapour pressure of acetaldehyde 57 times smaller (42![[thin space (1/6-em)]](https://www.rsc.org/images/entities/char_2009.gif) 753 mmHg vs. 740 mmHg).35 Thus, according to Raoult's law it is reasonable to suppose that the primary reason of the reduced thermal stability of PLLA/ZnO nanocomposites regarding neat PLLA arises from the generation of more volatile thermodegradation products in the presence of ZnO nanoparticles.36 To the best of our knowledge, this is the first report in which TGA-FTIR measurements show that the presence of nanofillers modifies the thermodegradation products of PLLA. The developed CO and CO2 gases could be used for active packaging applications since they could effectively extend the self-life of packed foods. Indeed, FDA has approved the use of carbon monoxide as primary packaging system,37 while carbon dioxide could be used as oxygen scavenger to remove, or at least decrease the amount of oxygen gas into the package.38 Moreover, it has been proven that CO2 limits the microbial growth in foods such a fish, cheese and meat.39 Another interesting application is the development of methanol as an alternative to petro-based fuels since it could be produced by the hydrogenation of both carbon monoxide and carbon dioxide (for example, by using bimetallic Cu–ZnO and Pd–Cu catalysts).40
753 mmHg vs. 740 mmHg).35 Thus, according to Raoult's law it is reasonable to suppose that the primary reason of the reduced thermal stability of PLLA/ZnO nanocomposites regarding neat PLLA arises from the generation of more volatile thermodegradation products in the presence of ZnO nanoparticles.36 To the best of our knowledge, this is the first report in which TGA-FTIR measurements show that the presence of nanofillers modifies the thermodegradation products of PLLA. The developed CO and CO2 gases could be used for active packaging applications since they could effectively extend the self-life of packed foods. Indeed, FDA has approved the use of carbon monoxide as primary packaging system,37 while carbon dioxide could be used as oxygen scavenger to remove, or at least decrease the amount of oxygen gas into the package.38 Moreover, it has been proven that CO2 limits the microbial growth in foods such a fish, cheese and meat.39 Another interesting application is the development of methanol as an alternative to petro-based fuels since it could be produced by the hydrogenation of both carbon monoxide and carbon dioxide (for example, by using bimetallic Cu–ZnO and Pd–Cu catalysts).40
Surface hydrophobicity
It is well known that the affinity between the sample and the solvent affects the resulting hydrolytic degradation behaviour of materials. In this sense water contact angle (WCA) measurements were carried out to further elucidate the occurring degradation mechanism. As illustrated in Fig. 5, an increased surface hydrophobicity with the addition of ZnO from 81.2 ± 3.9° for neat polymer to 90.8 ± 2.4° for 5 wt% nanocomposite has been obtained. This behaviour has been previously reported for different polymer/ZnO nanocomposites.41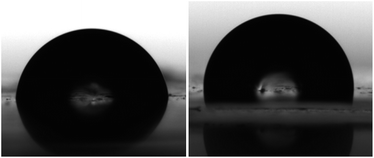 | ||
| Fig. 5 Representative images of a water drop at the surface of neat PLLA (left) and 5 wt% nanocomposite film (right). | ||
Hydrolytic degradation
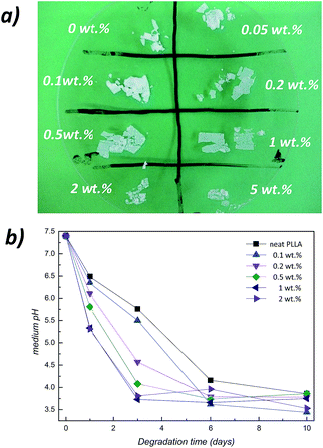
It is well established that polyesters such as poly(L-lactide) undergo their hydrolytic degradation through random-scission of ester linkages.42 Since PLLA could be considered as a heterogeneous material where amorphous and crystalline domains present different molecular mobility,43,44 in order to avoid the effect introduced by the crystalline phases on the resulting hydrolytic degradation of PLLA/ZnO nanocomposites (crystalline phases present an increased resistance to hydrolytic degradation in regard to amorphous ones),42 samples with a crystallinity degree around 11–13% (see corresponding Differential Scanning Calorimetry (DSC) traces in ESI, Fig. S5†) have been submitted to an accelerated hydrolytic degradation at 80 °C in phosphate buffered saline (PBS). Fig. 6a shows the physical aspect of PLLA/ZnO nanocomposites once they were removed from PBS solution (after 24 h at 80 °C) and after being completely dried. It could be observed that nanocomposites containing larger ZnO concentrations undergo physical disintegration to a larger extent than neat PLLA. This fact could be associated with a ZnO-initiated hydrolysis mechanism, in which metallic nanoparticles accelerate the ester-bond hydrolysis of PLLA. To further confirm the catalytic effect of zinc oxide, as shown in Fig. 6b, the pH evolution of the medium for a composition range of 0-2 wt% over 10 days of degradation at 80 °C has been measured (all the nanocomposite films have been immersed with a surface area to volume ratio of 0.2 cm−1 at a starting pH of 7.4). Since the pH decrease over the time is due to the release of acidic by-products that have been expelled to the outside medium during the degradation, the determination of the pH of the medium present in Falcon tubes would allow us to determine the extent of hydrolytic degradation. It could be seen that for all the compositions, after 10 days the pH of the medium decreases from 7.4 up to 3.5–3.8, although this decrease progressively occurs at shorter times when increasing nanoparticle content.For instance, after one day, the pH decreases from 7.4 to 5.6 with the addition of 1 wt% of nanoparticles, while the sample containing neat PLLA present a pH value of 6.5, suggesting that the presence of ZnO accelerates the ester hydrolysis of the PLLA matrix. Moreover, the released acidic products are accumulated in the PBS solution and further autocatalyze the degradation by the generated carboxylic end-groups,45 speeding up the overall degradation kinetic. For instance, after three days the pH difference of the solution containing neat PLLA and its 1 wt% nanocomposite is even larger than that achieved after one day (1.7 vs. 0.7). After the sixth day, all the nanocomposites have been almost completely diffused into the medium, reaching a nearly constant pH value of 3.5–3.9 depending on the ZnO concentration. As reported by Höglund et al.,46 oligomers become water-soluble when the molar mass falls below 1000 g mol−1, which corresponds to 13 repeating LA units.47 Resulting lactic acid could be again easily converted into PLLA, closing the loop towards a greener production of biopolymers.
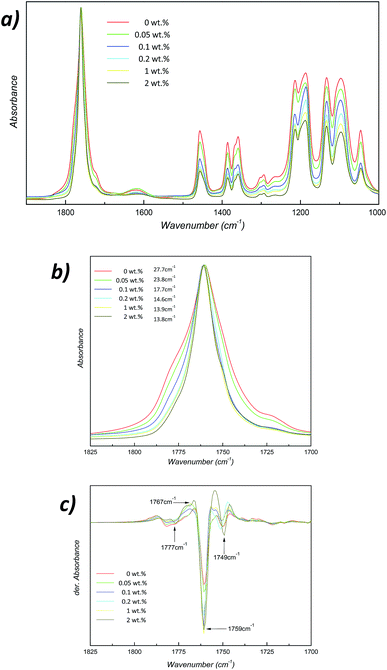
To better understand how this catalytic reaction takes place in PLLA/ZnO nanocomposites, as depicted in Fig. 7a, samples have been analyzed by Fourier transform infrared spectroscopy (FTIR). FTIR spectra have been normalized to the characteristic PLLA carbonyl absorption band located at 1759 cm−1. Although they present similar structures, some differences could be observed in their corresponding FTIR spectra. During the hydrolytic degradation of PLLA/ZnO nanocomposites, as a result of the scission of the main chain ester bonds, shorter chains would be found, yielding more carboxylic acid and alcohol groups per mass sample regarding non-degraded sample. Thus, the relative ratio between the ester bonds and end functional groups, i.e., carboxylic acid/alcohol groups, could indicate the extent of the degradation process. Upon degradation the intensity of –CH stretching (achieved at 2997 cm−1 and 2945 cm−1) and –CO stretching (1268 cm−1) absorption bands decrease as ZnO concentration increases, indicating a reduction on the amount of ester bonds.48,49 A shoulder centred at 1715 cm−1 appears in the case of neat PLLA and its 0.05 wt% nanocomposite, which signifies an increased amount of ester groups in comparison with highly filler nanocomposites.50 In addition, the band centred at 922 cm−1, which corresponds to a combination of CH3 rocking mode of PLLA crystals and C–C backbone notably decreases its intensity as ZnO concentration increases,51 i.e., as degradation further evolves.
As a result of the progressive chain-shortening during hydrolytic degradation, the achieved decrease in molecular entanglement together with increased chain mobility boost the development of highly-ordered crystalline phases.52 More precisely, wide angle X-ray diffraction patterns of hydrolytically degraded nanocomposites (Fig. S6a†) denote a progressive increase on the crystalline fraction in regard with amorphous phase as ZnO concentration increases as denoted by a decrease on the amorphous halo at higher ZnO concentrations. Additionally, DSC results (Fig. S6b†) show lower melting temperature of nanocomposites in presence of zinc oxide together with an increase on the Xc crystallinity degree from 50.1% for neat polylactide to 69.1% for its 5 wt% nanocomposite. Those results are in agreement with obtained FTIR spectra and indicate an accelerated chain-scission of polylactide macromolecules in presence of zinc oxide nanoparticles.
Furthermore, it has been previously demonstrated that the carbonyl (C![[double bond, length as m-dash]](https://www.rsc.org/images/entities/char_e001.gif) O) stretching region of polylactides is highly sensitive to conformational changes.17,53 Although from a theoretical point of view crystallization should not modify the location of absorption bands, their intensity changes because of the induced changes in refractive index and density by new crystalline regions.54 Indeed, the increased molecular order in those ordered/semi-ordered domains results in narrower IR bands located at the same wave-number than the original band.16 Accordingly, as shown in Fig. 7b, the FWHM of the carbonyl band continuously decreases from 27.7 cm−1 in the case of neat PLLA to 13.8 cm−1 for its PLLA/ZnO 2 wt% nanocomposite counterpart. It is worthy to note that, as occurs with the pH values (see Fig. 6b), the main changes are achieved at concentrations up to 1 wt%, suggesting that particle aggregation occurs at larger concentrations that 1 wt%. This fact has been confirmed by FE-SEM micrographs displayed in Fig. 8, where it could be observed that concentrations of 0.5–1 wt% ZnO nanoparticles remain well dispersed within the matrix, whilst nanocomposite containing 5 wt% presents large ZnO aggregates.
O) stretching region of polylactides is highly sensitive to conformational changes.17,53 Although from a theoretical point of view crystallization should not modify the location of absorption bands, their intensity changes because of the induced changes in refractive index and density by new crystalline regions.54 Indeed, the increased molecular order in those ordered/semi-ordered domains results in narrower IR bands located at the same wave-number than the original band.16 Accordingly, as shown in Fig. 7b, the FWHM of the carbonyl band continuously decreases from 27.7 cm−1 in the case of neat PLLA to 13.8 cm−1 for its PLLA/ZnO 2 wt% nanocomposite counterpart. It is worthy to note that, as occurs with the pH values (see Fig. 6b), the main changes are achieved at concentrations up to 1 wt%, suggesting that particle aggregation occurs at larger concentrations that 1 wt%. This fact has been confirmed by FE-SEM micrographs displayed in Fig. 8, where it could be observed that concentrations of 0.5–1 wt% ZnO nanoparticles remain well dispersed within the matrix, whilst nanocomposite containing 5 wt% presents large ZnO aggregates.
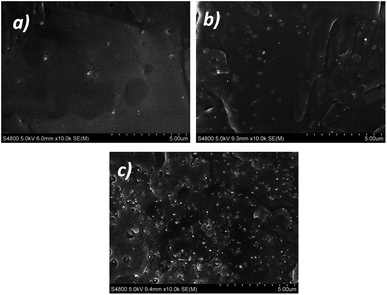 | ||
| Fig. 8 Representative FE-SEM micrographs showing ZnO dispersion in PLLA matrix for concentrations of 0.5 wt% (a), 1 wt% (b) and 5 wt% (c). | ||
It is reported that the splitting in the second derivative of the C![[double bond, length as m-dash]](https://www.rsc.org/images/entities/char_e001.gif) O stretching band of PLLA occurs as a result of ordered phases with different chain conformation. As demonstrated in Fig. 7c, the second derivative for hydrolytically degraded PLLA/ZnO nanocomposites presents four main components, which arise from the presence of four distinct conformations occurring in PLLA known as gauche–gauche (gg), trans–gauche (tg), gauche–trans (gt) and trans–trans conformers, which absorb respectively at 1777, 1767, 1759 and 1749 cm−1.55 It is suggested that the relative areas of those peaks depend on the relative population of the conformers. Thereby, it could be concluded that the fraction concerning to gt conformer (showing a narrow derivative peak) notably increased with the addition of ZnO nanoparticles, together with a decrease in the amount of amorphous gg conformers (absorbance at 1776 cm−1).56 This gt conformer has the lowest energy with a 103 helical chain conformation,57 denoting that PLLA/ZnO nanocomposites crystallize into α crystal form during the hydrolytic degradation. Those data suggest that as ZnO fraction increases, the initially amorphous nanocomposites evolve towards more crystallized materials as a result of the molecular weight reduction. This crystallinity increase ascribed to a molecular weight reduction provides further evidence about the accelerated hydrolytic degradation in presence of ZnO nanoparticles.
O stretching band of PLLA occurs as a result of ordered phases with different chain conformation. As demonstrated in Fig. 7c, the second derivative for hydrolytically degraded PLLA/ZnO nanocomposites presents four main components, which arise from the presence of four distinct conformations occurring in PLLA known as gauche–gauche (gg), trans–gauche (tg), gauche–trans (gt) and trans–trans conformers, which absorb respectively at 1777, 1767, 1759 and 1749 cm−1.55 It is suggested that the relative areas of those peaks depend on the relative population of the conformers. Thereby, it could be concluded that the fraction concerning to gt conformer (showing a narrow derivative peak) notably increased with the addition of ZnO nanoparticles, together with a decrease in the amount of amorphous gg conformers (absorbance at 1776 cm−1).56 This gt conformer has the lowest energy with a 103 helical chain conformation,57 denoting that PLLA/ZnO nanocomposites crystallize into α crystal form during the hydrolytic degradation. Those data suggest that as ZnO fraction increases, the initially amorphous nanocomposites evolve towards more crystallized materials as a result of the molecular weight reduction. This crystallinity increase ascribed to a molecular weight reduction provides further evidence about the accelerated hydrolytic degradation in presence of ZnO nanoparticles.
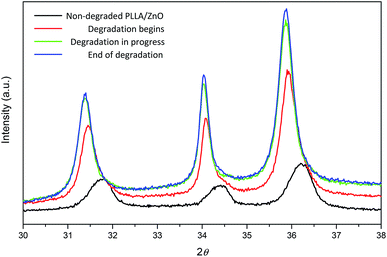
We hypothesize that the degradation reactions are initiated by ZnO nanoparticles. In this sense, wide angle X-ray diffraction experiments have been carried out to investigate the structural changes occurring in ZnO nanoparticles during the degradation of nanocomposites. WAXD patterns of PLLA/ZnO 5 wt% nanocomposite upon degradation are shown in Fig. 9. The reflections corresponding to ZnO (100), (002) and (101) planes of non-degraded nanocomposite show a shoulder (see Fig. S7† for deconvoluted pattern), which has been recently ascribed to the oxygen vacancies present in the lattice.58,59 During the degradation of nanocomposite this shoulder disappears and diffraction peaks are continuously shifted towards lower 2θ angles, denoting a steady increase of the unit cell parameters. This expansion of the unit cell is attributed to a decrease of the residual stress induced by the decrease of oxygen vacancies in the lattice.60
In the light of obtained X-ray diffraction and spectroscopic results arising from both thermal and hydrolytic degradation, and taking into account the increased surface hydrophobicity of nanocomposite films, a model concerning the catalytic mechanism in PLLA/ZnO nanocomposites is proposed in Fig. 10. In overall, it could be concluded that biopolymer degradation is initiated by zinc oxide nanoparticles. Upon thermodegradation ZnO nanoparticles fill their vacancies with O atoms originating from polylactide macromolecules, leading to unzipping depolymerization and intermolecular transesterification reactions as shown in Scheme 1. On the contrary, hydrolytic degradation proceeds when H2O is dissociated on oxygen vacancy sites.61,62 Thus, two hydroxyl groups for each oxygen atom are generated, which initiates the degradation of polymer host by attacking adjacent PLLA chains.
The increased degradation kinetics with ZnO concentration may be explained in terms of polymer/filler interfacial features since the reported catalysis changes are related to the amount of available ZnO surfaces. As zinc oxide concentration raises the formation of vats interfacial regions are enough to boost the overall degradation reaction of bulk PLLA because the occurring reactions at ZnO surfaces. Larger concentrations than 0.5–1 wt% result in an increase of direct contacts between adjacent nanoparticles, leading to the formation of bundles that reduce ZnO–PLLA interfacial area per single nanoparticle, which notably limits the catalyzing effect of ZnO.
Conclusions
In this work PLLA/ZnO nanocomposites with homogeneously dispersed nanoparticles have been prepared. TGA results show that during thermodegradation process of nanocomposites ZnO nanoparticles dramatically lower the thermal degradation temperature by 100 °C, being acetaldehyde and CO2 the main degradation products of neat PLLA and PLLA/ZnO nanocomposites respectively. It is shown that the degradation of the PLLA/ZnO nanocomposites combines unzipping depolymerization and transesterification processes. The accumulation of acidic degradation products in PBS proves that hydrolytic degradation proceeds noticeably faster as ZnO concentration increases. In addition, FTIR spectra demonstrate the presence of shorter polymeric chains when in presence of zinc oxide, with more carboxylic acid groups in comparison to ester groups, suggesting a more marked backbone scission at ester bonds. In addition, according to the splitting in the second derivative of the C![[double bond, length as m-dash]](https://www.rsc.org/images/entities/char_e001.gif) O stretching band, larger crystalline regions are developed as a result of faster hydrolytic degradation as ZnO concentration increases.
O stretching band, larger crystalline regions are developed as a result of faster hydrolytic degradation as ZnO concentration increases.
WAXD experiments demonstrate that the amounts of oxygen vacancies present in the ZnO lattice are reduced upon degradation. We hypothesize that both thermal and hydrolytic degradation are initiated at ZnO surfaces, leading to unzipping depolymerization/intermolecular transesterification reactions upon thermodegradation or dissociated hydroxyls which initiated the hydrolysis of ester bonds during the hydrolytic degradation. Thereby, the lactic acid resulting from the hydrolytic degradation could be again easily converted into PLLA, closing the loop towards a greener production of biopolymers. It is expected that those findings would open new insights in the use of naturally-available materials as efficient catalyst for the recycling of biopolymers towards the development of eco-friendly disposable polymeric waste.
Acknowledgements
E. L. thanks the University of the Basque Country (UPV/EHU) for a postdoctoral fellowship. In addition, we gratefully acknowledge Corbion-Purac for the kind donation of PLLA polymer. Authors thank the Basque Country Government for financial support (Ayudas para apoyar las actividades de los grupos de investigación del sistema universitario vasco, IT718-13).Notes and references
- R. Auras, B. Harte and S. Selke, Macromol. Biosci., 2004, 4, 835–864 CrossRef CAS PubMed.
- R. E. Drumright, P. R. Gruber and D. E. Henton, Adv. Mater., 2000, 12, 1841–1846 CrossRef CAS.
- P. Gruber and M. O'Brien, Polylactides NatureWorks™ PLA, Biopolymers in 10 Volumes, Wiley-VCH, Weinheim, 2002 Search PubMed.
- X. Helan, and Y. Yang, Degradable Polymers and Materials: Principles and Practice, ACS Symposium Series, 2nd edn, 2012 Search PubMed.
- Y. Fan, H. Nishida, T. Mori, Y. Shirai and T. Endo, Polymer, 2004, 45, 1197–1205 CrossRef CAS.
- T. Motoyama, T. Tsukegi, Y. Shirai, H. Nishida and T. Endo, Polym. Degrad. Stab., 2007, 92, 1350–1358 CrossRef CAS.
- J. Huang, X. Xu, C. Gu, W. Wang, B. Geng, Y. Sun and J. Liu, Sens. Actuators, B, 2012, 173, 599–606 CrossRef CAS.
- A. M. Ali, E. A. C. Emanuelsson and D. A. Patterson, Appl. Catal., B, 2010, 97, 168–181 CrossRef CAS.
- R. Wahab, S. K. Tripathy, H. S. Shin, M. Mohapatra, J. Musarrat, A. A. Al-Khedhairy and N. K. Kaushik, Chem. Eng. J., 2013, 226, 154–160 CrossRef CAS.
- B. Cheng and E. T. Samulski, Chem. Commun., 2004, 227, 986–987 RSC.
- F. Werner, J. F. Gnichwitz, R. Marczak, E. Palomares, W. Peukert, A. Hirsch and D. M. Guldi, J. Phys. Chem. B, 2010, 114, 14671–14678 CrossRef CAS PubMed.
- E. Lizundia, L. Ruiz-Rubio, J. L. Vilas and L. M. León, J. Appl. Polym. Sci., 2015, 132, 42426 Search PubMed.
- M. Mathlouthi, Food Packaging and Preservation, Blackie Academic, London 1994 Search PubMed.
- Y. Q. Li, S. Y. Fu and Y. W. Mai, Polymer, 2006, 47, 2127–2132 CrossRef CAS.
- B. M. Novak, Adv. Mater., 1993, 5, 422–433 CrossRef CAS.
- P. C. Painter, M. Coleman and J. L. Koening, Acta Polym., 1983, 34, 66 CrossRef.
- E. Meaurio, I. Martinez de Arenaza, E. Lizundia and J. R. Sarasua, Macromolecules, 2009, 42, 5717–5727 CrossRef CAS.
- J. C. Colmenares, E. Kuna, S. Jakubiak, J. Michalski and K. J. Kurzydłowski, Appl. Catal., B, 2015, 170–171, 273–282 CrossRef CAS.
- P. T. Anastas and J. C. Warner, Green chemistry: theory and practice, Oxford University Press, New York, 1998 Search PubMed.
- H. Schulz and K. H. Thiemann, Solid State Commun., 1979, 32, 783–785 CrossRef CAS.
- A. Larrañaga and J. R. Sarasua, Polym. Degrad. Stab., 2013, 98, 751–758 CrossRef.
- T. Ozawa, J. Therm. Anal. Calorim., 1970, 2, 301–324 CrossRef CAS.
- J. Loosa, T. Schimanski, J. Hofman, T. Peijs and P. J. Lemstr, Polymer, 2001, 42, 3827–3834 CrossRef.
- A. Dasari, Z. Z. Yu and Y. W. Mai, Macromolecules, 2007, 40, 123–130 CrossRef CAS.
- E. Lizundia and J. R. Sarasua, Macromol. Symp., 2012, 321–322, 118–123 CrossRef CAS.
- J. N. Coleman, M. Cadek, K. P. Ryan, A. Fonseca, J. B. Nagy, W. J. Blau and M. S. Ferreira, Polymer, 2006, 47, 8556–8561 CrossRef CAS.
- E. Lizundia, J. L. Vilas and L. M. León, Carbohydr. Polym., 2015, 123, 256–265 CrossRef CAS PubMed.
- D. Cam and M. Marucci, Polymer, 1997, 38, 1879–1884 CrossRef CAS.
- J. Fernandez, A. Etxeberria and J. R. Sarasua, Polym. Degrad. Stab., 2013, 98, 1293–1299 CrossRef CAS.
- H. Abe, N. Takahashi, K. J. Kim, M. Mochizuki and Y. Doi, Biomacromolecules, 2004, 5, 1606–1614 CrossRef CAS PubMed.
- I. C. McNeil and H. A. Leiper, Polym. Degrad. Stab., 1985, 11, 267–285 CrossRef.
- Poly(lactic acid): synthesis, structures, properties, processing, and applications (Wiley Series on Polymer Engineering and Technology), ed. R. Auras, L. T. Lim, S. E. M. Selke and H. Tsuji, New Jersey, John Wiley & Sons, Inc., 2010 Search PubMed.
- Y. Fan, H. Nishida, Y. Shirai and T. Endo, Polym. Degrad. Stab., 2003, 80, 503–511 CrossRef CAS.
- T. A. Saleh, M. A. Gondal, Q. A. Drmosh, Z. H. Yamani and A. Al-Yamani, Chem. Eng. J., 2011, 166, 407–412 CrossRef CAS.
- N. A. Lange and J. A. Dean, Lange's Handbook of Chemistry, McGraw-Hill, 10th edn, 1967 Search PubMed.
- R. H. Petrucci, et al., General Chemistry Principles & Modern Applications, Pearson Prentice Hall, Upper Saddle River, NJ, 9th edn, 2007 Search PubMed.
- E. J. Eilert, Meat Sci., 2005, 71, 122–127 CrossRef PubMed.
- T. P. Labuza, Food Technol., 1996, 50, 68–71 Search PubMed.
- A. Lopez-Rubio, E. Almenar, P. Hernandez-Munoz, J. M. Lagaron, R. Catala and R. R. Gavara, Food Rev. Int., 2004, 20, 357–387 CrossRef CAS.
- X. Jiang, N. Koizumi, X. Guo and C. Song, Appl. Catal., B, 2015, 170–171, 173–185 CrossRef CAS.
- P. Kanmani and J. W. Rhim, Carbohydr. Polym., 2014, 106, 190–199 CrossRef CAS PubMed.
- A. Larrañaga, P. Aldazabal, F. J. Martin and J. R. Sarasua, Polym. Degrad. Stab., 2014, 110, 121–128 CrossRef.
- E. Lizundia, S. Petisco and J. R. Sarasua, J. Mech. Behav. Biomed. Mater., 2013, 17, 242–251 CrossRef CAS PubMed.
- J. Del Rio, A. Etxeberria, N. Lopez-Rodriguez, E. Lizundia and J. R. Sarasua, Macromolecules, 2010, 43, 4698–4707 CrossRef CAS.
- C. G. Pitt, F. I. Chasalow, Y. M. Hibionada, D. M. Klimas and A. J. Schindler, J. Appl. Polym. Sci., 1981, 26, 3779–3787 CrossRef CAS.
- A. Höglund, K. Odelius and A. C. Albertsson, ACS Appl. Mater. Interfaces, 2012, 5, 2788–2793 Search PubMed.
- A. Höglund, M. Hakkarainen, U. Edlund and A. C. Albertsson, Langmuir, 2010, 26, 378–383 CrossRef PubMed.
- J. Coates, Interpretation of Infrared Spectra, A Practical Approach, Encyclopedia of Analytical Chemistry, John Wiley & Sons, 2006 Search PubMed.
- F. Achmad, K. Yamane, S. Quan and T. Kokugan, Chem. Eng. J., 2009, 151, 342–350 CrossRef CAS.
- J. Palacio, V. H. Orozco and B. L. López, J. Braz. Chem. Soc., 2011, 22, 2304–2311 CAS.
- J. M. Zhang, H. Tsuji, I. Noda and Y. Ozaki, Macromolecules, 2004, 37, 6433–6439 CrossRef CAS.
- Y. Gong, Q. Zhou, C. Gao and J. Shen, Acta Biomater., 2007, 3, 531–540 CrossRef CAS PubMed.
- G. Kister, G. Cassanas and M. Vert, Polymer, 1998, 39, 267–273 CrossRef CAS.
- R. G. Snyder, M. Maroncelli, H. L. Strauss and V. M. Hallmark, J. Phys. Chem., 1986, 90, 5623–5630 CrossRef CAS.
- E. Meaurio, E. Zuza, N. Lopez Rodriguez and J. R. Sarasua, J. Phys. Chem. B, 2006, 110, 5790–5800 CrossRef CAS PubMed.
- K. Aou and S. L. Hsu, Macromolecules, 2006, 39, 3337–3344 CrossRef CAS.
- J. Zhang, Y. Duan, H. Sato, H. Tsuji, I. Noda, S. Yan and Y. Ozaki, Macromolecules, 2005, 38, 8012–8021 CrossRef CAS.
- F. Kayaci, S. Vempati, C. Ozgit-Akgun, N. Biyikli and T. Uyar, Appl. Catal., B, 2014, 156–157, 173–183 CrossRef CAS.
- F. Kayaci, S. Vempati, I. Donmez, N. Biyikli and T. Uyar, Nanoscale, 2014, 17, 10224–10234 RSC.
- S. A. Ansari, M. M. Khan, S. Kalathil, A. N. Khan, J. Lee and M. H. Cho, Nanoscale, 2013, 5, 9238–9246 RSC.
- H. Noei, H. Qiu, Y. Wang, E. Löffler, C. Wöll and M. Muhler, Phys. Chem. Chem. Phys., 2008, 10, 7092–7097 RSC.
- M. Qu, H. Tu, M. Amarante, Y. Q. Song and S. S. Zhu, J. Appl. Polym. Sci., 2014, 131, 40287 Search PubMed.
Footnote |
| † Electronic supplementary information (ESI) available. See DOI: 10.1039/c5ra24604k |
| This journal is © The Royal Society of Chemistry 2016 |

