 Open Access Article
Creative Commons Attribution 3.0 Unported Licence
Simpler and highly sensitive enzyme-free sensing of urea via NiO nanostructures modified electrode†
Munazza
Arain
a,
Ayman
Nafady
bc,
Sirajuddin
*d,
Zafar Hussain
Ibupoto
a,
Syed Tufail
Hussain Sherazi
d,
Tayyaba
Shaikh
d,
Hamayun
Khan
e,
Ali
Alsalme
b,
Abdul
Niaz
f and
Magnus
Willander
g
aDr. M. A. Kazi Institute of Chemistry, University of Sindh, Jamshoro, 76080, Pakistan
bDepartment of Chemistry, College of Science, King Saud University, Riyadh, 11451 Saudi Arabia
cChemistry Department, Faculty of Science, Sohag University, Sohag 82524, Egypt
dNational Centre of Excellence in Analytical Chemistry, University of Sindh, Jamshoro, 76080, Pakistan. E-mail: drsiraj03@yahoo.com; Fax: +92 22 9213431; Tel: +92 22 9213429
eDepartment of Chemistry, Islamia College University, Peshawar 25120, KPK, Pakistan
fDepartment of Chemistry, Bannu University of Science and Technology, Khyber Pakhtunkhwa, Pakistan
gDepartment of Science and Technology, Linkoping University, Campus Norrkoping, SE-60174 Norrkoping, Sweden
First published on 6th April 2016
Abstract
In this study, NiO nanostructures were synthesized via a hydrothermal process using ascorbic acid as doping agent in the presence of ammonia. As prepared nanostructures were characterized using Scanning Electron Microscopy (SEM), X-Ray Diffraction (XRD), Brunauer–Emmett–Teller (BET) specific surface area analysis, and thermogravimetric analysis (TGA). These analyses showed that these nanostructures are in the form of cotton-like porous material and crystalline in nature. Furthermore, the average size of these NiO crystallites was estimated to be 3.8 nm. These nanostructures were investigated for their potential to be a highly sensitive and selective enzyme-free sensor for detection of urea after immobilizing on a glassy carbon electrode (GCE) using 0.1% Nafion as binder. The response of this as developed amperometric sensor was linear in the range of 100–1100 μM urea with a R2 value of 0.990 and limit of detection (LOD) of 10 μM. The sensor responded negligibly to various interfering species including glucose, uric acid, and ascorbic acid. This sensor was applied successfully for determining urea in real water samples such as mineral water, tap water, and river water with acceptable recovery.
1. Introduction
Fertilizer plants and animals, as well as human urine, are supposed to be responsible for empowering urea in an aqueous environment.1 A high urea level causes several adverse effects in the body including renal failure, obstruction of urinary tract, bleeding issues in stomach and intestine, dehydration, and shock burns while a low urea level is responsible for nephritic syndrome, cachexia, and hepatic failure.2 Because of its biological and environmental importance, it is critical to investigate urea concentrations in clinical and environmental samples. Several diagnostic methods have been reported regarding urea determination in various types of samples including potentiometry,3,4 piezoelectricity,5 surface plasmon resonance,6 and molecularly imprinted polymer.7,8 All of these methods for urea determinations are faced with certain problems including use of several chemicals, lower sensitivity, limited selectivity, and expensive nature of the material utilized for sensing application.However, these problems have been overcome after investigating the superior catalytic properties of metal oxide nanoparticles, especially those based on electrochemical protocols regarding the oxidation of several oxidizable species at an electrode surface. Although metal oxides nanoparticles have been used as electrochemical sensors for determining several species such as glucose,9,10 hydrazine,11,12 melamine,13etc., so far very little work14–17 has been carried out to utilize the sensing capability of these nanoparticles for urea. In former work,14 metal–metal oxide (nickel/cobalt oxide) nanostructures in association with graphene oxide were used to electrochemically detect urea without the help of urease enzyme and with a limit of detection (LOD) of 5 μM. However, the overall protocol uses a complicated arrangement, consumes several costly chemicals, and has lengthy synthesis procedures and electrode modifications; these make the process extremely expensive. Another report15 about an enzyme-free sensor for urea detection is based on using TiO2 as a sensing material, but the lower sensitivity of the developed sensor is questionable. In the next report,16 zinc oxide nanorods, in combination with urease as a sensing material had a detection limit of 10 μM but the use of enzyme was crucial. Additional reports17–19 also emphasize using urease as an essential component of electrochemical sensors in association with metal oxides. But, all these protocols make these methods costly and/or less sensitive.
In the present strategy we used a vitamin C assisted hydrothermal protocol for the synthesis of porous cotton swab-like NiO nanostructures in the presence of ammonia. Further, these NiO nanostructures were successfully used as a first report based on facile synthesis of the product. These nanostructures exhibit simple and stable immobilization on GCE for extremely sensitive determination of urea without any assistance of urease enzyme as compared to some metal oxide nanostructures described earlier. The sensor is thus quite sensitive, very stable, and more cost effective than previously reported urea sensors. In addition, real samples were successfully analyzed via developed amperometric sensor for urea detection.
2. Experimental
2.1 Reagents and chemicals
All reagents and chemicals (ammonia (33%), nickel nitrate, vitamin C (ascorbic acid), uric acid, glucose, hydrogen peroxide, sodium hydroxide, hydrochloric acid, phosphoric acid, dihydrogen phosphate, and methanol) were Merck quality analytical grade. A stock solution of 1% Nafion (Sigma-Aldrich) was prepared in isopropanol. Other solutions were prepared in deionized water.2.2 Synthesis of NiO nanostructures
As per protocol, 1 g vitamin C, 5 mL ammonia (33%), and 0.1 M nickel nitrate were mixed in 100 mL deionized water and placed in an oven for 4 h at 95 °C. After this, the product was separated by filtration, washed with deionized water several times, and dried. The dried product was put in a furnace for 5 h at 450 °C to complete the conversion of Ni(OH)2 into NiO nanostructures. The final product was analyzed via XRD, SEM, TGA, and BET.2.3 Modification of electrode
The GCE was polished with 0.3 and 0.05 μm alumina powder, respectively. The electrode was further processed by sonication for 5 min each in acetone and deionized water and dried under N2 atmosphere. The cleaned GCE was drop cast with 5 μL NiO solution prepared in methanol and dried. Finally, 5 μL of 0.1% Nafion solution was deposited over the modified electrode in order to adhere the NiO nanostructures (average weight, 0.14 g) to GCE, and then dried. This was used as the working electrode (sensor) for urea determination in combination with Pt wire as the counter electrode and a calomel reference electrode in an electrochemical cell using phosphate buffer as the supporting electrolyte. Amperometry was used as the determining mode for calibration, detection, and interference study to get an Ipvs. time plot, while the cyclic voltammetry was applied for the stability investigation, electrode study, and scan rate study.2.4 Application of developed sensor to real water samples
The performance of the sensor was tested via its use in various samples such as tap water and mineral water by a recovery protocol. The same procedure, with at least 3 replications, was followed regarding detection of urea in real samples and for standard solutions.2.5 Instrumentation
SEM images were recorded via Jeol model JSM 6380 (Japan). XRD patterns were obtained by means of D-8 from Bruker (Germany). TGA data was collected by Diamond TG/DTA, of PerkinElmer (USA), under nitrogen atmosphere. The sample was held for one min at 30 °C and then heated between 30 and 1000 °C by raising the temperature at 15 °C min−1. The surface area of NiO was investigated by nitrogen sorption porosimetry using a Quantachrome NOVA 2200e surface area analyzer (USA) followed by BJH (Barrett, Joyner and Halenda) and BET (Brunauer, Emmett and Teller) techniques.3. Results and discussion
3.1 Characterization of NiO nanostructures
Vitamin C-assisted NiO nanostructures were characterized by SEM and XRD for information regarding to their morphology, size, and crystalline nature. Fig. 1a shows low magnification while Fig. 1b shows high magnification of cotton-like spongy NiO nanostructures. Both images exhibit the porous nature which really reflects its suitability for catalytic performance regarding their application for urea detection (see below).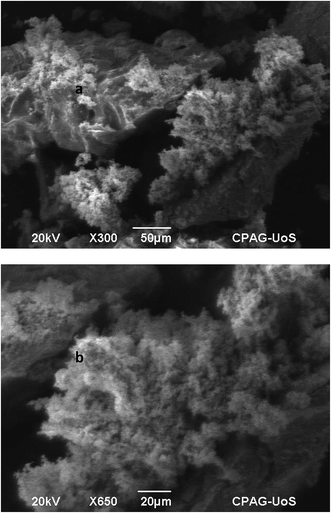 | ||
| Fig. 1 SEM image of vitamin C derived NiO nanostructures with (a) low magnification and (b) high magnification. | ||
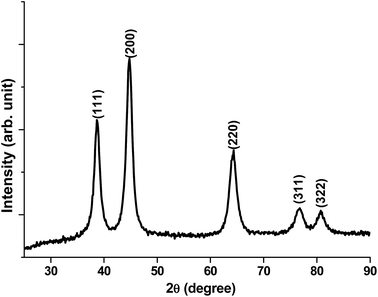
XRD patterns of vitamin C directed NiO nanostructures (Fig. 2) verifies that these structures are associated with the crystalline nature with several planes like 111, 200, 220, 311, and 322.
However, the former 2 planes are most dominant and hence verify that these planes are more dominant crystalline planes for ascorbic acid-derived NiO nanostructures.
The XRD peaks were investigated to determine the size of NiO crystallite using the Scherrer formula:
3.2 TGA and BET characterization of NiO nanostructures
A TGA plot is provided in ESI (Fig. S1†). The temperature range for NiO nanostructures was in the range of 30–1000 °C. The result shows that there was no loss of weight for the tested material which confirms that Ni(OH)2 was completely converted into NiO at the calcination temperature of 450 °C.BET data reveal that NiO porous nanostructures possess the specific surface area of 41 m2 g−1, total pore volume of 0.31 cm3 g−1, and average pore diameter of 74 Å (7.4 nm). The small pore size with the larger surface area of NiO nanostructures plays a key role in the sensitivity of these products towards a specific analyte (urea in this case).
3.3 Application studies
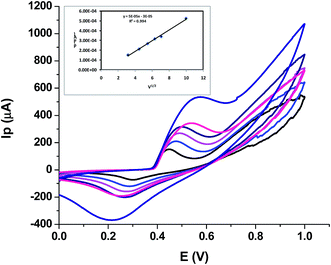 | ||
| Fig. 4 Scan rate effect on peak current, inset showing dependence of peak current on square root of scan rate. | ||
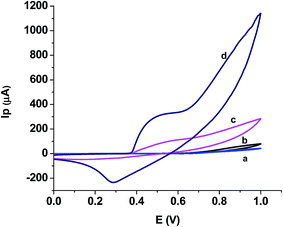
This means that the electrochemical oxidation process is purely diffusion controlled on the NiO–GCE surface.
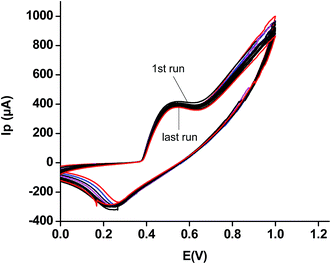 | ||
| Fig. 5 Fourteen repeated CVs of the modified sensor using a 5 mM solution of urea in phosphate buffer, pH of 5.8. | ||
This study justifies the use of the modified electrode for several runs without removing it from electrolytic solution or real samples, as the case may be. It thus verifies the authenticity for its economic importance as compared to several other such sensors.
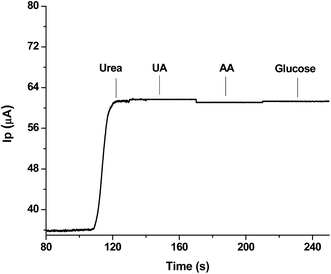 | ||
| Fig. 6 Interference study showing effect of presence of equimolar solutions of possible interfering agents with 1 mM urea as analyte. | ||
It is evident that there is negligible interference from these compounds during the detection of urea; this authenticates the best selectivity of the sensor and it means that the sensor could be suitably used for monitoring urea in real samples.
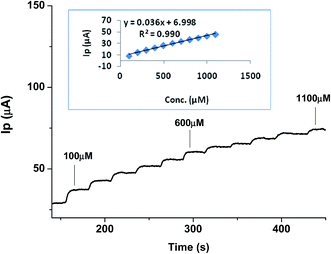 | ||
| Fig. 7 Calibration curve showing Ipvs. time amperometric analysis for various concentrations of urea in the range of 100–1100 μM (inset shows corresponding linear regression plot). | ||
These results verify the extremely sensitive nature of the developed sensor for urea determination and that it could be used with acceptable selectivity in real samples.
In order to further justify the authenticity of the developed sensor, a single electrode was checked for few days with different repeated concentrations of urea solution. Fig. S3A–D† demonstrates these features. The plots show that the same electrode used at day 1, day 4, and day 7 perform nearly similarly. This justifies the developed sensor as a highly valuable tool when compared to other urea sensors.
| Sensing nanomaterial | Electrochemical method | Detection limits | Type | Reference |
|---|---|---|---|---|
| a CH, chitosan; NRs, nanorods; 3D, 3-dimensional; PVA, polyvinyl alcohol. | ||||
| ZnO–PVA | EIS | 30 mM | Urease based | 2 |
| NiCo2O4/3D graphene | Chronoamperometry | 5 μM | Enzyme-less | 14 |
| Nano-tin oxide | CV | 0.6 mM | Enzyme-less | 15 |
| ZnO NRs | CV | 10 μM | Urease based | 16 |
| TiO2/Er2O3 | EIS | 3 mM | Urease based | 17 |
| CH–Fe3O4/TiO2 | DPV | 5 mM | Urease based | 19 |
| Vitamin C based NiO | Amperometry | 10 μM | Enzyme-less | Present work |
It is evident that most of the sensors16–19 rely on using urease enzyme as an integral part of the sensing material. Such an arrangement makes the resulting method complicated and extremely expensive, and hence difficult to be afforded by a poor public, especially those in less developed and developing countries. Two enzyme-free sensors14,15 described in the literature are associated with some drawbacks. The non-enzymatic sensor14 is, however, very sensitive but associated with complicated multistep procedures for synthesis and modification of the electrode and extremely time consuming. In addition, fabrication of this sensor needs several chemicals which are expensive and/or environmentally unfriendly; these make this sensor somewhat impractical from economical, time consumption, and environmental points of view. A second sensor15 is, however, simpler but lacks greater sensitivity. In comparison to all these, our reported ascorbic acid-assisted NiO nanostructure-based amperometric sensor is highly sensitive, stable, and quite economical; these qualities distinguish it from all urea sensors reported so far.
In order to justify the superiority of our developed enzyme-free urea sensor over other conventional (especially urease based) sensors, it is essential to compare the merits and/or demerits associated with each type of sensor. It is true that enzyme-based sensors are associated with selectivity and sensitivity,21 however, they possess a number of demerits such as lack of chemical and heat stability, loss of activity, intolerance to extreme acidic and basic conditions,22 and deactivation by toxic chemicals and humidity.23 In addition, such sensors are expensive in terms of cost of enzyme, need specific conditions for storage, and are associated with time consuming protocols. In contrast to enzyme-based sensors, our NiO-based urea sensor is not only more highly selective and extremely sensitive than most of the urease-based sensors, but also inherits several advantageous properties such as stability at ambient conditions of pH and temperature, reproducible nature, simpler fabrication protocol, rapid response, and no need of storage under controlled parameters. The most dominant advantage of the NiO-based sensor is its cost effective nature as compared to the expensive aspect of enzyme-based sensors. All these qualities provide a clear edge for the currently developed NiO-based urea sensor over urease enzyme based sensors.
| Sample | Urea added (μM) | Urea recovered (μM) | Recovery (%) |
|---|---|---|---|
| a ±, standard deviation for 3 replications. | |||
| Mineral water | 500 | 501.2 ± 1.2 | 100.2 |
| River water | 500 | 511.7 ± 1.8 | 102.3 |
| Tap water | 500 | 492.3 ± 2.1 | 98.5 |
Recoveries of 98.5–102.2% verify the suitability of the developed enzyme-free urea sensor in real samples where the presence of various impurities has negligible effect on the authenticity of the method. In view of these results, we can extend the use of this sensor for urea determination in biological samples such as urine and serum in order to investigate the adverse conditions associated with increase or decrease of urea in these matrices.
4. Conclusion
The ascorbic acid-based formation of NiO nanostructures via a hydrothermal precipitation method is a facile and green approach. The cotton-like porous NiO nanostructures are associated with large surface area, small pore size, and extremely small particle size. These properties are crucial for catalytic electron transfer during a sensing study. The application of these nanostructures for developing a highly sensitive, simpler, selective, and stable urea sensor without using any urease enzyme has a clear edge over other sensors reported so far. The newly prepared sensor needs no specific storage conditions and is capable of performing under ambient conditions. These advantages make the sensor a highly cost effective tool for urea analysis in various types of real water samples that could be equally extended for use in biological as well as industrial samples with negligible interference from existing ions, radicals, or other compounds. The sensor is equally suitable for application in biological samples such as blood, urine, and duodenal fluids.Acknowledgements
We extend our sincere appreciations and gratitude to Deanship of Scientific Research group at King Saud University for provision of fund to this project by their Prolific Research Group (PRG-1437-30).References
- F. Guo, K. Ye, K. Cheng, G. Wang and D. Cao, J. Power Sources, 2015, 278, 562–568 CrossRef CAS.
- A. Kaushika, P. R. Solanki, A. A. Ansari, G. Sumana, S. Ahmad and B. D. Malhotra, Sens. Actuators, B, 2009, 138, 572–580 CrossRef.
- C. C. Buron, M. Quinart, T. Vrlinic, S. Yunus, K. Glinel, A. M. Jonas and B. Lakard, Electrochim. Acta, 2014, 148, 53–61 CrossRef CAS.
- D. P. A. Correia, J. M. C. S. Magalhaes and A. A. S. C. Machado, Talanta, 2005, 67, 773–782 CrossRef CAS PubMed.
- Z.-P. Yang, X. Liu, C.-J. Zhang and B.-Z. Liu, Biosens. Bioelectron., 2015, 74, 85–90 CrossRef CAS PubMed.
- P. Bhatia and B. D. Gupta, Sens. Actuators, B, 2012, 161, 434–438 CrossRef CAS.
- T. Alizadeh and A. Akbari, Biosens. Bioelectron., 2013, 43, 321–327 CrossRef PubMed.
- B. Khadro, C. Sanglar, A. Bonhomme, A. Errachid and N. Jaffrezic-Renault, Procedia Eng., 2010, 5, 371–374 CrossRef CAS.
- Z. H. Ibupoto, A. Nafady, R. A. Soomro, Sirajuddin, S. T. H. Sherazi, M. I. Abro and M. Willander, RSC Adv., 2015, 5, 18773–18781 CAS.
- R. A. Soomro, A. Nafady, Z. H. Ibupoto, Sirajuddin, S. T. H. Sherazi, M. Willander and M. I. Abro, Mater. Sci. Semicond. Process., 2015, 34, 373–381 CrossRef CAS.
- S. Shukla, S. Chaudhary, A. Umar, G. R. Chaudhary and S. K. Mehta, Sens. Actuators, B, 2014, 196, 231–237 CrossRef CAS.
- B. Zhou, J. Yang and X. Jiang, Mater. Lett., 2015, 159, 362–365 CrossRef CAS.
- R. A. Soomro, K. R. Hallam, Z. H. Ibupoto, A. Tahira, S. Jawaid, S. T. H. Sherazi, Sirajuddin and M. Willander, RSC Adv., 2016, 5, 105090–105097 RSC.
- N. S. Nguyen, G. Das and H. H. Yoon, Biosens. Bioelectron., 2016, 77, 372–377 CrossRef CAS PubMed.
- S. G. Ansari, H. Fouad, H.-S. Shin and Z. A. Ansari, Chem.-Biol. Interact., 2015, 242, 45–49 CrossRef CAS PubMed.
- R. Ahmad, N. Tripathy and Y.-D. Hahn, Sens. Actuators, B, 2014, 194, 290–295 CrossRef CAS.
- T.-M. Pan and J.-C. Lin, Sens. Actuators, B, 2009, 138, 474–479 CrossRef CAS.
- R. Rahmanian and S. A. Mozaffari, Sens. Actuators, B, 2015, 207, 772–781 CrossRef CAS.
- A. Kaushik, P. R. Solanki, A. A. Ansari, G. Sumana, S. Ahmad and B. D. Malhotra, Sens. Actuators, B, 2009, 138, 572–580 CrossRef CAS.
- R. A. Soomro, A. Nafady, Sirajuddin, N. Memon, T. H. Sherazi and N. H. Kalwar, Talanta, 2014, 130, 415–422 CrossRef CAS PubMed.
- J. Wang, Chem. Rev., 2008, 108, 814–825 CrossRef CAS PubMed.
- I. Katakis and E. Domínguez, TrAC, Trends Anal. Chem., 1995, 14, 310–319 CAS.
- R. Wilson and A. P. F. Turner, Biosens. Bioelectron., 1992, 7, 165–185 CrossRef CAS.
Footnote |
| † Electronic supplementary information (ESI) available. See DOI: 10.1039/c6ra00521g |
| This journal is © The Royal Society of Chemistry 2016 |

