
Synthesis and characterization of aromatic poly(ether-imide)s based on bis(4-(3,4-dicarboxyphenoxy)phenyl)-R,R-silane anhydrides (R = Me, Ph) – spontaneous formation of surface micropores from THF solutions
Claudio A. Terraza*a,
Luis. H. Taglea,
Alain Tundidor-Cambaa,
Carmen M. González-Henríquezb,
Mauricio A. Sarabia-Vallejosc and
Deysma Colla
aFacultad de Química, Pontificia Universidad Católica de Chile, P.O. Box 306, Correo 22, Santiago, Chile. E-mail: cterraza@uc.cl
bFacultad de Ciencias Naturales, Matemáticas y del Medio Ambiente, Departamento de Química and Programa Institucional de Fomento a la Investigación, Desarrollo e Innovación Universidad Tecnológica Metropolitana, P.O. Box 9845, Correo 21, Santiago, Chile
cInstituto de Física, Pontificia Universidad Católica de Chile, Av. Vicuña Mackenna 4860, Santiago, Chile
First published on 12th May 2016
Abstract
Two new aromatic dianhydride monomers containing R,R-diphenylsilane (R = Me or Ph), an ether group and an isobenzofuran-1,3-dione moiety in their structure were prepared and spectroscopically characterized. They were reacted with two silylated aromatic diamines, previously reported, in order to prepare four different aromatic poly(ether-imide)s (PEIs). High yields were obtained for the synthesis of these polymers with an inherent viscosity range between 0.10 and 0.27 dL g−1, corresponding to a viscosimetric average molecular weight (Mv) from 1740 to 9520. PEIs were soluble in a variety of polar aprotic solvents. The thermal decomposition temperatures measured varied between 473 and 526 °C and the glass transition temperature values obtained varied from 164 to 184 °C. All poly(ether-imide)s were transparent in the UV-visible region. Additionally, films of these polymers were prepared by deposition of a solution through a spin coating technique; this process induces a spontaneous micropore formation on the film surface by means of quasi-instantaneous solvent evaporation. The solid samples were morphologically characterized by Field Emission Scanning Electron Microscopy (FE-SEM) and Atomic Force Microscopy (AFM). Thus, shape, distribution and dimensions (diameter and height) of the pores were studied. These parameters varied in agreement with the specific polymer characteristics: molecular weight, solubility and the nature of the R groups inserted into the molecule (phenyl group presence produces larger and deeper pores), among others.
Introduction
Aromatic poly(imide)s (PIs) are considered as excellent materials for several technological applications due to their relevant thermal, mechanical and chemical stability.1–3 However, fully aromatic poly(imide)s are insoluble in most common organic solvents and possess high glass transition temperatures, which strongly limits their industrial processability.4,5Researchers have been making many efforts to overcome this drawback; the introduction of flexible linkages (–O–, –SO2–, –CH2–, –Si(R1R2)–), incorporation of bulky side groups or the use of meta-substitution moieties are some of the structural modifications commonly employed. These modifications transform the original material into new polymers with high malleability and low stiffness, which are associated with lower Tg values.6–10 Also, these structural changes increase the transparency in the UV-visible region giving eventual application in the optics field.11–13
On the other hand, silicon-containing polymers have been extensively developed for variable applications due to their characteristic high solubility, high thermal and oxidative stability, flame and moisture resistance and good adhesion onto semiconductor substrates.14–19 Bruma et al.20 have described that the introduction of a silarylene group [–PhSi(R1R2)Ph–] in the main chain leads to improved solubility without loss of thermal properties. These properties can be explained by the lower electronegativity of the silicon atom than that of carbon, causing a small dipole moment inside the chain, which increases its polarity and therefore, its solubility in specific polar solvents. Also, the difference in electronegativity between these atoms increases the thermal stability of the final silylated polymer.21,22 From this point view, the preparation and characterization of new silylated-aromatic polymers that incorporate structural details in their repetitive units, which allows to modify the normal properties of this kind materials, is a field of interest both in basic and applied chemistry.
This work describes the synthesis and spectroscopic characterization of two aromatic dianhydrides containing dimethylsilane (–Si(CH3)2–) or diphenylsilane (–Si(Ph)2–) units and oxy-ether bonds. These monomers were reacted with two silylated-aromatic diamines, previously reported, which had the same structural modifications than dianhydrides on the silicon atom and also incorporate oxy-ether bonds as flexibilizing moieties. From these monomers, four silylated aromatic poly(ether-imide)s (PEIs) were synthesized, where the groups bonded to silicon atoms show different sizes. Thus, the free volume of the chains and their interactions are dependent on these modifications and therefore also their properties. The incorporation of ether bonds as flexible moieties inside the polymeric structure is an important element, which intends to help to modulate some properties and therefore the possible applications of the materials. The characterization of these PEIs was made in terms of their spectroscopic, physical, thermal and optical features. Additionally, microporous films were prepared and then characterized. Texture and morphology of the polymer films were characterized by AFM and FE-SEM. The simplicity of this process makes it an attractive option to generate porous structures from an adequate polymeric solution. Future studies will be focused on the control of pore dimensions (diameter, depth, etc.) and shape through the solvent manipulation, polymeric concentration, specific polymer structure and deposition parameters.
Experimental part
Materials
Anhydrous N,N-dimethylformamide (DMF), anhydrous N,N-dimethylacetamide (DMAc), anhydrous K2CO3, 4-nitrophthalonitrile, potassium hydroxide, pyridine, glacial acetic acid and acetic anhydride were obtained from Aldrich Chemical (Milwaukee, WI). Bis(4-hydroxyphenyl)dimethylsilane (1), bis(4-hydroxyphenyl)diphenylsilane (2), bis(4-(4-(aminophenoxy)phenyl)dimethylsilane) (3) and bis(4-(4-(aminophenoxy)phenyl)diphenylsilane) (4) were synthesized previously.7,23,24 All other reagents and solvents were purchased commercially as analytical-grade and used without further purification.Measurements
IR-FT spectra (KBr pellets) were recorded on a Perkin-Elmer 1310 spectrophotometer over the range 4000–450 cm−1. 1H, 13C and 29Si NMR spectra were carried out on a 400 MHz instrument (Bruker AC-200) using CDCl3, DMSO-d6 or acetone-d6 as solvent and TMS as internal standard. Viscosimetric measurements were made in a Desreux–Bischof type dilution viscosimeter at 25 °C (c = 0.5 g dL−1). Tg values were obtained with a Mettler-Toledo DSC 821 calorimetric system (10 °C min−1 under N2 flow) in the second heating scan. Thermogravimetric analyses were carried out in a Mettler-Toledo, TA-3000 calorimetric system equipped with a TC-10A processor and a TG-50 thermobalance with a MT5 microbalance. Samples of 6–10 mg were placed in an alumina crucible, the thermogravimetric measurements were carried out between 25 °C and 900 °C with a heating rate of 10 °C min−1 under N2 flow. Elemental analyses were made on a Fisons EA 1108-CHNS-O equipment. The UV-visible optical transmission spectra were obtained on a UV-3101PC UV-vis-NIR scanning spectrophotometer (Shimadzu) at room temperature using solutions of NMP (c = 0.5 g L−1). Weight-average molecular weight (Mw), number-average molecular weight (Mn) and polydispersity index (Mw/Mn) were determined by size exclusion chromatography (SEC) using a PerkinElmer Series 200 pump equipped with oven and UV-vis detector. The wavelength used for analysis was 271 nm, the oven temperature was 70 °C and the solvent flow was 0.3 mL min−1. Poly(ethylene glycol) standards were used as references. The polymeric solution was prepared using 5 mg of sample and 1 mL of a DMF with 0.1% BrLi solution. Micrographies were obtained with a FEI Inspect F50 STEM scanning electron microscope using a voltage of 5.0 kV for electronic acceleration and an Everhart–Thornley detector, at different magnifications (12.000×, 25.000× and 50.000×). An argon sputter coater (Cressington, 108 AUTO) coupled with a high-resolution film thickness monitor (Cressington, MTM-20), using a rotary tilting stage (with 90 rpm frequency), was use to deposit a thin layer of gold (3.6 ± 0.01 nm) over the polymer film in order to prevent electronic over-charge effects during FE-SEM measurements (this effect reduces their resolution). Morphological analysis was developed using an AFM model Innova from Bruker. Hence, a rectangular cantilever with nominal resonance frequency of 300 kHz and spring constant of 40 N m−1 (Model RTESPA-CP, Bruker) was used for the measurements. Images obtained qualitatively and quantitatively were analysed using off-line software package (Gwyddion)25 for the corresponding analyses. The images were taken within areas of 20 × 20 μm2; 10 × 10 μm2 and 5 × 5 μm2. The same tip was employed for all the samples in order to avoid tip-shape associated errors. Polymer homogeneous films were prepared using a KW-4A spin coater (Chemat Scientific) over copper plates of ≈10 × 10 mm2 with controlled velocity rates and deposition time. An oil free vacuum pump Rocker-Chemker 410 was used to maintain the sample fixed during the deposition process.Precursors and monomers synthesis

Bis(4-(3,4-dicyanophenoxy)phenyl)dimethylsilane (5). Yield: 87%. Mp 89–91 °C. IR (KBr, ν, cm−1): 3079 (C–H arom.); 2956 (C–H aliph.); 2232 (CN); 1602, 1583, 1562 (C
![[double bond, length as m-dash]](https://www.rsc.org/images/entities/char_e001.gif) C); 1419, 1107 (Si–C arom.); 1310 (Si–C aliph.); 1250 (C–O–C); 885, 810 (arom. 1,2,4 subst.); 833 (arom. p-subst.). 1H NMR (DMSO-d6, δ, ppm): 7.74 (d, J = 8.6 Hz, 2H(6)); 7.46 (s, 2H(3)); 7.30 (d, J = 7.5 Hz, 4H(9)); 7.05 (m, 2H(5)); 6.85 (d, J = 7.4 Hz, 4H(8)); 0.23 (s, 6H(13)). 13C NMR (DMSO-d6, δ, ppm): −3.4 (C13), 107.6 (C1), 114.5 (C12), 115.0 (C11), 115.9 (C2), 118.7 (C8), 121.5 (C3), 122.1 (C5), 134.0 (C10), 134.4 (C6), 135.5 (C9), 154.1 (C7), 159.7 (C4). 29Si NMR (DMSO-d6, δ, ppm): −8.67. Elem. anal. calcd for C30H20N4O2Si; (496.59): C, 72.56%; H, 4.06%, N, 11.28%. Found: C, 72.21%; H, 4.16%, N, 11.08%.
C); 1419, 1107 (Si–C arom.); 1310 (Si–C aliph.); 1250 (C–O–C); 885, 810 (arom. 1,2,4 subst.); 833 (arom. p-subst.). 1H NMR (DMSO-d6, δ, ppm): 7.74 (d, J = 8.6 Hz, 2H(6)); 7.46 (s, 2H(3)); 7.30 (d, J = 7.5 Hz, 4H(9)); 7.05 (m, 2H(5)); 6.85 (d, J = 7.4 Hz, 4H(8)); 0.23 (s, 6H(13)). 13C NMR (DMSO-d6, δ, ppm): −3.4 (C13), 107.6 (C1), 114.5 (C12), 115.0 (C11), 115.9 (C2), 118.7 (C8), 121.5 (C3), 122.1 (C5), 134.0 (C10), 134.4 (C6), 135.5 (C9), 154.1 (C7), 159.7 (C4). 29Si NMR (DMSO-d6, δ, ppm): −8.67. Elem. anal. calcd for C30H20N4O2Si; (496.59): C, 72.56%; H, 4.06%, N, 11.28%. Found: C, 72.21%; H, 4.16%, N, 11.08%.
Bis(4-(3,4-dicyanophenoxy)phenyl)diphenylsilane (6). Yield: 89%. Mp 91–93 °C. IR (KBr, ν, cm−1): 3067, 3024 (C–H arom.); 2231 (CN); 1602, 1582, 1562, 1486 (C
C); 1427, 1109 (Si–C arom.); 1250 (C–O–C); 829 (arom. p-subst.); 885, 831 (arom. 1,2,4 subst.); 744, 702 (arom. mono-subst.). 1H NMR (DMSO-d6, δ, ppm): 8.13 (d, J = 8.7 Hz, 2H(6)); 7.91 (d, J = 2.5 Hz, 2H(3)); 7.61 (d, J = 8.4, 4H(9)); 7.51 (m, 12H(5,15,16,17)); 7.28 (d, J = 8.4 Hz, 4H(8)). 13C NMR (DMSO-d6, δ, ppm): 109.0 (C1), 115.7 (C11), 116.2 (C12), 117.1 (C2), 120.0 (C8), 123.1 (C3), 123.6 (C5), 128.6 (C10), 130.6 (C16), 133.4 (C17), 136.2 (C9), 136.6 (C14), 136.8 (C6), 138.5 (C15), 156.0 (C7), 160.6 (C4). 29Si NMR (DMSO-d6, δ, ppm): −14.83. Elem. anal. calcd for C40H24N4O2Si; (620.73): C, 77.40%; H, 3.90%, N, 9.03%. Found: C, 77.22%; H, 3.75%, N, 8.98%.
![[thin space (1/6-em)]](https://www.rsc.org/images/entities/char_2009.gif) :1 vol/vol). The suspension was refluxed during two days until the evolution of ammonia ceased. The solution was filtered and the ethanol distilled under reduced pressure. Then, the solution was diluted with 50 mL of water and acidified by a HCl 20% solutions until pH 2–3. The precipitate was collected by filtration, washed thoroughly with water and dried.
:1 vol/vol). The suspension was refluxed during two days until the evolution of ammonia ceased. The solution was filtered and the ethanol distilled under reduced pressure. Then, the solution was diluted with 50 mL of water and acidified by a HCl 20% solutions until pH 2–3. The precipitate was collected by filtration, washed thoroughly with water and dried.
Bis(4-(3,4-dicarboxyphenoxy)phenyl)dimethylsilane (7). Yield: 85%. Mp > 300 °C. IR (KBr, ν, cm−1): 3425 (OH); 3023 (C–H arom.); 2955 (C–H aliph.); 1709 (C
O); 1605, 1577, 1495 (CC); 1421, 1108 (Si–C arom.); 1389 (Si–C aliph.); 1231 (C–O–C); 895, 811 (arom. 1,2,4 subst.); 833 (arom. p-subst.). 1H NMR (DMSO-d6, δ, ppm): 7.84 (d, J = 8.6 Hz, 2H(6)), 7.37 (d, J = 8.0 Hz, 4H(9)), 7.29 (d, J = 2.2 Hz, 2H(3)), 6.94 (dd, J = 2.3, 8.6 Hz, 2H(5)), 6.88 (d, J = 8.1 Hz, 4H(8)), 0.33 (s, 6H(13)). 13C NMR (DMSO-d6, δ, ppm): −2.5 (C13), 118.9 (C8), 119.4 (C6), 119.5 (C3), 128.1 (C5), 133.3 (C1), 133.8 (C10), 136.0 (C9), 137.1 (C2), 156.4 (C7), 158.3 (C4), 167.4 (C11), 167.8 (C12). 29Si NMR (DMSO-d6, δ, ppm): −8.08. Elem. anal. calcd for C30H24O10Si; (572.59): C, 62.93%; H, 4.22%. Found: C, 62.85%; H, 4.15%.
Bis(4-(3,4-dicarboxyphenoxy)phenyl)diphenylsilane (8). Yield: 77%. Mp > 300 °C. IR (KBr, ν, cm−1): 3431 (OH); 3068, 3019 (C–H arom.); 1708 (C
O); 1604, 1578, 1494 (CC); 1427, 1108 (Si–C arom.); 1231 (C–O–C); 887, 829 (arom. 1,2,4 subst.); 829 (arom. p-subst.); 743, 703 (arom. mono-subst.). 1H NMR (DMSO-d6, δ, ppm): 14.30 (s, 4H(11,12)), 7.93 (d, J = 8.4 Hz, 2H(6)), 7.52 (m, 20H(3,8,9,15,16,17)), 7.20 (d, J = 8.4 Hz, 2H(5)). 13C NMR (DMSO-d6, δ, ppm): 119.3 (C6), 120.0 (C3), 128.6 (C8), 129.2 (C5), 130.3 (C1), 130.7 (10), 133.0 (16), 133.7 (C17), 134.8 (C9), 136.1 (C2), 137.2 (C14), 138.3 (C15), 157.4 (C7), 158.5 (C4), 167.8 (C11), 168.4 (C12). 29Si NMR (DMSO-d6, δ, ppm): −14.90. Elem. anal. calcd for C40H28O10Si; (696.73): C, 68.95%; H, 4.05%. Found: C, 68.78%; H, 4.25%.

Bis(4-(3,4-dicarboxyphenoxy)phenyl)dimethylsilane anhydride (9). Yield: 42%. Mp 149–152 °C. IR (KBr, ν, cm−1): 3021 (C–H arom.); 2954 (C–H aliph.); 1848, 1780 (C
O); 1618, 1585, 1480 (CC); 1418, 1019 (Si–C arom.); 1385 (Si–C aliph.); 1283 (C–O–C); 876, 807 (arom. 1,2,4 subst.); 836 (arom. p-subst.). 1H NMR (DMSO-d6, δ, ppm): 8.08 (d, J = 8.3 Hz, 2H(6)), 7.69 (d, J = 8.5 Hz, 4H(9)), 7.53 (dd, J = 8.3, 2.2 Hz, 2H(5)), 7.49 (d, J = 2.2 Hz, 2H(3)), 7.23 (d, J = 8.5 Hz, 4H(8)), 0.61 (s, 6H(13)). 13C NMR (DMSO-d6, δ, ppm): −3.0 (C13), 112.6 (C6), 119.3 (C8), 124.3 (C3), 124.5 (C5), 127.5 (C1), 133.6 (C2), 134.4 (C10), 135.9 (C9), 154.9 (C7), 162.0 (C4), 162.1 (C11), 163.0 (C12). 29Si NMR (DMSO-d6, δ, ppm): −7.98. Elem. anal. calcd for C30H20O8Si; (536.56): C, 67.15%; H, 3.76%. Found: C, 67.08%; H, 3.68%.
Bis(4-(3,4-dicarboxyphenoxy)phenyl)diphenylsilane anhydride (10). Yield: 62%. Mp 150–155 °C. IR (KBr, ν, cm−1): 3070 (C–H arom.); 1851, 1777 (C
O); 1618, 1585, 1480 (CC); 1428, 1016 (Si–C arom.); 1281 (C–O–C); 892 (arom. p-subst.); 889, 833 (arom. 1,2,4 subst.); 740, 705 (arom. mono-subst.). 1H NMR (DMSO-d6, δ, ppm): 8.09 (d, J = 9.1 Hz, 2H(6)), 7.56 (d, J = 8.5 Hz, 4H(9)); 7.46 (m, 14H(3,5,15,16,17)), 7.29 (d, J = 8.5 Hz, 4H(8)). 13C NMR (DMSO-d6, δ, ppm): 113.4 (C6), 119.7 (C8), 125.1 (C3), 127.8 (C5), 128.2 (C1), 130.0 (C10), 130.2 (C2), 133.0 (C16), 134.0 (C9), 134.4 (C14), 135.7 (C15), 138.2 (C17), 156.0 (C7), 162.4 (C4), 162.5 (C11), 163.0 (C12). 29Si NMR (DMSO-d6, δ, ppm): −14.80. Elem. anal. calcd for C40H24O8Si; (660.70): C, 72.72%; H, 3.66%. Found: C, 72.68%; H, 3.56%.
Poly(ether-imide)s synthesis
A typical polymerization procedure for the synthesis of poly(ether-imide)s was as follows. A mixture of 0.37 mmol of the corresponding silylated aromatic-diamine (3 or 4), 0.37 mmol of the corresponding dianhydride (9 or 10) and 0.8 mL of DMAc was stirred at room temperature during 6 hours. Then, 0.2 mL of acetic anhydride and 0.15 mL of pyridine were added and the mixture was stirred for two hours at room temperature and then during 1 hour at 60 °C. The mixture was cooled and poured in 300 mL of water with stirring. The white solid was filtered, purified by re-precipitation from a dimethyl sulfoxide solution in water and then washed thoroughly with methanol and dried at 100 °C during 12 hours. O); 1585, 1506, 1493, 1477 (CC); 1444, 1106 (Si–C arom.); 1307 (Si–C aliph); 1235 (C–O–C); 877, 809 (arom. 1,2,4 subst.); 808 (arom. p-subst.). 1H NMR (DMSO-d6, δ, ppm): 7.94 (m, 2H(6)); 7.54 (m, 18H(3,9,19,23,24)); 7.12 (m, 10H(5,8,20)); 0.58 (s, 6H(13)); 0.52 (s, 6H(26)). 13C NMR (DMSO-d6, δ, ppm): 165.8 (C12); 165.6 (C11); 161.7 (C4); 156.8 (C22); 155.4 (C7); 155.3 (C21); 135.7 (C9); 135.3 (C24); 133.7 (C10); 133.6 (C25); 132.0 (C2); 128.4 (C5); 126.5 (C1); 125.3 (C18); 125.0 (C6); 122.7 (C19); 118.9 (C20); 118.3 (C8), 117.7 (C23); 111.4 (C3); −2.9 (C13); −3.0 (C26). 29Si NMR (DMSO-d6, δ, ppm): −8.63. Elem. anal. calcd for [C56H42N2O8Si2]n (927.11)n, C, 72.55%; H, 4.57%; N, 3.02%. Found: C, 72.10%; H, 4.32%; N, 2.95%.O); 1585, 1506, 1493, 1477 (CC); 1429, 1106 (Si–C arom.); 1307 (Si–C aliph); 1236 (C–O–C); 878, 813 (arom. 1,2,4 subst.); 810 (arom. p-subst.); 742, 700 (arom. mono-subst.). 1H NMR (DMSO-d6, δ, ppm): 7.92 (m, 2H(6)); 7.50 (m, 28H(3,9,19,23,24,28,29,30)); 7.13 (m, 10H(5,8,20)); 0.56 (s, 6H(13)). 13C NMR (DMSO-d6, δ, ppm): 166.2 (C12); 166.1 (C11); 162.1 (C4); 157.9 (C22); 155.8 (C7); 155.3 (C21); 137.7 (C9); 136.1 (C24); 135.6 (C28); 134.4 (C10); 134.2 (C27); 134.1 (C2); 133.5 (C1); 129.7 (C30); 128.9 (C29); 128.0 (C5); 127.9 (C18); 127.2 (C25); 125.7 (C6); 123.1 (C19); 119.3 (C20); 119.2 (C23), 118.1 (C8); 111.9 (C3); −2.5 (C26). 29Si NMR (DMSO-d6, δ, ppm): −7.80y − 14.70. Elem. anal. calcd for [C66H46N2O8Si2]n (1050.28)n, C, 75.41%; H, 4.41%; N, 2.66%. Found: C, 74.87%; H, 4.12%; N, 2.53%.O); 1585, 1506, 1493, 1477 (CC); 1429, 1106 (Si–C arom.); 1307 (Si–C aliph); 1236 (C–O–C); 875, 812 (arom. 1,2,4 subst.); 810 (arom. p-subst.); 743, 700 (arom. mono-subst.). 1H NMR (DMSO-d6, δ, ppm): 7.97 (m, 2H(6)); 7.52 (m, 24H(3,9,15,17,19,23,24)); 7.15 (m, 14H(5,8,16,20)); 0.52 (s, 6H(26)). 13C NMR (DMSO-d6, δ, ppm): 165.8 (C12); 165.6 (C11); 161.2 (C4); 156.8 (C7); 156.1 (C22); 155.3 (C21); 137.6 (C24); 135.3 (C9); 135.2 (C25); 132.7 (C14); 129.5 (C15); 129.1 (C17); 128.5 (C2); 127.7 (C1); 126.5 (C18); 125.3 (C16); 123.0 (C10); 120.0 (C5); 119.3 (C6); 118.9 (C19); 118.3 (C20); 117.7 (C8), 116.4 (C23); 112.0 (C3); −2.9 (C26). 29Si NMR (DMSO-d6, δ, ppm): −8.11y − 14.89. Elem. anal. calcd for [C66H46N2O8Si2]n (1050.28)n, C, 75.41%; H, 4.41%; N, 2.66%. Found: C, 74.92%; H, 4.25%; N, 2.60%.O); 1585, 1506, 1493, 1476 (CC); 1428, 1106 (Si–C arom.); 1234 (C–O–C); 879, 828 (arom. 1,2,4 subst.); 825 (arom. p-subst.); 743, 700 (arom. mono-subst.). 1H NMR (DMSO-d6, δ, ppm): 7.96 (m, 2H(6)); 7.53 (m, 34H(3,9, 15,17,19,23,24,28,29,30)); 7.16 (m, 14H(5,8,16,20)). 13C NMR (DMSO-d6, δ, ppm): 166.6 (C12); 166.5 (C11); 162.1 (C4); 158.4 (C22); 157.0 (C7); 155.8 (C21); 138.5 (C9); 138.2 (C24); 136.15 (C15); 136.12 (C28); 135.1 (C17); 134.6 (C30); 133.9 (C14); 133.6 (C27); 130.2 (C2); 129.4 (C1); 129.3 (C18); 128.6 (C16); 128.5 (C29); 127.7 (C10); 126.2 (C5); 123.9 (C25); 120.9 (C19); 120.5 (C6), 119.8 (C20); 119.6 (C8); 118.6 (C23); 112.9 (C3). 29Si NMR (DMSO-d6, δ, ppm): −14.72y − 14.79. Elem. anal. calcd for [C76H50N2O8Si2]n (1174.31)n, C, 77.66%; H, 4.29%; N, 2.38%. Found: C, 77.23%; H, 4.18%; N, 2.28%.
Results and discussion
Synthesis and spectroscopic characterization of silylated-dianhydride monomers
Synthesis of the new dianhydride monomers was made in three reaction steps. The first step consists of an addition–elimination reaction between the silylated-diphenolate, obtained in basic medium from 1 or 2, and 4-nitrophthalonitrile (Scheme 1). It is important that the reaction temperature does not exceed 60 °C because the color of the reaction mixture changes from red to a deep black, indicating the presence of side reactions.26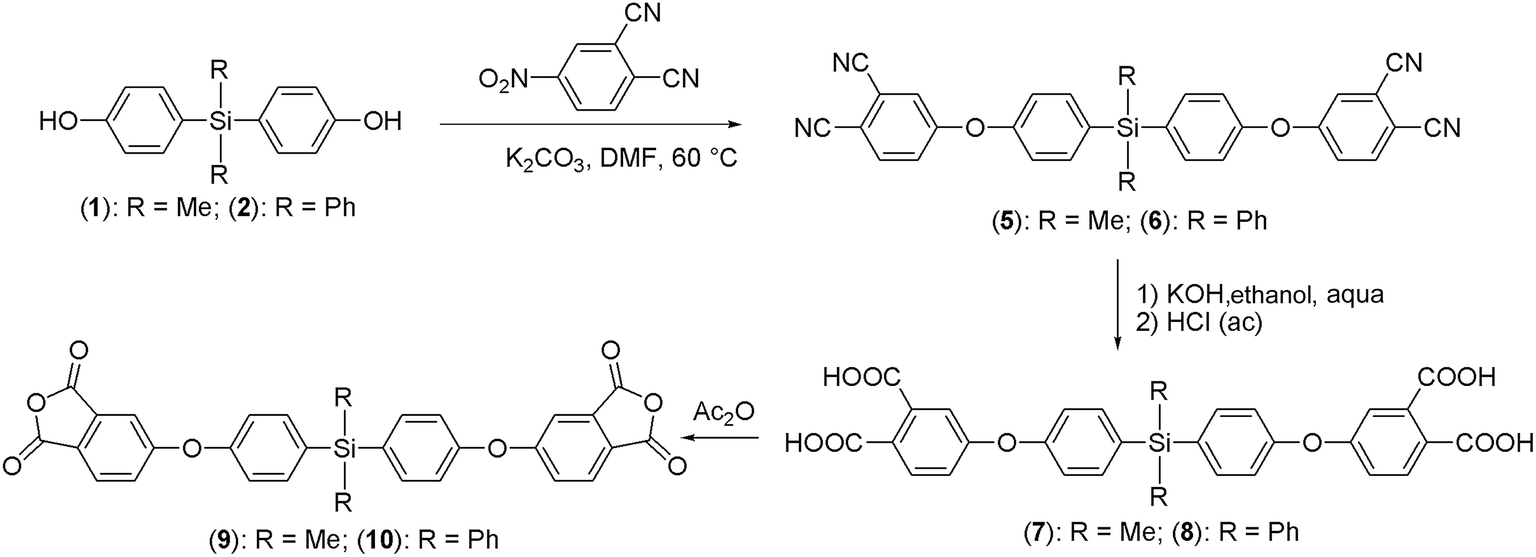 | ||
| Scheme 1 Synthetic route to obtain the silylated-dianhydride monomers. | ||
The second stage consists in a basic hydrolysis of the tetracyano derivative, using KOH in an ethanol–water mixture, followed by an acid treatment and finally obtaining the tetracarboxylic acid. In this step it is possible to recrystallize the tetraacids compounds by dissolving in basic medium and then adding again an acidic solution until pH 1. The third stage is based on the chemical cyclization of the tetracarboxylic acid by reflux with acetic anhydride, which acts as dehydrating agent.
Structure of the precursors and dianhydride monomers was confirmed by elemental analysis and spectroscopic techniques and the results are shown in the Experimental part. Briefly, the FT-IR spectra show the characteristic symmetric and asymmetric stretching bands of the carbonyl groups of the anhydride function around 1850 cm−1 and 1780 cm−1.
In the 1H NMR spectrum of compound (9) (Fig. 1a), the signal of the H5 aromatic hydrogen appears as double doublet due to the coupling at short distance with H6 and long distance with H3. Also, it can be observed the para-substitution patron of H8 and H9 with a coupling constant of 8.4 Hz (AB system). The signal at 0.61 ppm corresponds to the hydrogens of methyl groups bonded to the central silicon atom, which appears at high magnetic field due to the lower electronegativity of the latter atom in relation to carbon. Moreover, in the 1H RMN spectrum of compound (10) (Fig. 1b), the para-substitution patron of the H8 and H9 aromatic hydrogens was also observed. However, the signals of the hydrogens of the phenyl groups bonded to silicon atom and of the phthalic moieties were overlapped in a complex signal whose integration fits for 14 aromatic hydrogens.
 | ||
| Fig. 1 1H NMR spectra (400 MHz, DMSO-d6) with J values for the silylated-dianhydrides 9 (a) and 10 (b). | ||
Poly(ether-imide)s synthesis
The usual method for preparation of aromatic poly(imide)s has two stages. The first step is to obtain an intermediate of type poly(amic acid) from the reaction between the diamine and the dianhydride derivative at room temperature. For this purpose, a polar aprotic solvent is used. The second step is an intramolecular cyclodehydration to generate the final poly(imide) (Scheme 2). | ||
| Scheme 2 Synthetic route to obtain the silylated-poly(ether-imide)s. | ||
In our case, the second reaction step is carried out by a chemical imidization in solution by using a dehydrating agent and a tertiary base such as pyridine or trimethylamine. This method is widely used to obtain the poly(imide)s in powder form and subsequently processing them. The requirement for applying this method is that the polymer must be highly soluble in the reaction medium employed.
Poly(ether-imide)s; PEI-I, PEI-II, PEI-III and PEI-IV, were obtained in good yields (74–89%) and the results of elemental analysis of each were consistent with the proposed structures of the repeating units. In the FT-IR spectra, broad bands between 3200 and 3500 cm−1 were not observed, which corroborates the success of the cyclization reaction of the poly(ether-amic acid) chains. Likewise, the presence of two strong bands around 1780 and 1720 cm−1 confirms the formation of the imide function. These frequencies are associated to the symmetric and asymmetric stretching bands of the imidic CO. A full assignation of the IR bands for each PEI is included in the Experimental part.
Fig. 2 shows the 1H NMR spectra of the PEIs where the pattern of the signs agreed with the proposed structures. Thus, PEI-II and PEI-III evidence a singlet at 0.56 and 0.52 ppm, respectively, corresponding to six magnetically equivalent hydrogens of the methyl groups bonded to the silicon atom. PEI-I shows two signals at high magnetic field (0.52 and 0.58 ppm). These signals are also assigned to the methyl groups bonded to the silicon atoms, which are not magnetically equivalent, one from the diamine monomer and the other from the dianhydride moiety. On the other hand, PEI-IV does not have any signals in the aliphatic region because it does not have hydrogens bonded to sp3 carbons.
 | ||
| Fig. 2 1H NMR spectra (400 MHz, DMSO-d6) of the silylated PEIs. | ||
Solubility, inherent viscosity and size exclusion chromatography (SEC)
Solubility of PEIs was tested in various common organic solvents. All samples were soluble at room temperature in DMSO, DMF, DMAc, m-cresol and NMP, even in THF, a solvent of low boiling point. Probably, the ether linkages and diphenylsilane units present along the polymeric chains reduce the formation of charge transfer complexes due to the increase of their molecular flexibility. As expected, the polymers were insoluble in chloroform and alcohols of low molecular weight, even at 40 °C.Inherent viscosity was measured at a single point, in solutions of 0.5 g of polymer dissolved in 1 dL of NMP at 25 ± 0.1 °C and the obtained values are summarized in Table 1. The inherent viscosity values were low (0.10–0.27 dL g−1), so, it can be estimated that the polymeric chains have a short length corresponding, probably, to oligomers or chain of moderate molecular weight. Additionally, in the case of PEI-I, which shows the highest inherent viscosity of the series, the molecular weight and polydispersity index (Mw/Mn) were determined in DMF-0.1% BrLi solution at 70 °C using SEC technique (Table 2).
The obtained values of Mn and Mw were low, probably due to the mass of PEI-I repeating unit (927.11 g mol−1) and to their number-average molecular weight (6870 g mol−1), the average chain length corresponding to seven repeating units (heptamer). Analyzing the Mn value, longer chains are obtained (thirteen repeating units, approximately), which most contributed to the total weight of the polymer. On the other hand, the polydispersity index for this sample was 1.74, value in the range usually obtained for polycondensation polymers.
The value of the intrinsic viscosity given by the SEC equipment for PEI-I was similar to that calculated from the inherent viscosity measurements using viscometric techniques: 0.28 dL g−1 and 0.27 dL g−1, respectively. Due to the fact that the structure of the poly(ether-imide)s prepared is similar, it is possible to use the a and K constants also given for the SEC analysis to determine the viscometric molecular weight for the remaining samples. Due to this, the inherent viscosity value of each polymer obtained at a single point is accepted as an adequate approximation of the intrinsic viscosity.27 Thus, using the Mark–Houwink–Sakurada equation, the viscosity average molecular weights were obtained, which are also shown in Table 1.
From these values is possible to reaffirm that the polymeric chains did not grow enough. Thus, PEI-I appears as a decamer, PEI-II as a pentamer, whereas PEI-III and PEI-IV were dimers and trimmers, respectively. It is clear that in this calculation the hydrodynamic factors have been neglected, which may differ between samples due to the substitutions performed on the silicon atoms.
Thermal properties
TGA and DTGA curves of the poly(ether-imide)s are shown in Fig. 3a and the data are summarized in Table 3. All PEIs lost 10% of their initial mass at high values of thermal decomposition temperature (TDT10%). These values were obtained between 470 and 530 °C approximately; therefore, the polymers could be classified as thermostable materials. Probably, the high aromatic content of the structures and the presence of two imide functions in the repetitive units promote the observed thermal stability. In this sense, the incorporation of flexible ether fragments and diphenylsilane moieties did not adversely affect this parameter. | ||
| Fig. 3 Thermal analyses for the poly(ether-imide)s: (a) TGA and DTGA curves and (b) DSC curves. | ||
| TDT10%a (°C) | Tgb (°C) | R750c (%) | |
|---|---|---|---|
| a Thermal decomposition temperature for 10% weight loss.b Glass transition temperature taken from the second heating scan.c Residual weight at 750 °C.d Reference polymer (Fig. 4).14 nd = not determined. | |||
| PEI-I | 526 | 169 | 52 |
| PEI-II | 498 | 164 | 41 |
| PEI-III | 473 | 169 | 50 |
| PEI-IV | 488 | 184 | 54 |
| Ref-Ad | 420 | 130 | nd |
| Ref-Bd | 440 | 107 | nd |
In DTGA curves (inside Fig. 3a) one critical mass loss was observed. Probably, the loss of volatile fragments, such as water, carbon monoxide, carbon dioxide, ammonia and methane, occurred with the partial degradation of the material.28 This mass loss is more controlled in the PEI-IV sample, which shows a less sharp and wider signal in relation to the other samples. Apparently, the four phenyl groups, substituents of the silicon atoms, promote a higher thermal resistance in the material.
In this analysis, the samples with phenyl groups bonded to silicon atoms should show high residual weight due their intrinsic thermal resistance. The observed values correlate with this, because the PEI-IV sample (with only Ph) possesses the highest registration, while PEI-II and PEI-III (both with Me/Ph combination) show smaller values. The anomaly resides in the PEI-I sample, where the results do not agree with those before mentioned. Probably, due to the smallest volume of the four groups bonded to the silicon atoms in the latter polymer (Me), the chains present a bigger interaction offering an extra resistance to the degrading action of the heat.
Table 3 also shows the Tg values of the poly(ether-imide)s, whereas in Fig. 3b shows the curves obtained for these series of polymers. PEIs showed Tg values between 164 and 184 °C. In particular, PEI-II and PEI-III show similar Tg values, while PEI-IV had the highest Tg value.
For the latter polymer, the aromatic rings attached to the silicon atoms limit the free rotation around this center and therefore promote a high structural rigidity to the polymeric chains. The high Tg registered for PEI-I, would be associated to its molecular weight (9529 g mol−1), parameter that also affects this thermal value. Thus, in the analysis of PEI-II and PEI-III, with 5700 and 1740 g mol−1; respectively, the inclusion of aromatic rings in the repetitive unit and their consequent contribution to the structural rigidity is more important than the size of the chains. This idea implies that in these two cases the structural details of the chains are modulating the Tg value, with a high independence of the molecular weight. On the other hand, no melting point was registered during DSC analysis. This fact is associated to the non-crystalline nature of the samples.
Structural modifications developed to the silicon atoms provide a polymeric wide thermal window for work (temperature range between the Tg and the TDT10% values). This fact is highly positive for the industrial processability of the analyzed materials.
From a thermal view point, it is possible to establish comparisons with poly(imides) containing also two diphenylsilane moieties in their main chain.15 These units provide the monomer with symmetrical substitution on the silicon atom but without flexibility of ether linkages in their structure (Fig. 4).
 | ||
| Fig. 4 Silylated poly(imide)s employed as references. | ||
The structural option when the diamine has two CH3 groups bonded to the silicon atom results in chemical instability.20 For this reason it is not possible to propose analogues for PEI-I and PEI-III. Thus, the two polymers used as references allow to evaluate the real contribution of the incorporated oxyphenyl units (–OPh–) on the properties of PEI-II and PEI-IV, respectively.
Table 3 shows the thermal parameters for the reference polymers. Ref-A and Ref-B show lower TDT10% values than their analogues, PEI-II and PEI-IV, respectively. This expected increase in the thermal resistance can be explained by the higher aromatic content of the synthesized poly(ether-imide)s. The Tg values analysis show a significant increase when two oxyphenyl moieties are incorporated to the repetitive units. Thus, PEI-II and PEI-IV evidence higher Tg values respect to their reference polymers. This fact would be associated to the competence between the flexibilizing effect promoted by the ether linkage and the rigidity contributed by the aromatic ring. Apparently, the latter effect modules the final value of the property.
Optical properties
In general, a material is considered to be transparent in the UV-visible region if it presents a smooth optical spectrum and a high transmittance in this region. In this sense, it is widely used that if at 400 nm the material maintains more than the 80% of their transmittance (T400), it is considered as transparent in the visible range. The data obtained for the silylated-poly(ether-imide)s in NMP solution (c = 0.5 g L−1) are summarized in Table 4 and the transmittance spectra are shown in Fig. 5. | ||
| Fig. 5 UV-vis curves of poly(ether-imide)s. | ||
Transmittance values at 400 nm were measured resulting in variations between 84% and 89%, indicating that these materials are transparent in the analyzed region, probably attributed to the presence of flexible units in the polymeric chain, which reduce the possibility of molecular packing in solution and allowing the passage of light.
On the other hand, the cut-off wavelength values of PEI-I, PEI-II and PEI-III were closed. In this reduced series, PEI-I, with symmetrical substitution (CH3) on the silicon atoms, showed the highest λcutoff while the samples with asymmetric combination (Ph and CH3) showed lower values. When the CH3 groups were replaced by Ph units (PEI-IV) the shortest λcut-off (269 nm) was observed. Apparently, the bulky pendant units, such as phenyl moieties, inhibit the chain–chain interactions in solution and, thereby, decrease the charge transfer complex formation.
Table 3 also compares the UV-visible behavior of the PEIs with that of a traditional polyimide such as Kapton (poly(4,4′-oxydiphenylene-pyromellitimide)). When the high aromatic content of the structure is maintained but flexibilizing agents are introduced in the repetitive unit (ether linkages and diphenylsilane moieties) it is possible to obtain a significant improvement in all the recovered optical parameters.
Morphological characterizations
Field Emission Scanning Electron Microscopy (FE-SEM) and Atomic Force Microscopy (AFM) analyses were carried out for each compound. For this, planar homogenous films were prepared using 22–23 mg of polymer in 200 μL of THF; the reaction mixtures were homogenized. Then, 20 μL of this dissolution was placed on the center of copper plates and spinned at 6000 rpm during 60 seconds (each sample was deposited by triplicate). During the deposition process, some parts of the dissolved polymer showed lower interactions between them, generating unstable points that promote nucleation on the surface, that is, a polymer restructuration triggered by centripetal force applied and solvation processes. This deposition method also produces surface strains generated by the expansion of the polymer top layer, enhancing the pore formation in the unstable points after THF evaporation. Another important factor for the inception of this kind of structure is the concentration and precipitation of the polymers. It is important to emphasize that in order to obtain FE-SEM micrographies with good resolution and contrast, it was necessary to deposit a thin gold layer over the films in order to prevent electronic over-charge effects.FE-SEM
Images at variable magnification (12000, 25000 and 50000×) were taken for each polymer. The surface micrographies were analyzed through a self-designed computing code that adjust circles through the application of a Hough transform in the pores using the segmented images and through edge recognition of the binary images. These values were employed to determine pore diameters and to then generate a frequency distribution using five or six images of different sectors of the sample in order to obtain appropriate statistical results. All the analyzed samples present two characteristic pore diameters distributions that are independent between them with a 95% confidence interval according to ANOVA tests performed. This demonstrates statistically that there are two different pore sizes on the surface, which can be visually recognized with facility. Some ones are slightly bigger than others. It is important to mention that the modes of these distributions maintain a ratio of ∼1.35–1.40 between them for all cases (∼1.4 for PEI-I, ∼1.35 for PEI-II and ∼1.38 for PEI-IV), indicating that the diameter pore of the bigger one is between 35% and 40% larger than the smaller one. This behavior can be related to the asymmetry of the functional groups according to the main chain; these characteristics are shared by the different composites analyzed.
PEI-I shows a relatively homogeneous pore distribution at surface level (Fig. 6a). It can be seen that the two pore diameters that present the highest frequencies are located at ∼0.085 ± 0.008 μm and ∼0.119 ± 0.018 μm (statistical modes of distribution). These results could be attributed to the relatively structural symmetry around the silicon atoms (R1 = R2 = Me) and the mobility of the polymeric chain into the system. Similar pore diameter behavior is observed for PEI-II (Fig. 6b), but with average pores diameters longer than the first ones. For this sample, it was possible to determine distribution modes located at ∼0.154 ± 0.013 μm and at ∼0.209 ± 0.017 μm. Finally, PEI-IV (Fig. 6d) presents pores distributions modes located at ∼0.153 ± 0.011 μm and ∼0.212 ± 0.019 μm, presenting a similar distribution than PEI-II. This behavior is probably related to the phenyl groups bonded to the silicon atoms, which allow a higher structural stability and symmetry inside the chain. PEI-III, which has a similar structure than the composite PEI-II, does not show pore homogeneity at surface level (Fig. 6c), and only few micropores were formed in places near to big clusters. These agglomerations are present as defects that could generate heterogeneities in their structuration, which are probably responsible of pore formation. These results demonstrate that the substituents bonded to the silicon atoms (Ph and Me) affect the homogeneity and surface structuring of the films according to the monomer nature, which promotes their presence in the repetitive unit.
 | ||
| Fig. 6 Surface topography of polymer films: (a) PEI-I, (b) PEI-II, (c) PEI-III and (d) PEI-IV. | ||
Atomic force microscopy
AFM analyses of PEI-I, PEI-II and PEI-IV were used to visualize the micropore arrangement; dimensions (depth and diameter) and their distribution were measured in order to corroborate the data obtained by FE-SEM technique. These pores have a cylindrical structure with irregular shapes and, in some cases (PEI-I), form a random network of tortuous pores.Thickness of the films deposited over polished and semi-reflective copper were measured several times (1 per second during 30 seconds) using a multiple angle laser ellipsometer model SE400Adv from SENTECH. The results for layer thickness varied from 246.2 ± 2.3 nm for sample PEI-I and 327.9 ± 3.4 nm for PEI-II. In the case of the compound PEI-IV, the average thickness measured were 285.5 ± 1.9 nm. On the other hand, the thickness of the PEI-III sample was difficult to measure due to the high roughness of the surface, resulting in dispersed values with a high associated error.
Height profiles of these samples show a sequence of elevated regions attributed to the pore structure. Thus, PEI-I presents pore diameter values between ∼0.08 and 0.09 μm and ∼0.11–0.13 μm (Fig. 7a). These results are similar to those obtained by FE-SEM. The recovered depths by AFM are between 3.8 and 5.4 nm, approximately. Four traces were drawn for PEI-II (Fig. 7b), the profiles take two characteristic pores with diameters between ∼0.15 and 0.16 μm and ∼0.18–0.21 μm and depths between ∼11.9 and 17.7 nm and ∼20.6–22.5 nm, respectively; similar tendency to that obtained through FE-SEM analysis (Fig. 6b). On the other hand, PEI-IV (Fig. 7c) presents three traces, the depth and diameter of each pore does not exceed 15.4 nm and 0.20 μm, respectively, with similar values than those of PEI-II. The difference between both techniques (AFM and FE-SEM) is related to the number of pores than can be visualized. By FE-SEM more than 200 pores can be counted in total using the images of the different sectors of each sample (between 50 and 60 pores for each image), while with AFM this amount is much lower according to the area analyzed. However, it could be possible that there is a certain relation between the measured pores diameters and the polymer structure.
 | ||
| Fig. 7 Images obtained by AFM for (a) PEI-I, (b) PEI-II and (c) PEI-IV with their respective profiles. | ||
The diameter sequence of the pores is: PEI-II (R1 = Ph, R2 = Me) ∼ PEI-IV (R1 = Ph, R2 = Ph) > PEI-I (R1 = Me, R2 = Me); pore diameters: 0.154/0.209 μm ∼ 0.153/0.212 μm > 0.085/0.119 μm, respectively. The presence of phenyl group in the symmetric/asymmetric combination of R1/R2 substituting groups on silicon atoms (PEI-II and PEI-IV) affects the arrangement of the chains into the polymer, producing larger pores. These chains would have greater structural mobility, favoring the formation of deeper pores. On the other hand, the polymer that present only methyl as radical groups on silicon atoms (PEI-I) shows lower diameter and depth of the pores. This behavior should be related to the steric hindrance and the space (volume) remnant in the polymer network.
The same analysis can be performed according to pore depth; the sequence in this case is: PEI-II > PEI-IV > PEI-I; pore depth: 20.6–22.5/11.9–17.7 nm > 8.3–15.4 nm > 3.8–5.4 nm, respectively. Similar than the previous analysis, the composites that present phenyl radical groups into their structure (PEI-II and PEI-IV) possess larger pore depths. In this case, the asymmetry in the distribution of R1/R2 substituting groups (PEI-II, Ph/Me) produces in general deeper pores compared to symmetrical R1/R2 distribution (Ph/Ph for PEI-IV). PEI-I shows the lower pore depth due to the absence of phenyl groups in their structure.
Conclusions
New poly(ether-imide)s containing two diphenylsilane moieties and flexible units in the main chain were synthesized in high yields and wholly characterized in order to establish their structure. The PEIs showed good solubility at room temperature in different organic solvent including THF. The inherent viscosity values were low, indicating the possible formation of oligomers and/or moderate molecular weight chains. This observation was confirmed by SEC analysis, where the Mn value for PEI-I corresponds to seven repeating units and the Mw value corresponds to thirteen repeating units, approximately. The thermal stability of the polymers was evaluated by TGA and DSC analysis. Due the high aromatic content and the presence of imide functions, all PEIs were thermally stable with TDT10% between 473 and 526 °C, while the Tg values were close and low (164–184 °C). In this sense, the inclusion of moieties such as ether linkages and silicon atoms promoted flexibility in the polymeric chain. However, when these results were compared with reference polymers that possess similar structure it is observed that the specific inclusion of phenyl units modulates the final flexibility of the chains. This fact is clearly evidenced by the Tg values analysis. All PEIs showed high transparency in solution in the UV-visible region, with the highest value for PEI-IV, which presents two phenyl groups bonded to each silicon atom. In general, the differences in the properties of these polymers can be associated to the structural variation developed on the silicon atoms.Micropore structures were spontaneously formed from THF-polymeric solutions deposited over a copper plate through spin coating technique. The observed pore pattern is associated to the polymer solvation, strain mismatch at surface level during deposition, solvent evaporation and polymer intrinsic properties. Thus, the distribution and dimensions of the pores were analyzed through FE-SEM and AFM techniques. All the samples present holes with similar morphology and distribution. These kinds of polymers form planar pores with diameters ten times (or more) longer than their depth. Specific pore morphology is directly related to the polymer molecular structure by means of the nature of the R1 and R2 groups bonded to silicon atoms. In general, the presence of a phenyl group in their structure produces larger and deeper pores.
Acknowledgements
The authors acknowledge the financial assistance by Fondo Nacional de Desarrollo Científico y Tecnológico, FONDECYT, through Project 1095151. A. Tundidor-Camba and D. Coll thank CONICYT for a fellowship No. 24110014 and 24121175, respectively. We also thank Universidad Tecnológica Metropolitana (UTEM) for sputter coater acquisition.References
- S. A. Stern, Y. Mi, H. Yamamoto and A. K. St Clair, J. Polym. Sci., Part B: Polym. Phys., 1989, 27, 1887–1909 CrossRef CAS.
- K. L. Mittal, Polyimides: Synthesis, Characterization, and Applications, Plenum Press, New York, 1984 Search PubMed.
- M. K. Ghosh and K. L. Mittal, Polyimides: Fundamentals and Applications, Marcel Dekker Inc., New York, 1996 Search PubMed.
- J. Preston, in Encyclopedia of Polymer Science and Engineering, ed. H. F. Mark, Wiley-Interscience, New York, 1988, vol. 11 Search PubMed.
- R. N. Johnson, A. G. Farnham, R. A. Clendinning, W. F. Hale and C. N. Merriman, J. Polym. Sci., Part A: Polym. Chem., 1967, 5, 2375–2398 CrossRef CAS.
- D. J. Liaw and F. C. Chang, J. Polym. Sci., Part A: Polym. Chem., 2004, 42, 5766–5774 CrossRef CAS.
- C. A. Terraza, L. H. Tagle, A. Tundidor-Camba, P. Ortiz and D. Coll, Eur. Polym. J., 2012, 48, 649–661 CrossRef CAS.
- L. H. Tagle, C. A. Terraza, A. Tundidor-Camba and F. Lara, Polym. Bull., 2014, 71, 1031–1042 CrossRef CAS.
- D. J. Liaw, B. Y. Liaw and C. W. Yu, Polymer, 2001, 42, 5175–5179 CrossRef CAS.
- C. A. Terraza, L. H. Tagle, D. Muñoz, A. Tundidor-Camba, P. A. Ortiz, D. Coll, C. M. González-Henríquez and I. A. Jessop, Polym. Bull., 2016, 73, 1103–1117 CrossRef CAS.
- C. A. Terraza, J.-G. Liu, Y. Nakamura, Y. Shibasaki, S. Ando and M. Ueda, J. Polym. Sci., Part A: Polym. Chem., 2008, 46, 1510–1520 CrossRef CAS.
- A. Tundidor-Camba, C. A. Terraza, L. H. Tagle and D. Coll, J. Appl. Polym. Sci., 2011, 120, 2381–2389 CrossRef CAS.
- C. P. Yang and J. H. Lin, Polymer, 1995, 36, 2607–2614 CrossRef CAS.
- L. H. Tagle, C. A. Terraza, A. Leiva and P. Valenzuela, J. Appl. Polym. Sci., 2006, 102, 2768–2776 CrossRef CAS.
- H. Tang, N. Song, X. Chen, X. Fan and Q. Zhou, J. Appl. Polym. Sci., 2008, 109, 190–199 CrossRef CAS.
- L. H. Tagle, C. A. Terraza, A. Leiva and P. Alvarez, J. Appl. Polym. Sci., 2009, 114, 1080–1085 CrossRef CAS.
- L. H. Tagle, C. A. Terraza, P. Ortiz, M. J. Rodríguez, A. Tundidor-Camba, A. Leiva, C. González-Henríquez, A. Cabrera, U. Volkmann and E. Ramos-More, J. Macromol. Sci., Part A: Pure Appl. Chem., 2012, 49, 562–570 CrossRef CAS.
- L. H. Tagle, C. A. Terraza, P. A. Ortiz and A. Tundidor-Camba, J. Chil. Chem. Soc., 2011, 56, 945–947 CrossRef CAS.
- J. R. Pratt, W. D. Massey, F. H. Pinkerton and S. F. Thames, J. Org. Chem., 1975, 40, 1090–1094 CrossRef CAS.
- M. Bruma and B. Schulz, J. Macromol. Sci., Polym. Rev., 2001, 41, 1–40 CrossRef.
- S. F. Thames and K. G. Malone, J. Polym. Sci., Part A: Polym. Chem., 1993, 31, 521–526 CrossRef CAS.
- C. A. Terraza, L. H. Tagle, C. Contador, A. Tundidor-Camba and C. M. González-Henríquez, Polym. Bull., 2014, 71, 1001–1013 CrossRef.
- C. A. Terraza, L. H. Tagle, A. Tundidor-Camba, C. González-Henríquez, D. Coll and M. Sarabia, RSC Adv., 2015, 5, 28515–28526 RSC.
- L. H. Tagle, J. C. Vega, F. R. Díaz, R. Radic, L. Gargallo and P. Valenzuela, J. Macromol. Sci., Part A: Pure Appl. Chem., 2000, 37(9), 997–1008 CrossRef.
- P. Klapetek, M. Valtr, D. Nečas, O. Salyk and P. Dzik, Nanoscale Res. Lett., 2011, 6, 514–522 CrossRef PubMed.
- T. J. Broxton, D. M. Muir and A. J. Parker, J. Org. Chem., 1975, 40, 3230–3233 CrossRef CAS.
- K. K. Chee, J. Appl. Polym. Sci., 1987, 34, 891–899 CrossRef CAS.
- W. Xie, W. Pan and K. C. Chuang, J. Therm. Anal. Calorim., 2001, 64, 477–485 CrossRef CAS.
- L. Hu, M. Li, C. Xu and Y. Luo, Thin Solid Films, 2011, 520, 1063–1068 CrossRef CAS.
| This journal is © The Royal Society of Chemistry 2016 |