Design of a dual-bed catalyst system with microporous carbons and urea-supported mesoporous carbons for highly effective removal of NOx at room temperature
Jun Lia,
Di Yina,
Donghui Longa,
Jitong Wang*a,
Licheng Linga and
Wenming Qiao*ab
aState Key Laboratory of Chemical Engineering, East China University of Science and Technology, Shanghai, 200237, China. E-mail: wangjt@ecust.edu.cn; qiaowm@ecust.edu.cn; Tel: +86-21-64252924 Tel: +86-21-64253730
bKey Laboratory of Specially Functional Polymeric Materials and Related Technology, East China University of Science and Technology, Ministry of Education, China
First published on 10th March 2016
Abstract
A dual-bed catalyst system is designed to remove NOx at room temperature, which consists of a microporous spherical activated carbon (SAC) layer and a urea-supported spherical mesoporous carbon (SMC) layer. The SAC layer, with plenty of narrow micropores acting as a nano-cage for NO adsorption, could improve the oxidation of NO into NO2, while the urea-supported SMC layer with large surface area could provide a sufficient channel for gas kinetic diffusion and a high gas/urea interfacial area for efficient NO2 reduction. A high stationary-state NOx conversion of 88% for 70 h is achieved through the dual-bed catalyst system with SAC and 100 wt% urea supported SMC as the catalyst. The selective catalytic reduction (SCR) activity could be improved by increasing the NO and O2 feed concentration, due to the enhanced oxidation of NO to NO2. A low reaction temperature is beneficial for the SCR reaction because of the increased NO adsorption. Moreover, the apparent activation energies are calculated to be −16.8 kJ mol−1 for NO oxidation and 1.18 kJ mol−1 for NO2–urea SCR, respectively. The result reveals that the adsorption of reactants on SAC is of key importance for NO oxidation, while the surface reaction of NO2 with urea could be the crucial step for the SCR reaction.
Introduction
Nitrogen oxides (NOx) are major pollutants in the atmosphere, leading to acid rain, photochemical smog, ozone depletion and even the greenhouse effect.1,2 Because of the environmental concerns posed by air pollution, a considerable amount of research has been expended to develop methods for controlling NOx emissions. The conventional strategies mainly include the combustion modification,3 catalytic reduction,4,5 and adsorption of NOx on porous materials.6 Among these, the selective catalytic reduction (SCR) is widely used for removing NOx from the combustion processes, due to its high efficiency and selectivity together with the resistance to poisoning and aging of the catalysts used.There have been many catalysts and reducing agents developed for the SCR reaction, among which the most important commercial catalyst for removing NOx from stationary source by far is V2O5/TiO2 catalyst with ammonia as the reducing agent. However, the catalyst requires high reaction temperatures above 300 °C,7 which makes it not active enough to remove NOx at ambient temperature from the atmosphere in crowded traffic areas and confined spaces. Moreover, NH3 is not an ideal reducing agent because of its corrosiveness and toxicity.8 Therefore, there is a pressing need to develop more environmentally friendly SCR technologies that could capably work under ambient temperature.
NOx adsorption, which accumulates NOx from the exhaust gas into the pore structure of the adsorbents, is a promising approach for NOx removal at ambient temperature. Various types of porous materials such as mixed oxides, ion-exchanged zeolites, hydrotalcite and activated carbons9–12 have been utilized as adsorbents. Activated carbons have drawn much interest because of their handy capture and high removal ability without generating any secondary pollution problems. However, carbon based adsorbents generally show low selectivity,13 and could easily lose their removal capacity owing to the saturated adsorption occurred on the carbon surface.14 Thus, an effective solution to this problem is to use a carbon adsorbent as support to load reducing agent and adsorb NOx from the exhaust gas, and then the adsorbed NOx could be reduced into N2 by the adjacent reducing agent through SCR reaction.
Recently, the carbon materials loaded with urea have been reported as effective SCR catalysts for NOx removal at room temperature.15–17 Urea is used as a reducing agent instead of NH3, which is environment-friendly with no additional pollutant, making this technology more appropriate for NOx removal from the atmospheric environment. Shirahama et al.18 reported that urea supported on pitch-based activated carbon fibers (ACFs) could efficiently reduce NO at ambient temperature. Wang et al.19 investigated the SCR reactivity of NO with urea supported on pitch-based spherical activated carbon (PSAC) at low temperature, indicating that PSAC with 8 wt% urea loading exhibited high activity in the selective catalytic reduction of NO at 30 °C. Although the removal of NOx at room temperature is practical through the urea-supported carbon materials, the current research is almost focused on utilizing the microporous carbons as the support, which limits the urea loading amount. Moreover, the narrow pore channels of microporous carbons might restrict the adsorption of gas phase reactant and the diffusion of the products, leading to a low reaction rate. Thus, there is still a challenge to further improve this SCR process.
Mesoporous carbons have been widely used in the field of adsorption, gas purification and electrochemistry,20–22 due to their high specific surface area, large pore volume as well as controllable pore size distribution. Furthermore, mesoporous carbons can be formed into different shapes like monoliths, rods, spheres or films,23–25 thus they could be used without further aftertreatment, making them good candidates for applications in catalysis. However, the application of mesoporous carbons as the support for NOx removal, to date, is very limited. Recently, well-developed mesoporous carbon spheres were successfully prepared by our group through a combined hard templating and sol–gel processing.26 The mesoporous carbon spheres exhibited high surface area as well as large pore volume, which could increase the urea loading amount for SCR reaction, and improve the mass transfer rate of the gas phase, making them quite suitable as the support for NOx removal.
Here in this work, a novel dual-bed catalyst system, which is composed of a microporous spherical activated carbon (SAC) layer and a urea-supported spherical mesoporous carbon (SMC) layer, respectively, is proposed for highly efficient removal of NOx at room temperature. The SAC layer with large surface area and micropore volume could act as the nano-cage for NO adsorption and oxidation into NO2, while the urea-supported SMC layer with high urea loading amount could convert NO2 into N2 efficiently. The oxidation of NO on SAC/SMC as well as the SCR of NOx (NO/NO2) on the urea-supported SAC/SMC in form of the single-bed configuration was studied primarily to give an insight into the urea-SCR reaction. The effects of pore structure and urea loading amount on the SCR activity of single-bed and dual-bed catalyst system were compared. Moreover, the effect of NO and O2 feed concentration and reaction temperature on the SCR activity over dual-bed catalyst system was investigated, and the apparent activation energies of NO oxidation and NO2–urea SCR reaction were calculated, respectively.
Experimental section
Materials
Urea (AR), resorcinol (AR), formaldehyde (37 wt%) and NaOH (>96 wt%) were commercially available from Shanghai Lingfeng Chemical Reagent CO., LTD. Ludox SM-30 sol (30 wt% SiO2) was commercially available from Sigma-Aldrich Chemical Inc. The microporous spherical activated carbon (SAC) was commercially available from Shanghai Heda Carbon Company.The spherical mesoporous carbon (SMC) was synthesized through a combined hard templating and sol–gel processing within water-in-oil emulsion, using resorcinol–formaldehyde polymer as carbon precursor and colloidal silica nanoparticles as hard templates. The detailed synthesis process of SMC was given in our previous publication.26 Herein, the initial concentration of resorcinol/formaldehyde (1![[thin space (1/6-em)]](https://www.rsc.org/images/entities/char_2009.gif) :
:![[thin space (1/6-em)]](https://www.rsc.org/images/entities/char_2009.gif) 2 in molar ratio) polymer was fixed at 15 g/100 mL water, and the mass ratio of silica to resorcinol/formaldehyde polymer was 3 to 2.
2 in molar ratio) polymer was fixed at 15 g/100 mL water, and the mass ratio of silica to resorcinol/formaldehyde polymer was 3 to 2.
Preparation of catalysts
Urea was loaded on SAC and SMC through the incipient wetness impregnation using aqueous solution of urea according to the following steps. The support was added into a certain concentration of urea solution, and kept at 25 °C for 24 h, and then dried at 60 °C for 24 h in vacuum oven. ‘[(Weight of urea)/(weight of carbon support) × 100]%’ was used to define the urea loading amount over the catalysts. The as-prepared sample was denoted as SAC-x or SMC-x, where x represented the weight percentage of urea on the support. In this work, the urea loading amounts were adjusted to 30% and 50% for SAC while 30%, 50% and 100% for SMC.Characterization
The morphologies and microstructures of the samples were observed under scanning electron microscopy (SEM, JEOL 7100F). Nitrogen adsorption/desorption isotherms of the samples were measured at 77 K with Quadrasorb SI analyzer. Before the analysis, the samples were degassed in vacuum at 373 K for 12 h. BET surface area (SBET) was analyzed through Brunauer–Emmett–Teller method. The total pore volume (Vt) was estimated from the adsorbed amount at the relative pressure of 0.996. The micropore surface area (Smic) and micropore volume (Vmic) were obtained through t-plot method. The pore size distributions of SMC/SMC-x and SAC/SAC-x were analyzed by using Barrett–Joyner–Halenda (BJH) model and nonlocal density functional theory (NLDFT), respectively. The thermal stability of the catalyst and the amount of urea deposited on the support were evaluated through the thermogravimetric analysis by TA Q600 instrument (condition: temperature range = 20–800 °C, heating rate = 5 °C min−1, nitrogen flow rate = 100 mL min−1).Activity test
Fig. 1 shows the schematic diagrams of the single-bed catalyst system for (a) NO oxidation and (b) NO reduction and the dual-bed catalyst system for (c) NO reduction. The NO oxidation and the selective catalytic reduction of NOx (NO/NO2) were measured in a vertical fixed-bed glass reactor with an internal diameter of 10 mm. In the single-bed catalyst system, the sample (SAC/SMC or SAC-x/SMC-x) was loaded directly into the reactor. While, in the dual-bed catalyst system, the urea-supported sample (SAC-x or SMC-x) was first loaded on the bottom of the reactor, and then SAC was loaded above the urea-supported sample. The quartz particles were packed between the two layers to act as not only the interlayer to separate the two layers, but also the media for uniform distribution of the gas flow. And the two layers could be simplified as Bed 1 and Bed 2, where NO is converted to NO2, and then NO2 is converted to N2, respectively.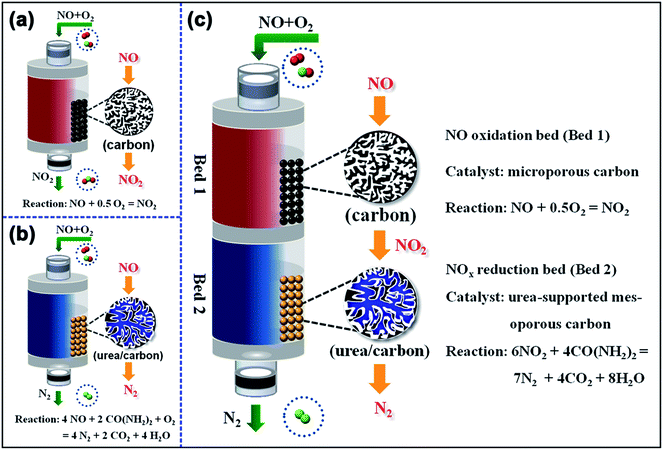 | ||
| Fig. 1 Schematic diagrams of the single-bed catalyst system for (a) NO oxidation and (b) NO reduction and the dual-bed catalyst system for (c) NO reduction. | ||
The inlet gas was a mixture of 250–1000 ppmv NO or NO2, 5–20 vol% O2 and a balance of Ar with a total flow rate of 100 mL min−1 at atmospheric pressure. In a typical catalytic process, a certain amount of SAC and SAC-x/SMC-x was placed in the reactor. The Ar gas (100 mL min−1) was first introduced for 60 min to purge the system at 90 °C, and then feed gas was introduced at a flow rate of 100 mL min−1 during the catalytic reaction. The reactor was heated from room temperature to desired temperature at a heating rate of 1 °C min−1. The concentration of NO, NO2 and NOx was measured at regular intervals using an ECO PHYSICS CLD62 chemiluminescence NO/NOx analyzer. The conversion of NO and NOx, and the yield of NO2 during the tests were calculated via the following equations:
| NO conversion = (CNO,in − CNO,out)/CNO,in × 100% | (1) |
| Yield of NO2 = CNO2,out/CNO,in × 100% | (2) |
| NOx conversion = (CNO,in − CNO,out − CNO2,out)/CNO,in × 100% | (3) |
During the regeneration, the used dual-bed catalyst systems consisted of SAC + SAC-30 and SAC + SMC-30 were first purged for 12 h under a Ar flow of 100 mL min−1 at 100 °C. The used SAC in Bed 1 was reused without additional treatment, and the used SAC or SMC in Bed 2 was washed by the deionized water until the pH value did not change, and then the support was dried at 110 °C for 6 h and finally reloaded with 30% urea.
Results and discussion
Characterization
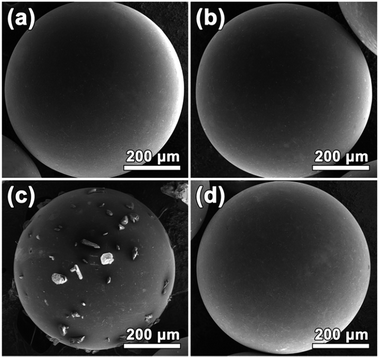
Fig. 2 shows the SEM images of SAC, SMC and SAC/SMC with 50 wt% of urea loading. It can be observed that both SAC and SMC show a similar average particle size at about 0.6 mm, and exhibit a good spherical shape and smooth surface without obvious cracks. This would be beneficial to be used in the fixed-bed reactor owing to the good abrasion resistance, high packing density and small fluid flow resistance.19 After 50 wt% urea loaded on SAC, some of urea crystal appears on the surface. For SMC with 50 wt% of urea, the morphology does not change obviously due to the high pore volume and pore size of SMC.Fig. 3 shows the nitrogen adsorption–desorption isotherms and pore size distributions of SACs and SMCs with different urea loadings. SAC exhibits a type I adsorption–desorption isotherm according to the IUPAC classification, indicating a typically microporous structure. Moreover, SAC displays a narrow micropore size distribution with a peak at about 0.7 nm. The detailed porosity parameters are summarized in Table 1. The pristine SAC shows a BET surface area of 1411 m2 g−1, a pore volume of 0.62 cm3 g−1 and an average pore size of 0.7 nm. After impregnation, the porosity of the catalyst decreases because the pores were filled by urea. It should be noted that the sample of SAC-50 lost almost all porosity due to the overloading of urea.
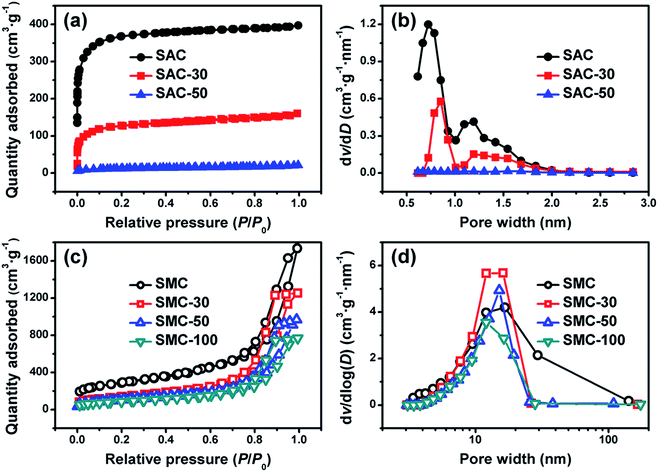 | ||
| Fig. 3 Nitrogen adsorption–desorption isotherms and pore size distributions of SACs (a and b) and SMCs (c and d) with different urea loadings. | ||
| Sample | SBETa (m2 g−1) | Smicb (m2 g−1) | Vtc (cm3 g−1) | Vmicd (cm3 g−1) | De (nm) |
|---|---|---|---|---|---|
| a BET surface area.b Micropore surface area (<2 nm).c Total pore volume (P/P0 = 0.996).d Micropore volume (<2 nm).e Average pore diameter. | |||||
| SAC | 1411 | 1295 | 0.62 | 0.52 | 0.7 |
| SAC-30 | 478 | 389 | 0.25 | 0.16 | 0.9 |
| SAC-50 | 45 | 26 | 0.03 | 0.01 | 1.5 |
| SMC | 1025 | 280 | 2.69 | 0.13 | 12.3 |
| SMC-30 | 510 | 5.1 | 1.94 | — | 15.2 |
| SMC-50 | 378 | — | 1.45 | — | 15.3 |
| SMC-100 | 264 | — | 1.04 | — | 15.8 |
As shown in Fig. 3c and d, SMC exhibits a very similar type IV adsorption–desorption isotherm with an H2 hysteresis loop, corresponding to the mesoporous characteristic of the materials.27 The as-prepared SMC shows a high BET surface area of 1025 m2 g−1, a large pore volume of 2.69 cm3 g−1 and an average pore size of 12.3 nm. After impregnation, considerable porosity (1.04 cm3 g−1) is still remained on SMC even with 100% of urea loading. The residual channels could effectively decrease the pore diffusion resistance to promote the adsorption of reactant and product molecules. These results reveal that SMC is superior to SAC as a support for urea loading.
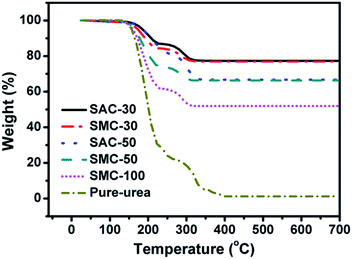
Fig. 4 shows TG analysis of the samples. The weight loss of the samples after heated to 700 °C in nitrogen flow could be assigned to the content of urea supported on SAC or SMC. All the samples start to decompose at 150 °C, being similar to the pure urea. The designed and actual urea loading amounts are listed in Table 2. It could be observed that the actual urea loading content is in good agreement with the designed value, indicating that the impregnation approach is an efficient way of loading urea.
| Sample | Urea loading amount by designa (wt%) | Urea loading amount by TGAb (wt%) | Actual urea loading amountc (wt%) |
|---|---|---|---|
| a wt% = murea/mSAC × 100% or murea/mSMC × 100%.b wt% = murea/(murea + mSAC) × 100% or murea/(murea + mSMC) × 100%.c wt% = bwt%/(100 − bwt%/) × 100%. | |||
| SAC-30 | 30 | 22.9 | 29.7 |
| SAC-50 | 50 | 33.2 | 49.7 |
| SMC-30 | 30 | 23.1 | 30.0 |
| SMC-50 | 50 | 33.3 | 49.9 |
| SMC-100 | 100 | 49.5 | 98.0 |
NO oxidation on SAC and SMC
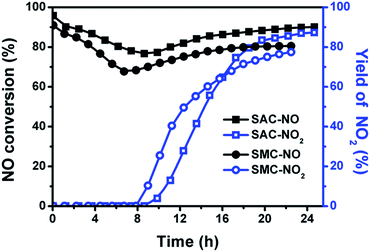
NO oxidation was considered to be a critical step in SCR technologies.15–17 Herein, in order to illustrate the role of the support in this urea-SCR reaction, the activities of SAC and SMC for NO catalytic oxidation were firstly studied in this work. Fig. 5 shows the oxidation of NO into NO2 in the presence of O2 on SAC and SMC. It could be observed that the two supports show the similar tendency towards NO conversion under the experimental conditions studied. Both of them display a high NO conversion during the initial period followed by a gradual decrease to reach a minimum value of 76.7% for SAC in 8.6 h and 68.3% for SMC in 7.8 h, respectively. Then, NO conversion increases slowly to approach a stable value of 90% for SAC and 80% for SMC.No NO2 is detected at the outlet of the reactor until 8.6 h for SAC and 7.8 h for SMC, respectively, consistent to the time, when the minimum peak of the NO conversion appears. After emission of NO2, the outlet yield of NO2 quickly increases with time and finally stabilizes at 90% for SAC and 80% for SMC, which is equal to the final-state NO conversion, indicating that all consumed NO is catalytically oxidized into NO2 by O2 at the end of the study.
During NO oxidation, NO is considered to be firstly co-adsorbed with oxygen on the carbon surface to form adsorbed NO2, resulting in the delayed release of gaseous NO2.28 Some of the adsorbed NO2 could react with the reductive sites on the carbon surface, oxidizing these sites and releasing NO into gas phase.29 Thus, the NO conversion decreases during the early stage of oxidation process and exhibits a minimum peak on the NO conversion curves. After these sites are oxidized, NO2 becomes stable on the carbon surface and is released as the acceleration of NO oxidation.30 It is well-known that the NO oxidation is related to the presence of narrow micropores. The micropores with pore size of 0.5–0.8 nm could serve as the nano-cages for NO and O2 adsorption and reaction to form NO2.28 Thus, the better NO oxidation performance of SAC could be due to the large micropore volume and an average micropore size around 0.7 nm, as shown in Table 1.
NO reduction through the single-bed catalyst system
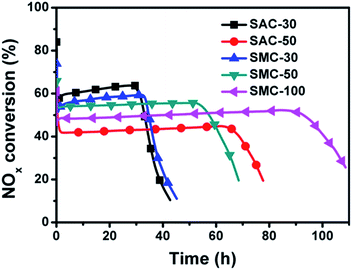
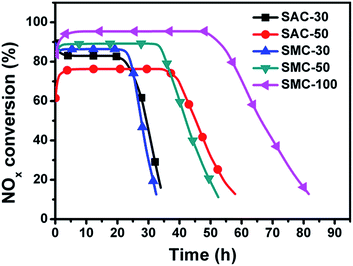
Fig. 6 shows the reactivity of NO with different amount of urea supported on SACs and SMCs in the single-bed catalyst system. It was reported that the reactivity of NO with urea proceeded through the SCR reaction with about two molecules of NO reducing with one molecules of urea.15,16 For the urea-supported microporous carbons, the NOx conversion of SAC-30 first decreases dramatically from an initial value of 84% to 56% in 1.5 h, and then maintains a stationary conversion from 1.5 to 31.7 h with a gradual increase of NO conversion to 63%. After the stationary period, the NO conversion decreases rapidly due to the consumption of urea. When the loading amount of urea was increased, the NOx conversion of SAC-50 decreases from an initial value of 56% to 41% in 1.8 h. This could be attributed to the overloading of urea, which results in an increased diffusion resistance of the gas from the surface into the active sites. However, the period of the reduction increases to 65.7 h for SAC-50 with a stationary conversion of 42.5%, indicating the increased amount of NO reduction.For the urea-supported mesoporous carbons, the NOx conversion of SMC-30 declines from an initial 74% to 52% in 0.8 h, and then raises slowly to 59% in 33.2 h. When the urea loading is increased to 50 wt% and 100 wt%, the NOx conversion shows a value of 66% and 61% at the initial period, and then declines to a stationary value of 54.5% and 50.5%, and maintains this level for 55.2 and 96.3 h, respectively. After the stationary-state period, the samples exhibit a sharp decrease in NOx conversion owing to the urea consumption.
For NO removal through the single-bed catalyst system, microporous carbon (SAC) with urea loading of 30 wt% shows the highest stationary-state NOx conversion in the study. This is because the NO oxidation is considered to be the rate-limiting step for the overall NO-SCR reaction, which is related to the presence of narrow micropore.16 These results also reveal that the reactivity of NO with urea through the single-bed catalyst system depends on not only the pore structure of the catalyst but also the urea loading amount.
NO2 reduction through the single-bed catalyst system
Fig. 7 illuminates the reactivity of NO2 with different amount of urea supported on SACs and SMCs through the single-bed catalyst system. NO2 could be easily adsorbed on the carbon surface due to its high polarity, and then the adsorbed NO2 is converted to NO3 through the disproportionated reaction, which is reduced rapidly by supported urea to produce N2. It was found that the reactivity of NO2 with urea proceeded through the SCR reaction with much higher NO2-SCR activity than the NO-SCR activity.18 All the catalysts could reach their steady-state of NO2 removal at very initial time. For the urea-supported microporous carbons, the stationary-state NO2 conversion and the removal period is about 84% in 23.8 h for the SAC-30 and 76% in 40.3 h for the SAC-50, respectively. The low stationary-state NOx conversion for the high urea loading amount is possibly resulted from urea overload, leading to an increased diffusion resistance of the gas from the surface into the active sites.For the urea-supported mesoporous carbons, SMC-30 exhibits a stationary NOx conversion of 86.5% in 22.5 h, which is higher than that of SAC-30. When the urea loading content is increased to 50 wt% and 100 wt%, the reduction capacity increases significantly to 89% in 34.6 h for SMC-50 and 93% in 54.7 h for SMC-100. The mesoporous carbon shows a high pore volume and a large BET surface area, which could provide a sufficient space for urea dispersion, and consequently the empty channel for gas kinetic diffusion and the high gas/urea interfacial area for NO2 reduction. These results reveal that the mesoporous carbon rather than micropore carbon could be more competent to serve as the promising support for urea loading during the NO2-SCR process.
NO removal through the dual-bed catalyst system
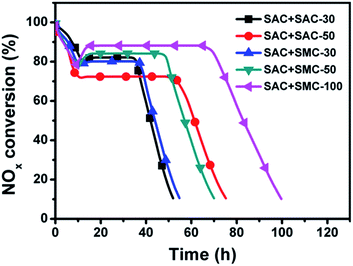
When NO is used as reactant, the adsorption and oxidation of NO governs the whole urea-SCR process,16 which is proved to be strongly dependent on the microporous channels in the catalyst.28 When NO2 is used as reactant, there is considered to be much more active sites facilitating NO2 adsorption than NO adsorption,31 and the trapped NO2 could be easily turned into adsorbed NO3 species on the carbon surface, which is considered as an important intermediate for a rapid urea-SCR reaction.16–19 To improve the NO-SCR activity, a novel dual-bed catalyst system composed of the microporous spherical activated carbon (SAC) layer and the urea supported spherical mesoporous spherical carbon (SMC-x) was proposed, as shown in Fig. 1c. The SAC layer could act as the nano-cage for NO adsorption and oxidation into NO2, while the urea supported SMC layer could convert NO2 into N2 efficiently.Fig. 8 illuminates the reactivity of NO with different amount of urea through the dual-bed catalyst system of SAC layer and SAC-x/SMC-x layer. The trend of the NOx conversion is similar for all the catalysts used. The NOx conversion is initially high and then decreases to a minimum value followed by a rapid increase to reach the stationary-state. The minimum peaks observed are between 73% and 75% in about 10 h to 12 h which is in line with the process of NO oxidation.
After the induced stage, NO2 breaks through from Bed 1, and the urea-SCR reaction rate is enhanced in the following Bed 2 due to the high activity of the urea supported samples. Thus, the NOx conversion is found to increase rapidly to a stationary state for each sample beyond the time. The stationary-state NOx conversion over the dual-bed catalyst system decreases in the order of SAC + SMC-100 (88%) > SAC + SMC-50 (84%) > SAC + SAC-30 (83%) > SAC + SMC-30 (80%) > SAC + SAC-50 (73%). And the NO removal period is prolonged obviously with the increasing urea loading amount. The SAC and SMC-100 catalyst system exhibits a highest stationary-state NOx conversion of 88% in 70 h, which is much better than that of the single-bed catalyst system. The novel dual-bed process combines the advantages of improving both the urea loading amount and the stationary-state NOx conversion, which is promising to provide a practical approach for the industrial applications.
The capacity of unit urea for NO consumption is calculated and discussed in Table 3. For the dual-bed catalyst system of SAC and urea-supported SAC, the mole ratio of NO consumption to unit urea is decreased from 2.47 to 1.97 with urea loading increase from 30% to 50%. And for the dual-bed catalyst system of SAC and urea-supported SMC, the mole ratio of NO consumption to unit urea is decreased from 2.49 to 1.52 with urea loading increase from 30% to 100%.
| Material balance | SAC + SAC-30 | SAC + SAC-50 | SAC + SMC-30 | SAC + SMC-50 | SAC + SMC-100 |
|---|---|---|---|---|---|
| Actual urea rate on sample (%) | 29.7 | 49.7 | 30.0 | 49.9 | 98.0 |
| Actual amount of urea on sample (mol) | 0.00148 | 0.00250 | 0.00150 | 0.00249 | 0.00489 |
| Breakthrough time (BTT) (h) | 35.6 | 54.7 | 37.5 | 48.9 | 70.4 |
| Total amount of supplied net NO until BTT (mol) | 0.00430 | 0.00660 | 0.00453 | 0.00590 | 0.00850 |
| Ratio of reacted NO to supplied net NO (%) | 84.8 | 74.6 | 82.6 | 84.5 | 87.6 |
| Amount of removed NO (mol) | 0.00365 | 0.00492 | 0.00374 | 0.00499 | 0.00745 |
| Mole ratio of reacted NO to urea over catalysts | 2.47 | 1.97 | 2.49 | 2.00 | 1.52 |
The regenerated SAC + SAC-30 and SAC + SMC-30 exhibit the stationary-state NOx conversions of 85% and 83%, respectively, slightly higher than those of the original systems. While the stationary-state NOx removal periods of the regenerated SAC + SAC-30 and SAC + SMC-30 are found to be 32.3 h and 33.6 h, respectively, slightly shorter than those of the original systems. Because a fresh carbon surface could be oxidized in the presence of NO and O2, and NO2 is not released into gas phase until the carbon surface is completely oxidized.28 The oxidized carbon surface of the used SAC could not be recovered completely at 100 °C during the regenerated process. Therefore, the release time of NO2 from the oxidized carbon surface is shorter than that of NO2 from the fresh carbon surface leading to a shorter lifetime for the second round.
Effect of NO concentration on NOx conversion over the dual-bed catalyst system
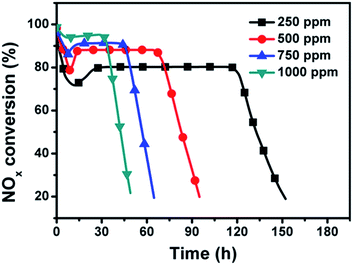
Fig. 9 illustrates the effect of NO concentration on NOx conversion over the dual-bed catalyst system. A high SCR activity is achieved with the increase of NO concentration while the NOx removal period shortens. The stationary-state NOx conversions and the NOx removal periods are about 80% and 116 h for 250 ppmv NO, about 88% and 70 h for 500 ppmv NO, about 91% and 44 h for 750 ppmv NO, and about 95% and 31 h for 1000 ppmv NO, respectively. Such result reveals that a high NO feed concentration could accelerate the production of NO2 from the SAC layer and finally has a beneficial effect on the urea-SCR reaction.Effect of O2 concentration on NOx conversion over the dual-bed catalyst system
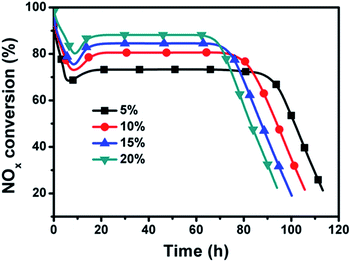
Fig. 10 illustrates the effect of O2 concentration on NOx conversion over the dual-bed catalyst system. It could be observed that the SCR activity is improved with the increasing O2 concentration. When O2 concentration is 5 vol%, the stationary-state NOx conversion shows only 73%. With the increase of O2 concentration, the stationary-state NOx conversion could achieve about 80% with 10 vol% O2, about 84% with 15 vol% O2, and about 88% with 20 vol%, respectively. Such result suggests that a high O2 feed concentration could enhance the reaction rate of NO oxidation over the SAC layer significantly, leading to more NO2 participating in the urea-SCR reaction on the following layer.Effect of reaction temperature on NOx conversion over the dual-bed catalyst system concentration
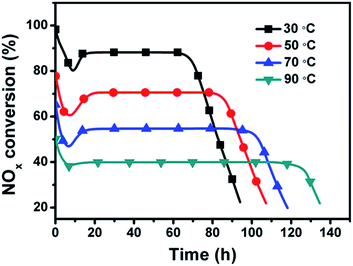
Fig. 11 shows the effect of reaction temperature on NOx conversion over the dual-bed catalyst system. The SCR activity is decreased remarkably with the increasing reaction temperature, while the NOx removal period prolongs at a high reaction temperature. The stationary-state NOx conversion and NOx removal period are 88% and 70 h at 30 °C, 70% and 83 h at 50 °C, 54% and 101 h at 70 °C, and 40% and 123 h at 90 °C, respectively. Such results reveal that the reaction temperature plays a decisive role in the SCR reaction over the dual-bed catalyst system. A high reaction temperature would inhibit the adsorption of NO and decrease the reaction rate of NO oxidation to NO2 on the SAC layer, thus ruin the whole SCR activity.To further clarify the effect of reaction temperature on NO oxidation and NO2–urea SCR reaction, the reaction rate of NO oxidation on SAC and NO2 reduction on SAC-30 at different temperatures were studied, and the corresponding apparent activation energies of these two reactions were calculated, respectively. Fig. 12 shows the effect of reaction temperature on stationary-state NOx conversion and reaction rate of NO oxidation over SAC and NO2 reduction over SAC-30. For NO oxidation on SAC, the stationary-state NOx conversion decreases with the increasing reaction temperature from 91.3% at 30 °C to 48.6% at 70 °C. For NO2 reduction over SAC-30, the stationary-state NOx conversion increases with the increasing reaction temperature from 86.5% at 30 °C to 92.5% at 70 °C.
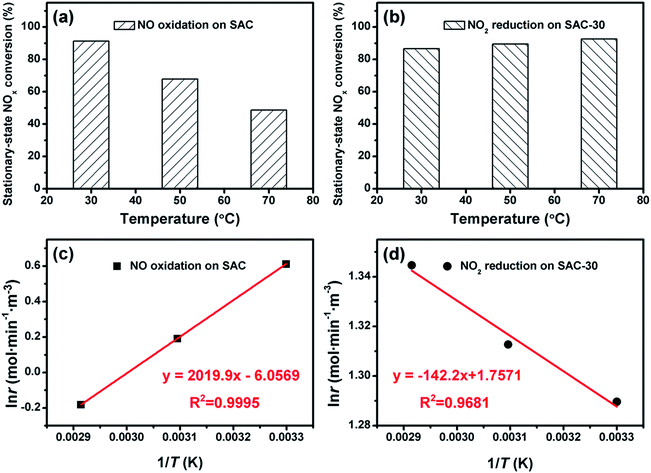 | ||
| Fig. 12 Effect of reaction temperature on stationary-state NOx conversion and reaction rate: (a and c) NO oxidation over SAC; (b and d) NO2 reduction over SAC-30. | ||
The apparent activation energies calculated according to Arrhenius equation are −16.8 kJ mol−1 for NO oxidation and 1.18 kJ mol−1 for NO2 reduction, respectively. The negative apparent activation energy suggests that the adsorption of the reactants on the SAC is of key importance for the NO oxidation. The small positive numerical value of the apparent activation energy implies that surface reaction of NO2 with urea could be the crucial step for the NO2–urea SCR process.
Conclusion
In this paper, a dual-bed catalyst system, which consists of a microporous spherical activated carbon (SAC) layer and a urea-supported spherical mesoporous carbon (SMC) layer, is proposed for highly effective removal of NO at room temperature. A high stationary-state NOx conversion of 88% for 70 h could be obtained through the dual-bed catalyst system with SAC and SMC-100 as the catalyst. A high feed concentration of NO and O2 as well as a low reaction temperature could improve the oxidation of NO into NO2 on SAC layer, which results in the acceleration of urea-SCR reaction on the following layer. According to the apparent activation energies calculated for NO oxidation (−16.8 kJ mol−1) and NO2–urea SCR reaction (1.18 kJ mol−1) respectively, the adsorption of NO on the activated carbons is considered to be of key importance for the NO oxidation, while surface reaction of NO2 with urea could be the crucial step for the latter reaction. Such results could hopefully give rather profound information for industrial application of the urea-SCR technology.Acknowledgements
This work was partly supported by MOST (2014CB239702), National Science Foundation of China (No. 51302083, No. U1303291, No. 51272077, No. 21506061), Fundamental Research Funds for the Central Universities and Shanghai Rising Star Program.References
- H. Bosch and F. Janssen, Catal. Today, 1988, 2, 369 CrossRef CAS.
- J. J. Zhu and A. Thomas, Appl. Catal., B, 2009, 92, 225 CrossRef CAS.
- K. Skalska, J. S. Miller and S. Ledakowicz, Sci. Total Environ., 2010, 408, 3976 CrossRef CAS PubMed.
- T. S. Park, S. K. Jeong, S. H. Hong and S. C. Hong, Ind. Eng. Chem. Res., 2001, 40, 4491 CrossRef CAS.
- Z. H. Chen, F. R. Wang, H. Li, Q. Yang, L. F. Wang and X. H. Li, Ind. Eng. Chem. Res., 2012, 51, 202 CrossRef CAS.
- M. X. Wang, Z. H. Huang, T. Shimohara, F. Y. Kang and K. M. Liang, Chem. Eng. J., 2011, 170, 505 CrossRef CAS.
- U. S. Ozkan, M. W. Kumthekar and Y. P. Cai, Ind. Eng. Chem. Res., 1994, 33, 2924 CrossRef CAS.
- R. M. Heck, Catal. Today, 1999, 53, 519 CrossRef CAS.
- M. Machida, M. Uto, D. Kurogi and T. Kijima, Chem. Mater., 2000, 12, 3165 CrossRef CAS.
- B. Levasseur, A. M. Ebrahim and T. J. Bandosz, J. Colloid Interface Sci., 2012, 377, 347 CrossRef CAS PubMed.
- Z. M. Ni, A. M. Chen, C. P. Fang, L. G. Wang and W. H. Yu, J. Phys. Chem. Solids, 2009, 70, 632 CrossRef CAS.
- M. X. Wang, Z. H. Huang, K. Shen, F. Y. Kang and K. M. Liang, Catal. Today, 2013, 201, 109 CrossRef CAS.
- K. Kaneko, Langmuir, 1987, 3, 357 CrossRef CAS.
- A. Claudino, J. L. Soares, R. F. P. M. Moreaira and H. J. Jose, Carbon, 2004, 42, 1483 CrossRef CAS.
- N. Shirahama, I. Mochida, Y. Korai, K. H. Choi, T. Enjoji, T. Shimohara and A. Yasutake, Appl. Catal., B, 2005, 57, 237 CrossRef CAS.
- Z. Wang, Y. L. Wang, D. H. Long, I. Mochida, W. M. Qiao, L. Zhan, X. J. Liu, S. H. Yoon and C. L. Ling, Ind. Eng. Chem. Res., 2011, 50, 6017 CrossRef CAS.
- Z. Zeng, P. Lu, C. Li, G. Zeng, X. Jiang, Y. B. Zhai and X. P. Fan, Environ. Technol., 2012, 33, 1331 CrossRef CAS PubMed.
- N. Shirahama, I. Mochida, Y. Korai, K.-H. Choi, T. Enjoji, T. Shimohara and A. Yasutake, Appl. Catal., B, 2004, 52, 173 CrossRef CAS.
- Z. Wang, Y. L. Wang, D. J. Wang, Q. J. Chen, W. M. Qiao, L. Zhan and L. C. Ling, Ind. Eng. Chem. Res., 2010, 49, 6317 CrossRef CAS.
- B. H. Hameed, A. T. M. Din and A. L. Ahmad, J. Hazard. Mater., 2007, 141, 819 CrossRef CAS PubMed.
- S. Sircar, T. C. Golden and M. B. Rao, Carbon, 1996, 34, 1 CrossRef CAS.
- W. R. Li, D. H. Chen, Z. Li, Y. F. Shi, Y. Wan, G. Wang, Z. Y. Jiang and D. Y. Zhao, Carbon, 2007, 45, 1757 CrossRef CAS.
- Z. Y. Wang and A. Stein, Chem. Mater., 2008, 20, 1029 CrossRef CAS.
- A. D. Roberts, X. Li and H. F. Zhang, Chem. Soc. Rev., 2014, 43, 4341 RSC.
- C. D. Liang, K. L. Hong, G. A. Guiochon, J. W. Mays and S. Dai, Angew. Chem., Int. Ed., 2004, 43, 5785 CrossRef CAS PubMed.
- J. T. Wang, Q. J. Chen, X. J. Liu, W. M. Qiao, D. H. Long and L. C. Ling, Mater. Chem. Phys., 2011, 129, 1035 CrossRef CAS.
- F. G. Sun, J. T. Wang, H. C. Chen, W. C. Li, W. M. Qiao, D. H. Long and L. C. Ling, ACS Appl. Mater. Interfaces, 2013, 5, 5630 CAS.
- W. J. Zhang, S. Rabiei, A. Bagreev, M. S. Zhuang and F. Rasouli, Appl. Catal., B, 2008, 83, 63 CrossRef CAS.
- S. Adapa, V. Gaur and N. Verma, Chem. Eng. J., 2006, 116, 25 CrossRef CAS.
- I. Mochida and N. Shkaham, Fuel, 2000, 79, 1713 CrossRef CAS.
- Z. P. Zhu, Z. Y. Liu, S. J. Liu and H. X. Niu, Fuel, 2000, 79, 65 CrossRef.
| This journal is © The Royal Society of Chemistry 2016 |

