Ca(OH)2 nano-pods: investigation on the effect of solvent ratio on morphology and CO2 adsorption capacity

Farah Diana Mohd Daudab, Kumaravel Vignesh*ac, Srimala Sreekantan*a, Abdul Rahman Mohamedd, Misook Kang*e and Byeong Sub Kwake
aSchool of Materials and Mineral Resources Engineering, Engineering Campus, Universiti Sains Malaysia (USM), Nibong Tebal, Penang, Malaysia. E-mail: sreekantansrimala1974@gmail.com; vignesh134@gmail.com; Fax: +60-604-5941011; Tel: +60-604-5995215
bDepartment of Manufacturing and Materials Engineering, Faculty of Engineering, International Islamic University Malaysia (IIUM), P.O. Box 10, 50728 Kuala Lumpur, Malaysia
cAnano Sphere Sdn Bhd, Lorong Industri 11, Kawasan Industri Bukit Panchor, Nibong Tebal 14300, Penang, Malaysia
dSchool of Chemical Engineering, Engineering Campus, Universiti Sains Malaysia (USM), Nibong Tebal, Penang, Malaysia
eDepartment of Chemistry, College of Science, Yeungnam University, Gyeongsan, Gyeongbuk 712-749, Republic of Korea. E-mail: mskang@ynu.ac.kr

Received 26th December 2015 , Accepted 31st March 2016

First published on 8th April 2016


Abstract

Ca(OH)2 nano-pods were synthesized through a precipitation method. Solvents such as ethanol/deionized water (DIW) and dimethylformamide (DMF)/deionized water (DIW) were used at different volume ratios to synthesize the samples. Various characterization techniques such as X-ray diffraction (XRD), filed emission scanning electron microscopy (FESEM), high resolution transmission electron microscopy (HRTEM) and BET surface area analysis were employed to investigate the role of solvent on the crystallinity, morphology and surface area of Ca(OH)2. The solvent mixtures with a high volume of organic solvent (ethanol or DMF) acted as good capping agents to suppress the growth of Ca(OH)2 in the (1010) direction and induce anisotropic growth along the (0001) direction. A uniform pod like morphology was observed for the Ca(OH)2 sorbent synthesized using ethanol/DIW with a volume ratio of 78 ml/02 ml. Besides, the sorbents synthesized using ethanol/DIW showed good CO2 adsorption capacity and high surface area when compared to that of DMF/DIW.

1. Introduction

The anthropogenic emission of carbon dioxide (CO2) from industries is one of the major causes for global warming. In recent years, low cost Ca(OH)2 based sorbents have been proved to be promising materials to adsorb CO2 green house gas.1–3 Various methods such as sonochemical, hydrogen plasma and sol–gel have been employed to synthesise Ca(OH)2 nanostructures. Nevertheless, these techniques have their own limitations like high temperature, pressure, reaction time and complex/multistep reactions. The synthesis of Ca(OH)2 nanostructures via a precipitation method has received significant attention to improve the CO2 adsorption capacity.4,5 The precipitation method provides several advantages such as simple experimental steps, low working temperature, high yield of products and inexpensive equipment. In precipitation method, the characteristics of the material can be controlled by reaction temperature, nature of the metal ion precursor, amount of water and type of organic solvent. Compared to other reaction parameters, solvents played an auxiliary role in controlling the morphology.6 Chandradass et al.7 studied the effect of ethanol and water in the synthesis of LaCoCO3 by co-precipitation method. Konopacka-Łyskawa et al.8 examined the effect of some organic solvent–water mixtures composition on precipitated calcium carbonate in carbonation process. They used aqueous solutions of isopropyl alcohol, n-butanol and glycerol as solvents. Yang et al.9 reported the synthesis and photocatalytic activity of Bi2O3 synthesized using DMF–H2O mixture by precipitation method. The selection of an organic solvent will give a significant effect on the surface morphology of the particles.10 The organic solvent can act as a capping agent and suppress the growth of certain crystal facet by binding with metal cations or organic ligands.11,12 The binding ability of such solvent and metal cation could obviously affect the dissolution–recrystallization process.13 The in-depth study of controlling the mechanism of these capping agents is a challenging task for their potential applications.

Therefore, the studies regarding the effect of solvent ratio on the morphology Ca(OH)2 has received great significance to improve the CO2 adsorption capacity. There are no detailed reports on the CO2 adsorption capacity of Ca(OH)2 nano-pods. Hence, in this present work, we studied the effect of ethanol, DMF and mixed solvent (ethanol/DIW and DMF/DIW) on the growth of Ca(OH)2. The influence solvent as a function of volume ratio on the crystal structure, size, morphology, surface area and CO2 adsorption capacity of Ca(OH)2 was investigated in detail.

2. Experimental

Materials

All the chemicals used were of analytical grade and applied without further purification. Ca(NO3)2·4H2O, N,N-dimethylformamide (DMF), ethanol and sodium hydroxide (NaOH) were supplied by Sigma-Aldrich. Deionized water (DIW) was used in the experiments.

Synthesis of Ca(OH)2 sorbents

Calcium nitrate tetrahydrate Ca(NO3)2·4H2O was used as precursor, while dimethylformamide (DMF), ethanol and DIW were used as solvents. A mixture of ethanol/DIW and DMF/DIW were prepared at different volume ratios (40 ml/40 ml, 60 ml/20 ml, 78 ml/2 ml and 80 ml/0 ml) and used as solvents. At first, 0.33 g of Ca(NO3)2·4H2O was dissolved in the solvent and heated in a water bath at 35 °C. Then, 30 ml of 0.1 M of NaOH aqueous solution was added drop wise into the precursor solution under vigorous magnetic stirring for 30 min. The obtained precipitates were collected by centrifugation and washed several times with DIW and ethanol to remove the impurities. The precipitates were then dried at 60 °C in air overnight.

Characterization

X-ray diffraction (XRD) measurements were employed for the identification of crystalline phases using a Philips PW1729 powder X-ray diffractometer with a Cu Kα radiation source (wavelength = 1.5406 Å) and operated at 45 kV and 40 mV in the 2theta range of 10° to 80°. Field emission scanning electron microscopy (FESEM) measurements were performed on the synthesized sorbents to obtain the information on morphology (Zeiss SUPRA 35VP). The morphology was also studied with the help of a high resolution transmission electron microscope (HRTEM, Tecnai 20/200 kV, FEI). BET (Brunauer–Emmett–Teller) surface area and pore size distribution analysis were studied by N2/physisorption at 77 K using a Quantachrome Autosorb-I machine. The CO2 uptake (carbonation and decarbonation performance) of the sorbent was measured using a thermogravimetric analyzer (TGA, STA 6000, Perkin Elmer).

Measurement of CO2 adsorption

The carbonation was carried out at in the range of 350–650 °C for 30 min in 100% CO2, while the decarbonation was performed at 800 °C for 10 min in 100% N 2. About 10 mg of the sorbent was placed in an alumina crucible and the sample was activated by heating it at room temperature under N2 atmosphere. The flow rate of gas was adjusted to 20 ml min−1 by a mass flow controller. Once the carbonation temperature was reached and stabilized, pure CO2 (100%) was introduced, while the change in the sample weight was recorded. The weight and temperature of the sample were continuously monitored and recorded during the entire carbonation–decarbonation process. The CO2 adsorption capacity of the sample was calculated from the weight change.

3. Results and discussion

Fig. 1 and 2 show the XRD patterns of sorbents obtained using different solvent ratios. All the diffraction peaks are perfectly indexed to the hexagonal phase of Ca(OH)2 [ICDD# 01-084-1263], with lattice parameters a = 3.59180 Å and c = 4.90630 Å.
image file: c5ra27771j-f1.tif
Fig. 1 XRD patterns of Ca(OH)2 sorbents synthesized using different volume ratio of ethanol/DIW (a) 40 ml/40 ml, (b) 60 ml/20 ml, (c) 78 ml/02 ml and (d) 80 ml/0 ml.

image file: c5ra27771j-f2.tif
Fig. 2 XRD patterns of Ca(OH)2 sorbents synthesized using different volume ratios of DMF/DIW (a) 40 ml/40 ml, (b) 60 ml/20 ml, (c) 78 ml/02 ml, and (d) 80 ml/0 ml.

Most of the diffraction peaks are sharp and intense for entire samples, indicating good crystallinity of Ca(OH)2 sorbents. XRD pattern of the sorbents synthesized using ethanol/DIW and DMF/DIW is almost similar, however the relative intensity of the peaks is slightly varied. It is observed that the relative intensity of (1010) peak is decreased when increasing the volume of ethanol or DMF. At the same time, (0001) peak intensity is increased. Hence, it is proposed that ethanol or DMF could selectively absorb on the crystalline facet, induce anisotropic growth along (0001) direction and retard the lateral facet growth along (1010) direction. This is later affirmed with the morphology obtained via FESEM and HRTEM analysis.

The influence of ethanol/DIW and DMF/DIW volume ratios on the size and morphology of Ca(OH)2 are investigated using FESEM analysis. The results are displayed in Fig. 3 and 4. A well defined morphology is obtained using ethanol/DIW and DMF/DIW solvents.


image file: c5ra27771j-f3.tif
Fig. 3 FESEM images of Ca(OH)2 sorbents synthesized using different volume ratios of ethanol/DIW (a) 80 ml/0 ml, (b) 78 ml/02 ml, (c) 60 ml/20 ml and (d) 40 ml/40 ml.

image file: c5ra27771j-f4.tif
Fig. 4 FESEM images of Ca(OH)2 sorbents synthesized using different volume ratios of DMF/DIW: (a) 80 ml/0 ml, (b) 78 ml/02 ml, (c) 60 ml/20 ml, and (d) 40 ml/40 ml.

Ethanol/DIW with a volume ratio of 80 ml/0 ml and 78 ml/02 ml promote the formation of pods with an average size of 0.6 μm in length and 0.2 μm in diameter. The preferential growth in (0001) direction is resulted in pod like structures. When solvent volume ratio is changed to 60 ml/20 ml, some flake like structures are observed together with pod like structures. At the ethanol/DIW volume ratio of 40 ml/40 ml, the size of sorbent is obviously increased and hierarchical pod with flower like structures are produced in certain regions. The subunit of pods in the flower like structure has a length of 1.3 μm and diameter of 0.4 μm. Therefore a lower volume of ethanol resulted in the increase of particle size.

DMF/DIW with a volume ratio of 80 ml/0 ml and 78 ml/02 ml also promote the formation of pods with a length of 0.8 μm and the diameter of 0.3 μm. However, significant changes in the morphology are observed when the solvent volume ratio is changed to 60 ml/20 ml. Small spherical particles are observed and they are distributed in the range of 0.1–0.2 μm. Meanwhile, for DMF/DIW with a volume ratio of 40 ml/40 ml, the particles are bigger and extensive agglomeration is observed. Obviously, FESEM results demonstrated that the solvent volume ratio is strongly influenced the shape and size of Ca(OH)2 sorbent.

The morphological changes are ascribed to the difference in polar characteristic of the mixed solvent that influence the nucleation and preferential direction of crystal growth.14 Ethanol is a polar protic solvent and self-associated through hydrogen bonding.15 Whereas, DMF is a polar aprotic solvent and strongly associated with C[double bond, length as m-dash]O group. DMF has a larger dipole moment and dielectric constant than ethanol.15–17

Fig. 5 shows HR-TEM image of the sorbent synthesized using ethanol/DIW with a volume ratio of 78 ml/02 ml. The image affirms the existence of pod like structure. The inset in Fig. 5 shows that the pod like structures is having high densities of stacking faults on (0001). Furthermore, the spacing of 0.31 nm between adjacent lattice planes corresponds to the distance of (10[1 with combining macron]0) planes, indicating that [0001] is the growth direction of the Ca(OH)2 pod like structure.


image file: c5ra27771j-f5.tif
Fig. 5 HRTEM image of the Ca(OH)2 sorbent synthesized using ethanol/DIW (78 ml/02 ml).

The size distribution is given in the histogram (Fig. 6). Average values of the histogram were obtained by analysing several frames of similar bright field images of the specimen. The majority of calcium hydroxide pod diameter in this histogram is found to be approximately 200 nm (0.2 μm).


image file: c5ra27771j-f6.tif
Fig. 6 Histogram of particle size distributions of the Ca(OH)2 sorbent synthesized using ethanol/DIW (78 ml/02 ml).

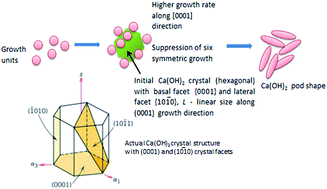
A schematic diagram is proposed (Fig. 7) based on the results. The plane with low surface energy is more stable than that of with high surface energy.18 To minimize the total surface energy, the growth of the high surface energy polar plane will be faster than other planes. For Ca(OH)2, (1010) is the more stable non-polar plane with low surface energy. The polar plane (0001) having higher surface energy, which elongates faster to form pods.


image file: c5ra27771j-f7.tif
Fig. 7 The proposed schematic diagram of the formation of Ca(OH)2 pod shape by precipitation route.

Fig. 8 shows the rigorous TG curve corresponding to the Ca(OH)2 sorbent synthesized using DMF/DIW. The analysis was performed to examine the effect of temperature on surface adsorbed DMF. A minor weight loss is observed from 400 to 500 °C and a major weight loss is observed at 500 to 700 °C. The weight loss at 400 to 500 °C is attributed to partial decomposition of Ca(OH)2 to CaO, while complete transformation to CaO only takes place in the second stage (above 500 °C). That conversion of Ca(OH)2 to CaO is not attained completely at 400 to 500 °C due to the strong binding of DMF as a capping agent on the surface of the Ca(OH)2 particles.


image file: c5ra27771j-f8.tif
Fig. 8 TG curves of Ca(OH)2 sorbent with different solvent volumes of DMF/DIW for 30 min at 35 °C; (a) 80 ml/0 ml, (b) 78 ml/02 ml, (c) 60 ml/20 ml, and (d) 40 ml/40 ml.

DSC results of sorbent prepared using DMF/DIW is shown is Fig. 9. The endothermic peak observed at 450 °C is relatively smaller than that of sorbent prepared using ethanol/DIW, indicating the energy required for phase transformation of sorbent is lower. This could be due to less amount of Ca(OH)2 is readily available for the transformation to CaO. The second endothermic peak is found in the temperature range 700 to 750 °C. This peak is more intense for sorbent synthesized with high DMF/DIW (80 ml/0 ml). This could be associated with decomposition of DMF that bound to calcium during synthesis.


image file: c5ra27771j-f9.tif
Fig. 9 DSC curves of Ca(OH)2 sorbent with different solvent volumes of DMF/DIW for 30 min at 35 °C: (a) 80 ml/0 ml, (b) 78 ml/02 ml, (c) 60 ml/20 ml, and (d) 40 ml/40 ml.

Fig. 10 and 11 show the N2 adsorption/desorption isotherms of Ca(OH)2 sorbents fabricated using ethanol/DIW (78 ml/02 ml) and DMF/DIW (78 ml/02 ml), respectively. It is observed that the sorbents exhibited type II characteristics with H3 hysteresis loop according to the IUPAC classification. Type II characteristic is highly favourable to improve the CO2 adsorption capacity of sorbents.


image file: c5ra27771j-f10.tif
Fig. 10 Nitrogen adsorption–desorption isotherm of Ca(OH)2 sorbent synthesized using ethanol/DIW (78 ml/02 ml). The inset shows BJH pore size distribution.

image file: c5ra27771j-f11.tif
Fig. 11 Nitrogen adsorption–desorption isotherm of Ca(OH)2 sorbent synthesized using DMF/DIW (78 ml/02 ml). The inset shows BJH pore size distribution.

The pore size of the sorbents is in the meso-porous range; 2 nm to 50 nm (insert curves of Fig. 10 and 11). The surface area, pore volume and average pore diameter of the sorbent synthesized using ethanol/DIW are 30.45 cm2 g−1, 0.235 cm3 g−1 and 3.80 nm, respectively. Whereas, the surface area, pore volume and average pore diameter of the sorbent synthesized using DMF/DIW are 20.66 cm3 g−1, 0.111 cm3 g−1 and 19.02 nm, respectively. The results revealed that the sorbent prepared from ethanol/DIW has better structural features when compared to that of DMF/DIW. Hence, it is expected that the CO2 adsorption capacity of sorbent synthesized from ethanol/DIW would be higher.

CO2 adsorption performance of Ca(OH)2 sorbent

The CO2 adsorption capacity of calcium based sorbents were carried out at high temperature (carbonation temperature: in the range of 600 °C and 700 °C; decarbonation temperature: 900 °C).19 Recently, Broda et al. observed that the high calcination temperature (≥900 °C) induce the thermal sintering of the sorbent20 and this will affect the CO2 adsorption capacity. In this work, the carbonation temperature was varied in the range of 350–650 °C and the decarbonation temperature was fixed at 800 °C.

The sorbent with best characteristics (uniform pod like structure with high surface area) was selected to study the CO2 absorption capacity. Therefore, Ca(OH)2 sorbent synthesized using ethanol/DIW with a volume ratio of 78 ml/02 ml was systematically investigated. The reactivity with CO2 was evaluated by measuring the weight changes resulting from CO2 adsorption and release under various carbonation temperatures.

Fig. 12 shows that there are two stages in the carbonation reaction. The first stage (I) is the fast chemical-controlled reaction. This is ascribed to the rapid surface reaction between CO2 and CaO to form a CaCO3 layer that covers the CaO core. The second stage (II) is the slow diffusion-controlled reaction. This is attributed to the diffusion of CO2 through a layer of CaCO3 to react with the unconverted CaO core.21 It is observed that the sorbent displayed high adsorption capacities (35% and 50%) and rapid CO2 adsorption kinetics (less than 2 min) at 550 °C and 650 °C. This could be attributed to the formation high purity of CaO phase from Ca(OH)2 at high temperature.21,22 The adsorption capacities are dropped to 15% and 22% for low carbonation temperature (350 °C and 450 °C). Fig. 13 display the cyclic adsorption capacity of Ca(OH)2 at carbonation temperature of 650 °C. The results showed that a steady decline in the adsorption is observed for both sorbents with increasing number of cycles. This may be attributed to the sintering effect of the sorbent.


image file: c5ra27771j-f12.tif
Fig. 12 CO2 sorption profiles of Ca(OH)2 sorbent synthesized using ethanol/DIW with volume ratio of 78 ml/02 ml at different temperatures.

image file: c5ra27771j-f13.tif
Fig. 13 Carbonation/decarbonation cycles of Ca(OH)2 sorbent synthesized in the solvent volume 78 ml/02 ml of ethanol/DIW.

The CO2 adsorption characteristic of Ca(OH)2 sorbent synthesized from ethanol/DIW was compared with the sorbent synthesized using DMF/DIW. The results are shown in Fig. 14. The sorbent produced using ethanol/DIW exhibited high CO2 adsorption capacity when compared to that of DMF/DIW. This is ascribed to the high surface area and pore volume of the sorbent. And also, DMF has strong binding capability on the Ca(OH)2 surface which may block the active sites for CO2 adsorption.


image file: c5ra27771j-f14.tif
Fig. 14 The comparison of CO2 adsorption capacity of Ca(OH)2 sorbent synthesized using ethanol/DIW and DMF/DIW.

4. Conclusion

In summary, we have successfully studied the effect of solvent on the morphology and CO2 adsorption capacity of Ca(OH)2. The pods like structures have formed at the solvent volume ratio of 80 ml/0 ml and 78 ml/02 ml for ethanol/DIW and DMF/DIW, respectively. A suitable mechanism has been proposed for the formation of pods like structure. XRD result shows that ethanol and DMF could selectively absorb on the crystalline facet and induce anisotropic growth along (0001) direction and retard lateral facet growth along (1010) direction. The pod like structures of Ca(OH)2 sorbent synthesized from ethanol/DIW exhibited good CO2 adsorption capacity when compared to that of DMF/DIW.

Acknowledgements

The authors would like to acknowledge the financial supports received under Postgraduate Fellowship Scheme from University of Islam Antarabangsa Malaysia (UIAM), Ministry of Higher Education (MOHE) Malaysia; Long Term Research Grant (LRGS) (203/PKT/6723001) from Ministry of Higher Education (MOHE) Malaysia and PRGS grant 1001/PBAHAN/8046029.

References

  1. N. N. Hlaing, R. Othman, H. Hinode, W. Kurniawan, A. A. Thant, A. R. Mohamed, C. Salim and S. Sreekantan, Procedia Environ. Sci., 2014, 20, 71–78 CrossRef CAS.
  2. V. Materic and S. I. Smedley, Ind. Eng. Chem. Res., 2011, 50, 5927–5932 CrossRef CAS.
  3. N. N. Hlaing, S. Sreekantan, R. Othman, H. Hinode, W. Kurniawan, A. A. Thant, A. R. Mohamed and C. Salim, Mater. Lett., 2014, 133, 204–207 CrossRef CAS.
  4. A. Roy and J. Bhattacharya, Micro Nano Lett., 2010, 5, 131–134 CAS.
  5. P. López-Arce, L. S. Gómez-Villalba, S. Martínez-Ramírez, M. Álvarez de Buergo and R. Fort, Powder Technol., 2011, 205, 263–269 CrossRef.
  6. M. J. M. Phindile, B. Khoza and L. M. Sikhwivhilu, J. Nanotechnol., 2012, 2012, 195106 Search PubMed.
  7. J. Chandradass, H. Kim and F. W. Y. Momade, Adv. Powder Technol., 2014, 25, 1834–1838 CrossRef CAS.
  8. D. Konopacka-Łyskawa, B. Kościelska and J. Karczewski, J. Cryst. Growth, 2015, 418, 25–31 CrossRef.
  9. L.-L. Yang, Q.-F. Han, J. Zhao, J.-W. Zhu, X. Wang and W.-H. Ma, J. Alloys Compd., 2014, 614, 353–359 CrossRef CAS.
  10. M. Niederberger, Acc. Chem. Res., 2007, 40, 793–800 CrossRef CAS PubMed.
  11. Z. B. H. Tang Yan, G. Xiao-Dong, L. Heng, Z. Yan-Jun, N. Xiang and T. Hong, Acta Phys.–Chim. Sin., 2011, 27, 869–874 Search PubMed.
  12. K. Liu, Z.-R. Shen, Y. Li, S.-D. Han, T.-L. Hu, D.-S. Zhang, X.-H. Bu and W.-J. Ruan, Sci. Rep., 2014, 4, 6023 CAS.
  13. D. Zacher, J. Liu, K. Huber and R. A. Fischer, Chem. Commun., 2009, 9, 1031–1033 RSC.
  14. J. Zhang, L. Sun, J. Yin, H. Su, C. Liao and C. Yan, Chem. Mater., 2002, 14, 4172–4177 CrossRef CAS.
  15. M. Umadevi, A. J. Christy, R. H. Sudha, B. J. M. Rajkumar and V. Ramakrishnan, Spectrochim. Acta, Part A, 2008, 71, 773–778 CrossRef CAS PubMed.
  16. I. Pastoriza-Santos and L. M. Liz-Marzán, Adv. Funct. Mater., 2009, 19, 679–688 CrossRef CAS.
  17. A. Jouyban, S. Soltanpour and H.-K. Chan, Int. J. Pharm., 2004, 269, 353–360 CrossRef CAS PubMed.
  18. L. Xu, Y.-L. Hu, C. Pelligra, C.-H. Chen, L. Jin, H. Huang, S. Sithambaram, M. Aindow, R. Joesten and S. L. Suib, Chem. Mater., 2009, 21, 2875–2885 CrossRef CAS.
  19. J. Blamey, E. J. Anthony, J. Wang and P. S. Fennell, Prog. Energy Combust. Sci., 2010, 36, 260–279 CrossRef CAS.
  20. M. Broda and C. R. Müller, Fuel, 2014, 127, 94–100 CrossRef CAS.
  21. A. Akgsornpeak, T. Witoon, T. Mungcharoen and J. Limtrakul, Chem. Eng. J., 2014, 237, 189–198 CrossRef CAS.
  22. E. P. Reddy and P. G. Smirniotis, J. Phys. Chem. B, 2004, 108, 7794–7800 CrossRef CAS.

This journal is © The Royal Society of Chemistry 2016
Click here to see how this site uses Cookies. View our privacy policy here.