A facile one-step route to synthesize the three-layer nanostructure of CuS/RGO/Ni3S2 and its high electrochemical performance

Kun Wang, Chongjun Zhao*, Zhuomin Zhang, Shudi Min and Xiuzhen Qian
Key Laboratory for Ultrafine Materials of Ministry of Education, Shanghai Key Laboratory of Advanced Polymeric Materials, School of Materials Science and Engineering, East China University of Science and Technology, Shanghai 200237, P.R. China. E-mail: chongjunzhao@ecust.edu.cn; Fax: +86-21-6425-0838; Tel: +86-21-6425-0838

Received 10th December 2015 , Accepted 3rd February 2016

First published on 4th February 2016


Abstract

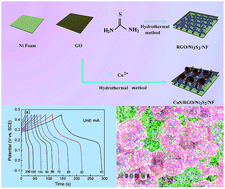
A three-layer nanostructure of a CuS/reduced graphene oxide (RGO)/Ni3S2 composite was in situ grown on nickel foam (NF) through a one-step hydrothermal-assisted process. During this process, the bottom Ni3S2 layer and middle RGO layer were simultaneously formed through the redox reaction of the Ni element on the foam surface of NF with GO and subsequent vulcanization. The upper CuS layer, consisting of sphere and fiber-like blocks, was converted from Cu2+ adsorbed by electrostatic forces and then well anchored on the RGO surface. The binder-free CuS/RGO/Ni3S2 electrode delivered high specific capacitance (10[thin space (1/6-em)]494.5 mF cm−2 at a current density of 40 mA cm−2, i.e., 1692.7 F g−1 at 6.5 A g−1). It also exhibited an excellent cycling stability with ca. 91.5% of the initial capacitance retention after 4000 charge–discharge cycles at a current density of 100 mA cm−2. The good electrochemical performance and simple accessibility prove that this CuS/RGO/Ni3S2 composite is a promising material for supercapacitor applications.

1. Introduction

Supercapacitors, combined with secondary batteries and conventional dielectric capacitors, constitute the basic rechargeable electric storage device system to meet different demands in power density, energy density and lifetime. Nowadays, the main task for supercapacitors is still focused on the exploitation of new electrode materials with excellent electrochemical performance.

Although integrating various semiconductive materials in conventional conductive reagents is successful to make almost any insoluble substances exhibit primary supercapacitor capability, it seldom endows these electrode materials with comprehensive supercapacitor performance in practical applications. It is therefore still necessary to devote effort to enhance the capabilities of various electrode materials, especially composites.

Firstly, integrating pseudocapacitive materials with carbon is an effective strategy, in which carbon materials greatly enhance the electrical conductivity for the electrode.1–3 Especially, when nano-sized carbon material is used, nano-sized and nanoporous structure for pseudocapacitive materials can be easily built, which results in high specific area and thus decreases the current density. Therefore, improved specific capacitance and rate capability are obtained1,2 due to the low electrochemical polarization and complete utilization of nanoporous active materials during charging/discharging process. Graphene is usually a good candidate of carbon component in the composite2,4 because of its high electronic conductivity (16[thin space (1/6-em)]000 S m−1), high specific surface area (2630 m2 g−1, theoretical value) and mechanical properties.5,6

Secondly, designing and tailoring the pseudocapacitive materials is another prior method to further improve the supercapacitor performance.7 Based on the careful selection of potential pseudocapacitive material and its shapes, designing and synthesizing those electrode materials composed of two different metal cations, e.g., ternary or hybrid of two-component of oxides or sulfides, is another effective route to increase the capability, as these two metal cations-containing materials usually exhibit prior performance to the single component ones, which may be attributed to their richer redox reaction.1,8–10

Thirdly, a binder-free design is necessary to further improve the capacitance, especially in specific capacitance and rate ability.11 Also, since binder has no contribution to the capacitance and the insulating binder will decrease the conductivity of the electrode material, it negatively affects the electrochemical performance in both specific capacitance and rate ability. In addition, in order to compensate the deficiency of conductivity, a certain amount of conductivity agents are commonly added in the preparation of the electrode, which will decrease the specific capacitance and energy density due to the macro-sized conductive agent. Therefore, a binder-free route favors the electrochemical performance.

Fourthly, a high areal capacitance plays a key role in determining the practical applications. High capacitance is usually needed in practice, which depends not only on the high specific capacitance, but also on high specific volumetric capacitance (loading amount). A stable, nanoporous architecture is required for this high loading.

Recently, transition metal sulfides have been receiving great interest as electrode materials for supercapacitors in view of their richer redox valences and higher conductivity.12,13 Among various metal sulfides, Ni3S2 is one of the most promising candidates, because of its low cost, environmentally-friendly nature and high theoretical capacitance.14 On the other hand, another sulfide, CuS, is also widely used as electrode materials of lithium-ion batteries,15 and supercapacitor.16,17 However, the composite of two kinds of transition metal sulfides is rarely reported, and hybrid material of CuS/Ni3S2 has not been reported yet.

In this study, CuS/RGO/Ni3S2 composites, in which the upper CuS spheres and nanofibers (covered by a thin nanoflakes layer) supported on the middle RGO layer and bottom Ni3S2 layer, were synthesized on Ni foam. Ni foam acts not only as conducting substrate, but also as Ni source and reducing agent for GO during the preparation process. RGO, acting as a second electron transfer and soft support, well connects the CuS and Ni3S2 layers. The electrode of as-prepared CuS/RGO/Ni3S2/NF composite film exhibits improved supercapacitor performance, e.g., 10[thin space (1/6-em)]494.5 mF cm−2 at 40 mA cm−2, 4930.9 mF cm−2 at 200 mA cm−2, and 105.8% capacitance retention after 1000 cycles at 100 mA cm−2. Even at 4000th cycle the capacitance can still retain 91.5% of the initial value.

2. Experiment

2.1 Materials and reagents

Pristine graphite powder, hydrochloric acid (HCl, 36.0–38.0 wt%), hydrogen peroxide (H2O2, 30 wt%), sulfuric acid (H2SO4, 95–98 wt%), potassium permanganate (KMnO4, ≥99.5%), phosphorus pentoxide (P2O5, ≥98.0%), potassium persulfate (K2S2O8, ≥99.5%), and ethanol (C2H5OH, >99.7 wt%) were obtained from the Shanghai Chemical Co. Copper nitrate trihydrate (Cu(NO3)2·3H2O, 99.0–102.0%) and thiourea (CH4N2S, ≥99.0%) were purchased from the Sinopharm Chemical Reagent Co. Nickel foam (hereinafter referred to as NF) was obtained from Keliyuan (Hunan). All of the chemical reagents were used as received without any further purification. Water used was deionized.

2.2 Preparation of CuS/RGO/Ni3S2, CuS/Ni3S2, RGO/Ni3S2, and Ni3S2 on NF

Prior to synthesis, NF was carefully cleaned with acetone, ethanol, and deionized water in an ultrasound bath to remove surface impurities, respectively.

Graphene oxide (GO) was prepared from pristine graphite powder based on a modified Hummers method.18 The synthesis of CuS/RGO/Ni3S2 composite was carried out through a hydrothermal process by immersing the cleaned Ni foam in a mixture solution of GO, copper salt and thiourea. Typically, GO (30 mg) and Cu(NO3)2·3H2O (1 mmol) were added in deionized water (50 ml) under ultrasonication for 30 min. Thiourea (2 mmol) was subsequently dissolved into this solution. The NF (1 × 2 cm2) with a bared area of 1 × 1 cm2 was then immersed in this aqueous solution. The mixture was loaded into a Teflon-lined stainless steel autoclave (100 ml in volume) for hydrothermal reaction at various temperatures (i.e., 150 °C, 180 °C and 210 °C) for different duration (12 h, 24 h and 36 h). The final products were washed with water and ethanol in turn, and then dried in a vacuum oven at 80 °C for 12 h. The samples of CuS/RGO/Ni3S2/NF composites were denoted as CRNS-150-24, CRNS-180-24, CRNS-210-24, CRNS-180-12, and CRNS-180-36 respectively according to the hydrothermal treatment conditions. CuS/Ni3S2/NF (CNS-180-24), RGO/Ni3S2/NF (RNS-180-24) and Ni3S2/NF (NS-180-24) composites were prepared under identical conditions (180 °C, 24 h) as the compared samples.

2.3 Characterizations

The structure and the diffraction pattern of the as-prepared materials were performed by wide-angle (10°–80°, 40 kV/200 mA) powder X-ray diffraction (XRD) using an X-ray diffractometer with Cu Kα (λ = 0.15406 nm). X-ray photoelectron spectroscopy (XPS) was performed on ESCALAB 250Xi. The morphology and elementary composition of the samples were characterized using a field emission scanning electron microscope (FESEM, S4800), a transmission electron microscope (TEM, JEM 2100), and energy dispersive spectrometer (EDS, Bruker, AXS, Quantax 400-30), respectively.

2.4 Electrochemical measurements

The measurements were carried out in an aqueous solution of 6 mol L−1 KOH using a three-electrode system. The composite samples with a geometric area of 1 × 1 cm2, a Pt foil (2 × 3 cm2), and a saturated calomel electrode (SCE) were used as working electrodes, counter electrode, and reference electrode, respectively. The electrochemical performances of the as-prepared materials were measured using a CHI 660E workstation. The loading amount of CuS/RGO/Ni3S2 (weight of active material) was determined by the weight difference of the above electrode before testing and after ultrasonic treatment with hydrochloric acid using an electronic balance,4,19 which was determined to be 6.2 mg.

3. Results and discussion

3.1 XPS, and XRD patterns of CuS/RGO/Ni3S2 nanocomposite

X-ray photoelectron spectroscopy (XPS) was shown in Fig. 1a–d. It is reasonable to divide the C 1s spectrum of CRNS (Fig. 1a) into three peaks at 284.6, 286.7, and 288.4 eV which correlated with C–C, C–O, and C[double bond, length as m-dash]O, respectively.20,21 The peak intensities of C–O and C[double bond, length as m-dash]O for the composite are much smaller than those for pure GO powder in previous work,22 suggesting considerable deoxygenation after hydrothermal treatment. Furthermore, in Fig. 1b, two main peaks at 856.6 and 874.5 eV in the Ni 2p XPS spectrum are assigned to Ni 2p3/2 and Ni 2p1/2 of Ni3S2, respectively.23–25 On the other hand, the Cu 2p XPS spectra of the composite (Fig. 1c) exhibits two peaks at 934.4 and 954.4 eV, which are corresponded to the Cu 2p3/2 and Cu 2p1/2 spin–orbit peaks of the CuS phase, respectively.26 The Cu 2p3/2–Cu 2p1/2 spin-energy separation is 20 eV. Moreover, the existence of Cu2+ in the sample can be further confirmed by the two extra shake-up peaks at 942.8 eV and 964.6 eV, which are positioned at higher binding energies compared to the main peaks, implying the presence of an unfilled Cu 3d9 shell of Cu2+.22 The peak at 162.2 eV for S 2p is demonstrated in Fig. 1d, indicating the presence of S2− in the composite.27,28 Hence, XPS results indicate the presence of CuS, Ni3S2 and RGO component in the CuS/RGO/Ni3S2/NF.
image file: c5ra26428f-f1.tif
Fig. 1 XPS spectrums of CRNS composite: (a) C 1s spectrum; (b) Ni 2p spectrum; (c) Cu 2p spectrum; and (d) the survey spectrum of the CRNS composite.

XRD was conducted in order to determine the crystalline properties of the CuS/RGO/Ni3S2, and Fig. 2 gives the XRD patterns of CuS/RGO/Ni3S2, RGO/Ni3S2 and Ni3S2 prepared at 180 °C for 24 h. It is clear that three peaks at 44.5°, 51.9°, and 76.4° appear in the patterns of all these three composite samples, which are ascribed to the (111), (200), and (220) planes of metallic nickel (JCPDS no. 04-0850), respectively.19 Furthermore, characteristic diffraction peaks of Ni3S2 (JCPDS no. 44-1418) also emerge in all the three composites.29,30 Referring to CRNS, peaks corresponding to CuS are not found, although it is clearly determined in XPS and EDS, suggesting that CuS in the composite is in the amorphous form.31


image file: c5ra26428f-f2.tif
Fig. 2 XRD patterns of CRNS-180-24, RNS-180-24, and NS-180-24.

3.2 FESEM images, EDS, and TEM images of the CuS/RGO/Ni3S2 composite

Fig. 3a–d show the FESEM images of CRNS-180-24 composites. Compared with the smooth surface of untreated Ni foam (inset of Fig. 3a), the surface of CRNS-180-24 is rough and covered with a coating, as shown in Fig. 3a. The upper layer consists of two kinds of building blocks: spheres and nanofibers. Furthermore, a thin layer network consisting of ultrathin sheets (several nanometers in thickness) with porous structures grows on the spheres and nanofibers building blocks (Fig. 3b and c and the insets). All these spherical, fabric and network-like structures can be attributed to the formation of CuS, as they disappear in the absence of Cu salt. On the other hand, the lower layer of Ni3S2 (Fig. 3d), nest-like film fabricated by the assembly of vertically arrayed nanoflakes is also obviously visible at the bared zone, which is consistent with the morphology of RGO/Ni3S2 in our previous work.28 Both CuS spheres, nanofibers layer and Ni3S2 nanoflakes layer possess highly open and porous hierarchical structures, making most of the surface area readily accessible to liquid electrolyte, which is able to provide efficient channels for electron transport.32 These indicate that the presence of CuS strongly influences the arrangement and structure of the composite sheets, and facilitates the formation of layer-by-layer structure of CuS/RGO/Ni3S2/NF composite films. In addition, the RGO sheets are efficiently and uniformly distributed on the surface of nickel substrate, which provides a large surface area for the interconnected and uniform films. Thus, CuS/RGO/Ni3S2 composite with a layer-by-layer structure has formed through this one-pot hydrothermal route.33 It is worth noting that the RGO in the composite cannot be clearly observed in the FESEM images (Fig. 3). The reason is that ultrathin RGO coated on the Ni3S2 nanosheet is difficult to be distinguished from lower Ni3S2 nanosheets layer. This conjecture will be proven in the TEM images.
image file: c5ra26428f-f3.tif
Fig. 3 FESEM images of different area of CRNS-180-24 (a–d) and nickel foam (a inset).

Energy-dispersive X-ray spectroscopy (EDS) mappings are performed in order to further confirm the composition and elements distribution of the different layer. Fig. 4a–e show the elemental mapping of carbon (Fig. 4a), oxygen (Fig. 4b), copper (Fig. 4c), nickel (Fig. 4d), and sulfur (Fig. 4e) of CuS/RGO/Ni3S2 for the corresponding overlay image in Fig. 4f. Obviously, Ni signal is weak at those areas occupied by CuS spheres or fibers, while it is strong at those unoccupied zone (Fig. 4d), which is especially distinct in the sample with big sphere blocks (Fig. S1a, b and the inset). These indicate that Ni3S2 is firstly generated at the lower layer close to the Ni surface, while the upper CuS layer is subsequently formed, which is consistent with the SEM images.


image file: c5ra26428f-f4.tif
Fig. 4 EDS mapping of CRNS composite: (a) C elements (blue); (b) O elements (cyan); (c) Cu elements (red); (d) Ni elements (green); (e) S elements (purple); (f) corresponding overlay of C, O, Cu, Ni and S elements.

Fig. 5 shows the typical TEM images for the CRNS-180-24 composite. A thin layer is clearly observed which covers both the CuS fiber and spheres. In addition, networks of nanoflakes are also visible on the CuS fiber surface (within the rectangle line), which is expected to be combination of CuS and Ni3S2 nanosheets from the bottom layer. This structure leads to open and porous three-dimensional structures, which is beneficial to electrolyte access and electron transport during electrochemical reactions.34 In the HRTEM image (Fig. 5c), the lattice of the nanoflakes is 0.18 nm which can be assigned to the (211) plane of Ni3S2. The concentric rings of selected area electron diffraction (SAED) pattern given in the inset of Fig. 5c confirms the polycrystallinity of the Ni3S2 nanoflakes.29


image file: c5ra26428f-f5.tif
Fig. 5 TEM and HRTEM images (a–c) and SAED image (c inset) of CRNS-180-24 composite.

3.3 Mechanism for the formation of CuS/RGO/Ni3S2 composite

We propose a possible formation route to the CRNS composite based on the experimental results and our earlier works.4,28,30 As illustrated in Fig. 6, during the hydrothermal process, Ni on the foam is directly oxidized into Ni(OH)2, and simultaneously GO is reduced to RGO, which successfully covers the surface of the Ni(OH)2 layer4 and further conversion into Ni3S2/RGO composite during the hydrothermal process.28,30 At the same time, an array of highly porous CuS nanoflakes converted from Cu2+ in the solution are vertically packed on the top side of the RGO, and then make up CuS spheres and nanofibers, eventually forming a multilayer diverse structure CuS/RGO/Ni3S2 film on Ni foam substrate. GO with its good solubility and negative electrostatic charge also makes for the uniform anchoring of the CuS array onto the surface of the GO to fabricate a three-dimensional (3D) porous diverse structure,35–37 which is consistent with the SEM images. Obviously, RGO plays a key role in assembling the layer-by-layer CuS/RGO/Ni3S2/NF structure.
image file: c5ra26428f-f6.tif
Fig. 6 Schematic representation of the formation process of the RGO/Ni3S2/NF (RNS) and CuS/RGO/Ni3S2/NF (CRNS) composites.

3.4 Electrochemical performance

CV has been considered to be a suitable electrochemical technology for estimating the difference between the non-faradaic and faradaic reaction. Fig. 7a presents CV curves of the CRNS electrode materials synthesized at different hydrothermal conditions at the scan rate of 10 mV s−1. Obviously, at the potential range of −0.1 to 0.6 V (vs. SCE), all of the CV curves exhibit a pair of strong redox peaks which are different from those of electric double-layer capacitors, implying the presence of a reversible faradic reaction behaviour. The current output in the CV curves throughout the scan range for the CRNS-180-24 composite is higher than that of the other composite electrodes at the same scan rate, indicating higher specific capacitance.
image file: c5ra26428f-f7.tif
Fig. 7 CV curves of: (a) CRNS-150-24, CRNS-180-12, CRNS-180-24, CRNS-180-36, and CRNS-210-24 at 10 mV s−1; (b) CRNS-180-24, CNS-180-24, RNS-180-24, and NS-180-24 at 10 mV s−1; (c) CRNS-180-24 at various scan rates.

Additionally, it is observed that the CRNS-180-24 exhibits much better performance than CNS-180-24, RNS-180-24 and NS-180-24 (Fig. 7b), which may be attributed to the enhanced electrical conductivity, fast electron transport and the rapid ion diffusion of CRNS-180-24. This is because that the RGO acts as both a basal plane for growth of CuS and a connect linker for upper and bottom layers, and there exists synergistic interaction between the RGO and two metal sulfides, which probably comes from the linkage of thiol bonds between residual surface group of the RGO and two metal sulfides, and thus achieves a higher specific capacitance.9,38,39

For CRNS-180-24, apart from the faradaic redox reactions related to Ni3S2/Ni3S2(OH)3,30 the conversion reaction of CuS/CuSOH is also involved in the potential range of −0.1 to 0.6 V (vs. SCE).16,40,41 The reversible reactions in the alkaline electrolyte are suggested as follows.

 
Ni3S2 + 3OH ↔ Ni3S2(OH)3 + 3e (1)
 
CuS + OH ↔ CuSOH + e (2)

These amorphous CuS spheres and fibers favor to supply a high specific surface area and thus enhance specific capacitance.42,43

Fig. 7c shows CVs of the CRNS-180-24 with various scan rates. In the range of −0.1 to 0.6 V, no obvious distortion is observed in the CV curves with the increase of scan rates, which is an indication of good capacitive behavior. The obvious increase of current with scan rates indicates a good reversibility process for this electrode. With the increase of scan rate, the difference decreases between electrode surface and the diffusion layer, which results in increased flux to the electrode surface and achieves a higher current.9 For comparison, the peak position of the CV changes, which may be caused by a small equivalent series resistance and weak polarization of the electrodes.44 Moreover, cyclic voltammetry curves expressed as specific capacitance vs. cell potential for CRNS-180-24 at various scan rates are shown in Fig. S2.

Galvanostatic charge–discharge (GCD) measurements performed on the three electrodes in a potential window from −0.1 to 0.45 V provide a complementary measurement of the capacitance. The specific capacitance is calculated according to the following equation:

 
image file: c5ra26428f-t1.tif(3)
where I (A) is the discharge current, m (g) the mass of the active material, ΔV (V) the potential window; and Δt the discharge time. Fig. 8a shows the galvanostatic discharge curves of CRNS-180-24 at different current densities (40–200 mA cm−2) in the potential window of −0.1 to 0.45 V. The shapes of GCD curves also confirm their characteristics of faradaic performance.9,45 As shown in Fig. 8a, the capacitance mainly corresponds to the pseudo-capacitance, which is in accordance with the CV results. When the discharge current density increases from 40 mA cm−2 to 200 mA cm−2, i.e. from 6.5 A g−1 to 32.3 A g−1, an excellent rate of supercapacitor performance is observed: 10[thin space (1/6-em)]494.5 mF cm−2 vs. 4930.9 mF cm−2, i.e. 1692.7 F g−1 to 795.3 F g−1, suggesting this electrode material is suitable for working under high current density. To the best of our knowledge, this specific capacitance value is higher than those CuS materials as supercapacitor electrodes,16,17,40,46–50 and even higher than that of Ni3S2,9,51–60 which is listed in Table 1. This great enhancement of specific capacitance is not only attributed to the synergistic effect resulting from the more active sites offered by RGO nanosheets and the quick electron transport of the highly interconnected hybrid nanoflakes, but also to the well-defined open porous nanostructure directly grown on the conductive substrate. This porous nanostructure allows easy access of electrolyte to all of the nanoflakes and thus facilitates charge transport and ion diffusion without any blocks of a binder.


image file: c5ra26428f-f8.tif
Fig. 8 (a) GCD curves at various current densities; and (b) cycling ability at 100 mA cm−2 of CRNS-180-24.
Table 1 Electrochemical performances of different CuS- or Ni3S2-based electrode materials
Electrode material Electrode preparation Specific capacitance (electrolyte) Capacitance retention Ref.
CNT@CuS Pressed on Ni foam 110 F g−1 (2.9 A g−1) (2 M KOH) 100% after 1000 cycles 16
CuS On glassy carbon electrode 597 F g−1 (1 A g−1) (2 M KOH) 80% after 1000 cycles 17
CuS On Cu foil 274 F g−1 (5 mA cm−2) (1 M KOH) 87% after 5000 cycles 40
CuS@ppy 427 F g−1 (1 A g−1) (1 M KCl) 88% after 1000 cycles 47
CuS On FTO substrates 72.85 F g−1 (5 mV s−1) (1 M LiClO4) 86.09% after 100 cycles 48
CuS Pressed on Ni foam 833.3 F g−1 (1 A g−1) (6 M KOH) 75.4% after 500 cycles 49
CuS On stainless steel substrates 101.34 F g−1 (5 mV s−1) (1 M NaOH) 81% after 1000 cycles 50
Ni@rGO-Ni3S2 Grown on Ni foam 625 F g−1 (12 A g−1) (6 M KOH) 97.9% after 3000 cycles 9
Bacteria-RGO/Ni3S2 Grown on Ni foam 962 F g−1 (15 A g−1) (2 M KOH) 89.6% after 3000 cycles 51
Ni3S2/MWCNT Pressed on Ni foam 806 F g−1 (3.2 A g−1) (2 M KOH) 80% after 1000 cycles 52
CNT@Ni3S2 Pressed on Ni foam 480 F g−1 (5.3 A g−1) (2 M KOH) 88% after 1500 cycles 53
Ni3S2/Ni Grown on Ni foam 1293 F g−1 (5 mA cm−2) (1 M KOH) 69% after 1000 cycles 54
Carbon coated-Ni3S2-RGO Dropped onto Ni foam 996.7 F g−1 (5 A g−1) (3 M KOH) 98.6% after 500 cycles 55
Ni3S2 Grown on Ni foam 639.2 F g−1 (4 A g −1) (1 M KOH) 626.1 F g−1 (5 A g −1) after 2000 cycles 56
Ni3S2@Ni(OH)2/RGO Grown on Ni foam 1003 F g−1 (5.9 A g−1) (3 M KOH) 99.1% after 2000 cycles 57
Ni3S2/CNFs Pressed on Ni foam 814 F g−1 (4 A g−1) (2 M KOH) 83.5% after 1000 cycles 58
Ni3S2/graphene Grown on Ni foam 1420 F g−1 (2 A g−1) (1 M KOH) About 99.4% after 2000 cycles 59
Ni filled-Ni3S2/rGO Pressed on Ni foam 833.3 F g−1 (10 A g−1) (2 M KOH) 92% after 1000 cycles 60
CuS/RGO/Ni3S2/Ni Grown on Ni foam 1692.7 F g−1 (6.5 A g−1) (6 M KOH) 91.5% after 4000 cycles This work


Table 2 presents the specific capacitance of the samples synthesized at different hydrothermal conditions. The capacitance increases with the increase of preparation temperature from 150 to 180 °C, while it decreases when the temperature increases further from 180 °C to 210 °C. The capacitance is affected by the duration of hydrothermal treatment experiences and has the similar trend, i.e. Cs (CRNS-180-24) > Cs (CRNS-180-12) > Cs (CRNS-180-36). Therefore, the sample prepared at 180 °C for 24 h shows the best performance (10[thin space (1/6-em)]494.5 mF cm−2), which is much better than CNS-180-24 (2728.7 mF cm−2) and RNS-180-24 (6407.3 mF cm−2). According to the charging and discharging capacitances, coulombic efficiencies are also calculated and listed in Table S1. It is clear that the coulombic efficiencies are higher than 90% at the various current densities, suggesting the excellent reversibility.

Table 2 Specific capacitance of all the samples synthesized at different conditions at various current rates
Samples Specific capacitance (mF cm−2)
40 mA cm−2 60 mA cm−2 80 mA cm−2 100 mA cm−2 150 mA cm−2 200 mA cm−2
CRNS-180-24 10[thin space (1/6-em)]494.5 9016.4 7979.6 6356.4 5694.5 4930.9
CRNS-180-12 7003.6 6007.6 5329.5 4705.5 3466.4 2838.2
CRNS-180-36 2062.5 1533.8 1237.8 1021.1 711.3 581.5
CRNS-150-24 3524.4 2745.8 2289.5 1898.2 1195.4 872.4
CRNS-210-24 2726.5 2038.9 1643.6 1367.3 900 764.4
CNS-180-24 2728.7 2253.8 1917.1 1712.7 1364.5 1200.7
RNS-180-24 6407.3 4946.2 4007.3 3518.2 2072.2 1088.7


Long-term cycling stability was tested by performing continuous charge–discharge cycles at a constant discharge current density of 100 mA cm−2. As shown in Fig. 8b, the CRNS composite electrode also exhibits good cycling stability, with the specific capacitance gradually rising from 6356.4 mF cm−2 to 6727.3 mF cm−2 after 1000 cycles. The capacitance retention is 105.8%, which is much higher than our previous work (RGO/Ni3S2: 90.98% capacitance retention after 1000 cycles).28 Additionally, it has 91.5% capacitance retention even after 4000 cycles (Fig. 8b inset). Compared to other reports about Ni3S2- or CuS-based materials,9,16,17,40,47–60 the cyclability of CRNS is greatly improved, which can be seen in Table 1. Moreover, the increased effective interfacial area among CuS, Ni3S2, and electrolyte also improves the stability. In fact, the integrated multilayer films of CuS/RGO/Ni3S2 in situ grown on NF substrate provide a shortened diffusion path for both electrons and ions, which will improve charge–discharge efficiency, and restrain the stress caused by the volume change during the process of charging/discharging,61 leading to better cycling performance. It is worth noting the role of RGO in the CuS/RGO/Ni3S2 composites: RGO connects CuS and Ni3S2 well. Moreover, due to its soft and high mechanical properties, RGO will buffer the volume changes of metal sulfides during the consecutive charging/discharging process. In addition, the strongly bonding may be ascribed to chemical covalent bonding and Van der Waals interaction between the RGO and the metal sulfides. Thus, all components in the multilayer structure are close-knit connected with each other, which minimizes the possibility of degradation of the electrode material.9

Fig. 9a presents the Nyquist plots of CRNS at different potentials. All the Nyquist plots consist of one semicircle at the high-middle frequency region, which is related to the charge transfer process occurring at the electrode/electrolyte interface, and one straight line at the low frequency region, which corresponds to the electrochemical process and mass transfer process, respectively.62 An equivalent circuit (inset in Fig. 9a) fitting the EIS plots is composed of an equivalent series resistance (Rs), a charge transfer resistance (Rct), a double layer (Cdl), a capacitive element (Cps) and Warburg impedance (W). The X-intercept of the Nyquist plot at high frequency represents the equivalent series resistance (Rs) of the electrodes, whereas, the diameter of the semicircle corresponds to the resistance of charge transfer (Rct) at the contact interface between the electrodes and electrolyte solution.8,63 The key factors determining high energy and power density are a maximum value of Cdl and a minimum value of Rs.64 According to Fig. 9a, Nyquist plots of CRNS and RNS electrodes were recorded at 0.2 V in the frequency range from 100 kHz to 0.01 Hz (Fig. 9b). The interconnected porous structure can provide higher specific surface area, which can not only increase the number of electrochemically active sites for the redox reaction, but also enhance sufficient contact between the electrolyte and electrode. Besides, the enhanced accessible surface can improve the electronic conductivity, and thus reduce the charge transfer resistance.45,65 In the plots, it can be confirmed that the CRNS has smaller Rs value (0.50 Ω) than that of RNS (0.86 Ω) and the Rct value for the CRNS sample are smaller than 0.1 Ω, which is also lower than the RNS (0.24 Ω). In addition, the CRNS composite electrode exhibits a line that is close to vertical at the low frequency region, indicating that the CRNS composite is suitable for being used as an electrode material for supercapacitors. Due to the low resistance of CuS/RGO/Ni3S2 and the contact resistance between CuS/RGO/Ni3S2 and substrate NF, it is expected to raise the upper limit of the high charge–discharge rate of the supercapacitor.


image file: c5ra26428f-f9.tif
Fig. 9 Nyquist plots: CRNS-180-24 under various potentials (a) and the corresponding equivalent circuit (inset in a), and CRNS-180-24, RNS-180-24 electrode materials at 0.2 V (b).

4. Conclusions

Layer-by-layer CuS/RGO/Ni3S2 nanocomposite has been synthesized on Ni foam through a facial one-pot hydrothermal method. In the composite, RGO acts as a conductive agent and a soft support which efficiently connects CuS and Ni3S2. Based on the synergistic effects of CuS, Ni3S2 and RGO, the electrochemical performance is greatly improved with a high capacitance of 10[thin space (1/6-em)]494.5 mF cm−2 (1692.7 F g−1) at 40 mA cm−2 (6.5 A g−1) and still maintains 4930.9 mF cm−2 (795.3 F g−1) at the current density of 200 mA cm−2 (32.3 A g−1). In addition, it exhibits excellent capacitance retention of 91.5% after 4000 cycle tests.

Acknowledgements

We are grateful for the support of the National Natural Science Foundation of China (No. 20504026), the Shanghai Natural Science Foundation (No. 13ZR1411900), the Shanghai Leading Academic Discipline Project (No. B502), the Shanghai Key Laboratory Project (No. 08DZ2230500), and the EU FP7 Staff Exchange program (No. PIRSES-GA-2012-318990-ELEKTRONANOMAT).

References

  1. M. Sun, J. Tie, G. Cheng, T. Lin, S. Peng, F. Deng, F. Ye and L. Yu, J. Mater. Chem. A, 2015, 3, 1730–1736 CAS.
  2. J. W. Lee, T. Ahn, D. Soundararajan, J. M. Ko and J.-D. Kim, Chem. Commun., 2011, 47, 6305–6307 RSC.
  3. H. Jiang, D. Ren, H. Wang, Y. Hu, S. Guo, H. Yuan, P. Hu, L. Zhang and C. Li, Adv. Mater., 2015, 27, 3687–3695 CrossRef CAS PubMed.
  4. S. Min, C. Zhao, G. Chen and X. Qian, Electrochim. Acta, 2014, 115, 155–164 CrossRef CAS.
  5. M. D. Stoller, S. Park, Y. Zhu, J. An and R. S. Ruoff, Nano Lett., 2008, 8, 3498–3502 CrossRef CAS PubMed.
  6. C.-H. Park, F. Giustino, C. D. Spataru, M. L. Cohen and S. G. Louie, Nano Lett., 2009, 9, 4234–4239 CrossRef CAS PubMed.
  7. W. Li, J. Shao, Q. Liu, X. Liu, X. Zhou and J. Hu, Electrochim. Acta, 2015, 157, 108–114 CrossRef CAS.
  8. Y. Li, L. Cao, L. Qiao, M. Zhou, Y. Yang, P. Xiao and Y. Zhang, J. Mater. Chem. A, 2014, 2, 6540–6548 CAS.
  9. D. Ghosh and C. K. Das, ACS Appl. Mater. Interfaces, 2015, 7, 1122–1131 CAS.
  10. W. Li, G. Li, J. Sun, R. Zou, K. Xu, Y. Sun, Z. Chen, J. Yang and J. Hu, Nanoscale, 2013, 5, 2901–2908 RSC.
  11. W. Li, K. Xu, L. An, F. Jiang, X. Zhou, J. Yang, Z. Chen, R. Zou and J. Hu, J. Mater. Chem. A, 2014, 2, 1443–1447 CAS.
  12. Z. Stević and M. Rajčić-Vujasinović, J. Power Sources, 2006, 160, 1511–1517 CrossRef.
  13. F. Tao, Y.-Q. Zhao, G.-Q. Zhang and H.-L. Li, Electrochem. Commun., 2007, 9, 1282–1287 CrossRef CAS.
  14. J.-S. Kim, H.-J. Ahn, H.-S. Ryu, D.-J. Kim, G.-B. Cho, K.-W. Kim, T.-H. Nam and J. H. Ahn, J. Power Sources, 2008, 178, 852–856 CrossRef CAS.
  15. J. S. Chung and H. J. Sohn, J. Power Sources, 2002, 108, 226–231 CrossRef CAS.
  16. T. Zhu, B. Xia, L. Zhou and X. Wen Lou, J. Mater. Chem., 2012, 22, 7851–7855 RSC.
  17. H. Peng, G. Ma, J. Mu, K. Sun and Z. Lei, Mater. Lett., 2014, 122, 25–28 CrossRef CAS.
  18. W. S. Hummers Jr and R. E. Offeman, J. Am. Chem. Soc., 1958, 80, 1339 CrossRef.
  19. K. Wang, C. Zhao, S. Min and X. Qian, Electrochim. Acta, 2015, 165, 314–322 CrossRef CAS.
  20. S. Pei and H.-M. Cheng, Carbon, 2012, 50, 3210–3228 CrossRef CAS.
  21. J. Yan, W. Sun, T. Wei, Q. Zhang, Z. Fan and F. Wei, J. Mater. Chem., 2012, 22, 11494–11502 RSC.
  22. K. Wang, X. Dong, C. Zhao, X. Qian and Y. Xu, Electrochim. Acta, 2015, 152, 433–442 CrossRef CAS.
  23. J. Zhu, Y. Li, S. Kang, X.-L. Wei and P. K. Shen, J. Mater. Chem. A, 2014, 2, 3142–3147 CAS.
  24. B. Zhang, X. Ye, W. Dai, W. Hou and Y. Xie, Chem.–Eur. J., 2006, 12, 2337–2342 CrossRef CAS PubMed.
  25. S. Pan, J. Zhu and X. Liu, New J. Chem., 2013, 37, 654–662 RSC.
  26. J. Qian, K. Wang, Q. Guan, H. Li, H. Xu, Q. Liu, W. Liu and B. Qiu, Appl. Surf. Sci., 2014, 288, 633–640 CrossRef CAS.
  27. W. Wei, L. Mi, Y. Gao, Z. Zheng, W. Chen and X. Guan, Chem. Mater., 2014, 26, 3418–3426 CrossRef CAS.
  28. Z. Zhang, C. Zhao, S. Min and X. Qian, Electrochim. Acta, 2014, 144, 100–110 CrossRef CAS.
  29. S.-W. Chou and J.-Y. Lin, J. Electrochem. Soc., 2013, 160, D178–D182 CrossRef CAS.
  30. Z. Zhang, Q. Wang, C. Zhao, S. Min and X. Qian, ACS Appl. Mater. Interfaces, 2015, 7, 4861–4868 CAS.
  31. P. V. Quintana-Ramirez, M. C. Arenas-Arrocena, J. Santos-Cruz, M. Vega-Gonzalez, O. Martinez-Alvarez, V. M. Castano-Meneses, L. S. Acosta-Torres and J. Fuente-Hernandez, Beilstein J. Nanotechnol., 2014, 5, 1542–1552 CrossRef PubMed.
  32. Q. Wang, R. Gao and J. Li, Appl. Phys. Lett., 2007, 90, 143107/1–143107/3 CAS.
  33. Q. Pan, J. Xie, S. Liu, G. Cao, T. Zhu and X. Zhao, RSC Adv., 2013, 3, 3899–3906 RSC.
  34. J. Pu, F. Cui, S. Chu, T. Wang, E. Sheng and Z. Wang, ACS Sustainable Chem. Eng., 2014, 2, 809–815 CrossRef CAS.
  35. S. Min, C. Zhao, Z. Zhang, G. Chen, X. Qian and Z. Guo, J. Mater. Chem. A, 2015, 3, 3641–3650 CAS.
  36. L. Wang, X. Li, T. Guo, X. Yan and B. K. Tay, Int. J. Hydrogen Energy, 2014, 39, 7876–7884 CrossRef CAS.
  37. J. T. Zhang, S. Liu, G. L. Pan, G. R. Li and X. P. Gao, J. Mater. Chem. A, 2014, 2, 1524–1529 CAS.
  38. S. Peng, L. Li, C. Li, H. Tan, R. Cai, H. Yu, S. Mhaisalkar, M. Srinivasan, S. Ramakrishna and Q. Yan, Chem. Commun., 2013, 49, 10178–10180 RSC.
  39. H. Geng, S. F. Kong and Y. Wang, J. Mater. Chem. A, 2014, 2, 15152–15158 CAS.
  40. Y.-K. Hsu, Y.-C. Chen and Y.-G. Lin, Electrochim. Acta, 2014, 139, 401–407 CrossRef CAS.
  41. L. Qian, X. Tian, L. Yang, J. Mao, H. Yuan and D. Xiao, RSC Adv., 2013, 3, 1703–1708 RSC.
  42. G. Wang, L. Zhang and J. Zhang, Chem. Soc. Rev., 2012, 41, 797–828 RSC.
  43. W. Wei, X. Cui, W. Chen and D. G. Ivey, Chem. Soc. Rev., 2011, 40, 1697–1721 RSC.
  44. D. Wang, Y. Li, Q. Wang and T. Wang, J. Solid State Electrochem., 2011, 16, 2095–2102 CrossRef.
  45. J. Zhang, H. Feng, J. Yang, Q. Qin, H. Fan, C. Wei and W. Zheng, ACS Appl. Mater. Interfaces, 2015, 7, 21735–21744 CAS.
  46. X.-Y. Yu, L. Yu, L. Shen, X. Song, H. Chen and X. W. D. Lou, Adv. Funct. Mater., 2014, 24, 7440–7446 CrossRef CAS.
  47. H. Peng, G. Ma, K. Sun, J. Mu, H. Wang and Z. Lei, J. Mater. Chem. A, 2014, 2, 3303–3307 CAS.
  48. C. Justin Raj, B. C. Kim, W.-J. Cho, W.-G. Lee, Y. Seo and K.-H. Yu, J. Alloys Compd., 2014, 586, 191–196 CrossRef CAS.
  49. K.-J. Huang, J.-Z. Zhang and Y. Fan, J. Alloys Compd., 2015, 625, 158–163 CrossRef CAS.
  50. K. Krishnamoorthy, G. K. Veerasubramani, A. N. Rao and S. Jae Kim, Mater. Res. Express, 2014, 1, 035006 CrossRef.
  51. H. Zhang, X. Yu, D. Guo, B. Qu, M. Zhang, Q. Li and T. Wang, ACS Appl. Mater. Interfaces, 2013, 5, 7335–7340 CAS.
  52. C. S. Dai, P. Y. Chien, J. Y. Lin, S. W. Chou, W. K. Wu, P. H. Li, K. Y. Wu and T. W. Lin, ACS Appl. Mater. Interfaces, 2013, 5, 12168–12174 CAS.
  53. T. Zhu, H. B. Wu, Y. Wang, R. Xu and X. W. D. Lou, Adv. Energy Mater., 2012, 2, 1497–1502 CrossRef CAS.
  54. K. Krishnamoorthy, G. K. Veerasubramani, S. Radhakrishnan and S. J. Kim, Chem. Eng. J., 2014, 251, 116–122 CrossRef CAS.
  55. L. Ma, X. Shen, Z. Ji, S. Wang, H. Zhou and G. Zhu, Electrochim. Acta, 2014, 146, 525–532 CrossRef CAS.
  56. Z. Zhang, Z. Huang, L. Ren, Y. Shen, X. Qi and J. Zhong, Electrochim. Acta, 2014, 149, 316–323 CrossRef CAS.
  57. W. Zhou, X. Cao, Z. Zeng, W. Shi, Y. Zhu, Q. Yan, H. Liu, J. Wang and H. Zhang, Energy Environ. Sci., 2013, 6, 2216–2221 CAS.
  58. W. Yu, W. Lin, X. Shao, Z. Hu, R. Li and D. Yuan, J. Power Sources, 2014, 272, 137–143 CrossRef CAS.
  59. Z. Zhang, X. Liu, X. Qi, Z. Huang, L. Ren and J. Zhong, RSC Adv., 2014, 4, 37278–37283 RSC.
  60. X. Ou, L. Gan and Z. Luo, J. Mater. Chem. A, 2014, 2, 19214–19220 CAS.
  61. Z.-S. Wu, W. Ren, L. Wen, L. Gao, J. Zhao, Z. Chen, G. Zhou, F. Li and H.-M. Cheng, ACS Nano, 2010, 4, 3187–3194 CrossRef CAS PubMed.
  62. Y. Li, S. Chang, X. Liu, J. Huang, J. Yin, G. Wang and D. Cao, Electrochim. Acta, 2012, 85, 393–398 CrossRef CAS.
  63. Y. Dall’Agnese, P.-L. Taberna, Y. Gogotsi and P. Simon, J. Phys. Chem. Lett., 2015, 6, 2305–2309 CrossRef PubMed.
  64. E. Frackowiak and F. Béguin, Carbon, 2001, 39, 937–950 CrossRef CAS.
  65. M. Chhowalla, H. S. Shin, G. Eda, L.-J. Li, K. P. Loh and H. Zhang, Nat. Chem., 2013, 5, 263–275 CrossRef PubMed.

Footnote

Electronic supplementary information (ESI) available. See DOI: 10.1039/c5ra26428f

This journal is © The Royal Society of Chemistry 2016
Click here to see how this site uses Cookies. View our privacy policy here.