 Open Access Article
Influence of silica nanoparticles on mass transfer in a membrane-based micro-contactor†
Seyedeh-Saba
Ashrafmansouri
ab,
Stefan
Willersinn
a,
Mohsen Nasr
Esfahany
b and
Hans-Jörg
Bart
*a
aChair of Separation Science and Technology, University of Kaiserslautern, Kaiserslautern, Germany. E-mail: bart@mv.uni-kl.de; Web: http://www.mv.uni-kl.de/tvt Fax: +49 (0) 631 205-2119; Tel: +49 (0) 631 205-2414
bDepartment of Chemical Engineering, Isfahan University of Technology, Isfahan, Iran
First published on 9th February 2016
Abstract
The EFCE (Europ. Fed. Chem. Engng.) extraction test system of toluene–acetone–water was used, where the organic phase was a toluene-based nanofluid containing 0.001 to 0.1 vol% hydrophobic silica nanoparticles. Experiments were performed in a membrane based micro-contactor at various volumetric flow rates of organic and aqueous phases and with a mass transfer direction from the organic to the aqueous phase. The results showed that nanoparticles are more effective on mass transfer at lower flow rates. A maximum enhancement of about 31% in the overall mass transfer coefficient was observed using 0.001 vol% silica nanoparticles. At higher and lower nanoparticle concentrations, smaller extraction efficiencies were observed. Brownian motion of nanoparticles and induced micro-convection is considered to be responsible for observing mass transfer enhancement at low concentrations of nanoparticles. Also, nanoparticle aggregation and reduction in free volume because of the presence of solid nanoparticles is a possibility for deteriorated mass transfer at higher nanoparticle concentrations.
Introduction
Liquid–liquid extraction is an important operation with considerable industrial applications. This process involves the separation of components of a homogeneous liquid by transferring them between contacting immiscible or partially miscible liquids. This technique is used as an energy-saving alternative to distillation in many industrial processes such as the petrochemical, waste water treatment, hydrometallurgical and oil refining industries.1 There are numerous publications that have dealt with fluid dynamics and mass transfer in liquid–liquid extraction processes. Based on this, fluid dynamics and mass transfer are inseparably linked with interfacial properties and the associated interfacial phenomena, such as droplet deformation, oscillation, Marangoni instabilities, surfactant ad- or desorption, etc.2–4Various research groups point out the high potential of micro-structured devices to intensify liquid–liquid extraction processes.5–8 In micro-process engineering, a higher surface-to-volume ratio and miniaturized length scales lead to shorter diffusion distances, and hence, lower driving forces or shorter contact times are necessary for the same separation task. Although throughput is limited to a few mL min−1,9 the advantages of lower equipment investment, smaller space requirements, lower solvent inventories and safer processing of toxic, explosive or harmful substances7 compared to conventional extraction equipment may together outweigh this deficiency.5 Various research on micro-structured liquid–liquid extraction has been reported in the literature on reactive or non-reactive mass transfer, dispersive or non-dispersive flow, different channel geometries, co-current or counter-current flow, etc.5,10–15
In order to increase the efficiency of a liquid–liquid extraction process recent reports have shown that nanoparticles can enhance mass transfer in liquid–liquid extraction processes.16–25 Nanofluids have received growing attention because of their proven potential to enhance heat transfer26–29 with numerous potential applications as super-coolants in nuclear reactors, car engines, radiators, computers, etc.30,31 Here Brownian movement of nanoparticles is considered as one of the major responsible factors in the enhancement of heat transfer. In relation to this, for analogy reasons investigations of mass transfer enhancement in nanofluids with a similar mechanism have been initiated recently.16,32–36 Investigations in the field of separation processes in the presence of nanoparticles are mostly related to gas absorption processes37–41 and limited attempts can be found regarding liquid–liquid extraction.16–25
Bahmanyar et al.16 investigated the mass transfer performance and hydrodynamic characteristics of kerosene-based SiO2 nanofluids in a pulsed liquid–liquid extraction column. In their work, the chemical system of kerosene–acetic acid–water was used and the range of SiO2 nanoparticle concentrations was from 0.01 to 0.1 vol%. They found that the mass transfer coefficient increased by 4 to 60% and static and dynamic dispersed phase hold-ups increased by 23 to 398%, and 23 to 257%, respectively. Khoobi et al.17 investigated the shape of drops, droplet sizes and their distributions under conditions matching those previously reported by Bahmanyar et al.16 They observed that a different content of nanoparticles had a marked influence on the geometrical shapes of the droplets and changed the droplet shape from ellipsoidal to spherical.17
Moreover, Ghafoori Roozbahani et al.18 investigated the influence of hydrophobic SiO2 nanoparticles on the static and dynamic hold-up of the dispersed phase in acetic acid transfer in a pulsed liquid–liquid extraction column. They performed their experiments with kerosene-based dispersions of 0.05 vol% SiO2 and compared the results obtained in the absence of nanoparticles and in the absence of both nanoparticles and mass transfer, at various pulsation intensities and flow rates. Their results indicated that the presence of nanoparticles increased the dynamic hold-up up to 70% while at the same time decreased the static hold-up in flow rates higher than 70 mL min−1 and a pulsation higher than 2.2 cm s−1.
Using an analogy for the heat and mass transfer, Bahmanyar et al.19 recently suggested a model to calculate effective diffusivity and mass transfer coefficients in terms of the nanoparticle volume fraction, Reynolds number, and Schmidt number. They compared the model predictions with their previous experimental data16 for a pulsed liquid–liquid extraction column. The absolute average relative errors of the proposed model for the mass transfer coefficient and effective diffusivity were 5.3% and 5.4%, respectively.
Mirzazadeh Ghanadi et al.20 investigated the effect of nanoparticles on mass transfer in the liquid–liquid extraction process for the chemical system n-butanol–succinic acid–water. They prepared nanofluids with 0.025, 0.05 and 0.1 wt% of ZnO, carbon nanotubes (CNT), and TiO2 nanoparticles in water. Their results indicated that the effect of ZnO nanoparticles on mass transfer enhancement (up to two-fold) was more than that of CNT and TiO2 nanoparticles. Furthermore, Mirzazadeh Ghanadi et al.20 observed that mass transfer increased with nanoparticle concentration and the positive effect of the nanoparticles was more distinctive in laminar flow. They found that when the flow mode changes to turbulent flow, as a result of eddy movement, the presence of nanoparticles scarcely influences the mass transfer. Such results can be useful where the capability to manufacture smaller fluidic devices and to quantitatively monitor smaller volumes of liquids bring the process of miniaturization into the domain of laminar flow. New and enabling technologies are being developed using the unique diffusion-based characteristics of the laminar flow domain for sample preparation and analysis. These new analytical systems will have a significant impact on the future of clinical diagnostics.42
Nematbakhsh and Rahbar-Kelishami21 investigated the influence of hydrophobic SiO2 nanoparticles on mass transfer using an irregularly-packed liquid–liquid extraction column and the chemical system toluene–acetic acid–water. They dispersed nanoparticles with sizes of 10, 30 or 80 nm in toluene–acetic acid to produce nanofluids with different concentrations of 0, 0.01, 0.05 and 0.1 vol%. In their work, the maximum mass transfer coefficient enhancement was approximately 42% at 0.05% concentration of nanoparticles using smaller particles (10 nm).
Saien and Bamdadi22 investigated the behavior of nanofluid single drops in the liquid–liquid extraction process. In their study, the chemical system of toluene–acetic acid–water was used, and the drops were organic nanofluids containing magnetite or alumina nanoparticles. Saien and Bamdadi22 examined drop sizes within the range of 2.9 to 4.3 mm, with magnetite and alumina nanoparticle concentrations of 0.0005 to 0.005 wt%. They achieved the maximum mass transfer enhancement at a nanoparticle concentration of 0.002 wt% with enhancement values of 157% and 121% for magnetite and alumina nanoparticles, respectively. They also found that small drops experienced greater mass enhancement but the size of the drops was not found to be influenced much by the nanoparticles.
Recently, Saien et al.23 investigated the influence of an oscillating magnetic field on mass transfer in a magnetite nanofluid single drop liquid–liquid extraction column. They used the chemical system toluene–acetic acid–water, while hydrophobic magnetite nanoparticles were present in the organic dispersed phase. In their work, the magnetic field intensity was within the range of 0.36–1.45 T, accompanied with different nanofluid concentrations within 0.001 to 0.005 wt%. Compared with no magnetic field, an average enhancement of about 65% and a maximum of 121% (for the smallest drops) were achieved in their experiments. They also found that the size of the drops did not vary much with the concentration of nanoparticles.
In our previous articles,24,25 the influence of toluene-based hydrophobic SiO2 nanofluids with different nanoparticle concentrations on the mass transfer and hydrodynamics in a spray liquid–liquid extraction column was investigated. Also, the effects of dispersed phase drop sizes and mass transfer direction were evaluated. The results showed that silica nanoparticles have no significant influence on the hydrodynamic parameters, while maximum enhancements of 47% and 107.5% in the overall mass transfer coefficient respectively for mass transfer direction of the dispersed to continuous phase and vice versa were achieved for larger drops with 0.001 vol% silica nanoparticles. At higher and lower nanoparticle concentrations, smaller overall mass transfer coefficients were observed.
Until now, the influence of nanoparticles on mass transfer in a micro-extraction process has not been investigated. Many micro-fluidic devices, such as “lab-on-a-chip” types of systems, have limited mass transfer at low Reynolds numbers. If the mass transfer can be improved by passive, nonreacting nanoparticles, a convenient and inexpensive technique to improve the performance of micro-fluidic devices such as micro-extractor systems will be achieved.32
In the present work, the influence of hydrophobic silica nanoparticles on the mass transfer in a membrane-based micro-contactor is studied. The extraction test system of toluene–acetone–water proposed by the European Federation of Chemical Engineering (EFCE) is used, and the organic phase is a toluene-based nanofluid containing 0.001 to 0.1 vol% hydrophobic silica nanoparticles. The experiments are performed at various volumetric flow rates of the organic and aqueous phases and with a mass transfer direction from the organic to the aqueous phase.
Materials and methods
Micro-contactor
The home-made, flat-membrane micro-contactor consists of an upper and a lower basic plate (stainless steel and glass), an upper and a lower channel plate made of polytetrafluoroethylene (thickness: 0.5 mm) with meandering channel geometry (180° U-bends; width: 3 mm) and a porous metal mesh (twilled dutch weave, GKD Geb. Kufferath AG, Dueren, Germany), which separates both micro-channels. The length of each channel was 40.53 cm. Fig. 1 shows the modular design of the micro-contactor (for membrane characteristics see Table 1).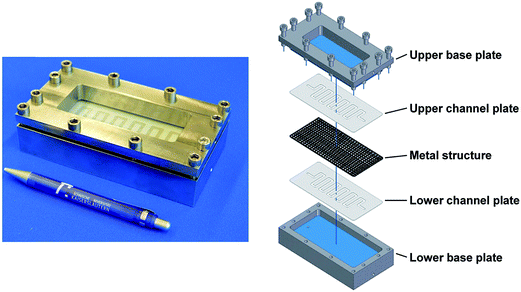 | ||
| Fig. 1 The modular design of the micro-contactor.5 | ||
Chemical system and nanofluid preparation
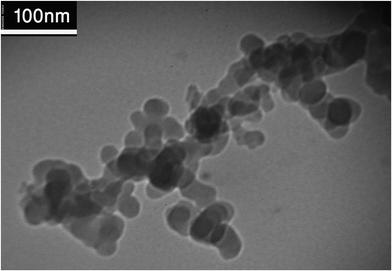
As mentioned above toluene–acetone–water was used in this work. Deionised water was used and as solute, acetone (analytical grade, 99.9%, Merck, Germany) was used, with an initial concentration of 1 wt%. The mass transfer direction was from the organic to aqueous phase, so the solute was dissolved in toluene, technical grade provided by VWR Chemicals (Germany) or toluene-based nanofluids. Hydrophobic silica nanoparticles with an average size of about 14 nm supplied by Plasmachem (Germany) were used to produce nanofluids. An electronic balance (Sartorius research, Germany) accurate to ±0.0001 g was utilized to weigh the required amount of nanoparticles for preparation of a nanofluid with specified concentration.Nanoparticles were added to toluene by using a digital mixer (IKA RW20, Germany) in 5 min and then sonicated using an ultrasonic system (Laboson 200, Bender & Hobein, Germany) for 20 min. Nanofluids with concentrations of 0.001, 0.01 and 0.1 vol% (0.0025, 0.0254 and 0.2537 wt%) were prepared. To avoid any influence on mass transfer measurements, the colloidal suspension of the concentrated nanofluid was prepared without adding any surfactant and stabilizing agent. Fig. 2 shows the size of the suspended silica nanoparticles, recorded using transmission electron microscopy (TEM). The manufacturer-provided average size of the nanoparticles was confirmed by means of TEM imaging. Since the TEM image was taken 3 h after preparing the nanofluid and the duration of each extraction experiment was shorter than 3 h, nanofluids were stable during the extraction experiments. Moreover, no nanoparticle sedimentation was observed during and after finishing each experiment. Physical properties of the chemical system were measured using a pycnometer, an Ostwald viscometer (CANNON-FENSKE OPAQUE 50, USA) and a tensiometer (Dataphysics, Germany) at 25 °C.
Experimental method
At the beginning of the experiments the organic and aqueous phases were mutually saturated to prevent multi component diffusion processes. First, the apparatus was flooded with the wetting organic phase using a peristaltic pump (Watson-Marlow 120U DM/2), filling the pores, and then, in counter-current arrangement, the upper channel volume was displaced by the non-wetting aqueous phase using a piston pump (Merck-Hitachi 655 A-12). Therefore, both flow rates could be adjusted independently over a broad range (see Fig. 3). The flow rates were determined gravimetrically. In each experiment, after reaching the steady state, the acetone concentration of the output flow of the aqueous phase was analyzed using gas chromatography (Agilent 6890 Series). Consequently, the organic phase concentrations were determined through mass balance. Each data point is a set of three identical experiments, where the error bars represent the standard deviation. The same procedure was followed for different concentrations of nanoparticles and different organic and aqueous flow rates. In this work, the ratio of volumetric flow rate of the aqueous phase to organic phase was considered within the range of 0.6 to 3. Experiments were done at constant aqueous or organic phase flow rates at 25 °C. The equilibrium experiments were carried out by contacting equal volumes (10 mL) of the aqueous and organic phase at 25 °C for at least 24 h. | ||
| Fig. 3 Process flow sheet for mass transfer studies.5 | ||
Mass transfer calculations
The (average) overall mass transfer coefficient Korg (based on the organic phase) was experimentally calculated using the following equation:43 | (1) |
 | (2) |
In eqn (2), D, Caq,0 and Caq are the distribution coefficient, the aqueous inlet and outlet solute concentration.
The acetone molecules encounter three resistances to mass transfer: the film resistances in the organic and aqueous boundary layers and the membrane resistance. The resistance-in-series model accounts for the mass transfer by integrating these single mass transfer resistances due to diffusion into an overall mass transfer coefficient Korg:44
 | (3) |
In eqn (3), the membrane resistance can be approximated using the membrane properties44,45 according to eqn (4) and the porosity–tortuosity relationship46 in eqn (5):
 | (4) |
 | (5) |
In eqn (4), Dorg, τ, ε and δ are the solute diffusivity in the organic phase, tortuosity, porosity and membrane thickness. Eqn (4) takes the organic diffusion coefficient for a wetting, hydrophobic membrane into account. On the other side, the membrane resistance can be experimentally determined using the Wilson-plot method.44,45,47
The boundary layer mass transfer coefficients have been extensively studied for laminar flow in hollow fiber membrane contactors45,48–50 (the well known Lévèque-equation) and to some extent for rectangular micro-channels.51 The general forms45,52 of such correlations are given by eqn (6) and (7):
 | (6) |
 | (7) |
 | (8) |
 | (9) |
Since the three parameters a, b and c of eqn (6) and (7) have not yet been optimized for chemical systems including nanoparticles, eqn (8) was only used for an aqueous phase (phase without nanoparticles) and in the organic phase (phase with nanoparticles) the parameters a, b and c of eqn (7) were derived based on the differential evolution (DE) method.52 Our experimental results showed that eqn (9) is not suitable for chemical systems including nanoparticles and a new set of parameters a, b and c in eqn (7) is required.
Results and discussion
Fig. 4 shows the acetone concentration at different nanoparticle concentrations and aqueous flow rates and at a constant organic flow rate of 0.22 mL min−1. As shown, acetone concentration decreases with the increase in aqueous flow rate of base fluid and nanofluids. In fact, increase in aqueous flow rate causes a decrease in aqueous contact time and as the result lower acetone concentrations in the aqueous phase. Moreover, an increase in aqueous flow rate at constant organic flow rate results in an increase of the operation slope in the operating diagram, with an increase of driving force resulting in a finally lower aqueous phase acetone concentration. This figure also indicates that nanoparticles are more effective at low flow rates and a nanofluid with 0.001 vol% has a more pronounced effect on the acetone concentration profile.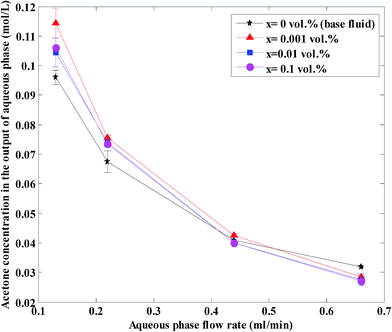 | ||
| Fig. 4 Aqueous phase acetone concentration in the outlet at different nanoparticle concentrations and at a constant organic flow rate of 0.22 mL min−1. | ||
The overall mass transfer coefficient at different aqueous flow rates and nanoparticle concentrations and at a constant organic flow rate of 0.22 mL min−1 is shown in Fig. 5. It is observed that the overall mass transfer coefficient rises with an increase in aqueous flow rate of the base fluid and nanofluids. In this work, the aqueous and organic flow regimes are laminar (most organic and aqueous Reynolds numbers are lower than 10 in the range of the aqueous and organic flow rates used in this work.). In laminar flow, a higher aqueous flow rate facilitates a more enhanced flow profile and thinner boundary layer, which leads to higher overall mass transfer coefficients.
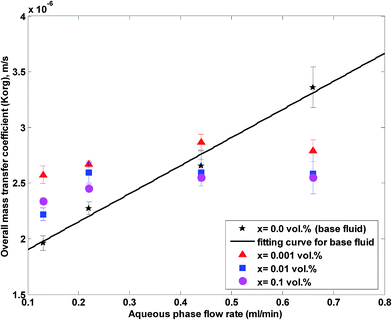 | ||
| Fig. 5 Overall mass transfer coefficient at different nanoparticle concentrations and at a constant organic flow rate of 0.22 mL min−1. | ||
Fig. 6 shows the ratio of the overall mass transfer coefficient in the nanofluid to the overall mass transfer coefficient in a base fluid (no nanoparticles) at different aqueous flow rates and nanoparticle concentrations and at a constant organic flow rate of 0.22 mL min−1.
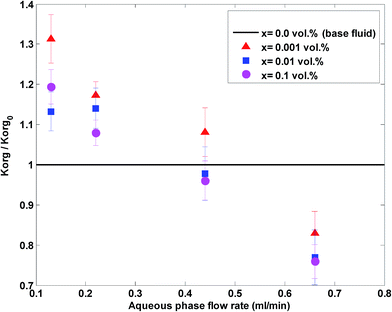 | ||
| Fig. 6 The ratio of the overall mass transfer coefficient in the nanofluid to the overall mass transfer coefficient in a base fluid at different aqueous flow rates and nanoparticle concentrations. | ||
Based on Fig. 5 and 6, nanoparticles are more effective at lower flow rates and a nanofluid with 0.001 vol% concentration is more effective on the overall mass transfer coefficient. A maximum enhancement of 31% in the overall mass transfer coefficient is observed at an aqueous flow rate of 0.11 mL min−1 and a silica nanoparticle concentration of 0.001 vol%. In fact, a silica nanoparticle concentration of 0.001 vol% is an optimum nanoparticle concentration within the concentration range of 0 to 0.1 vol% and the overall mass transfer coefficient rises to a maximum point for silica nanoparticle concentrations up to 0.001 vol%. A decreasing variation in the overall mass transfer coefficient after this optimum point then occurred upon addition of extra amounts of nanoparticles. To explain the reason for observing this enhancement, some researchers32,53 believe that Brownian motion of nanoparticles and induced micro-convection will increase the mass transfer coefficient. Starting from the generalized Langevin equation, Veilleux and Coulombe54 showed that the velocity field established around a Brownian nanoparticle is similar to the velocity field predicted by the Brinkman equations leading to the analogy between dispersion in diluted fixed beds and dispersion in nanofluids. Their proposed model predicts the order of magnitude of the mass diffusion enhancement they had observed in their previous work for rhodamine 6G mass diffusivity in water-based alumina nanofluids.53
At higher nanoparticle concentrations (higher than 0.001 vol%), with increasing nanoparticle volume fraction, there is a greater likelihood for particle aggregation, producing in effect larger, more massive particles with reduced capacity to promote localized convection.55 This latter mechanism may be responsible for the decrease after the optimum nanoparticle concentration. In addition to this mechanism, hindrance of diffusion (friction effects with large nanoparticle aggregates) can also be responsible for a decreasing trend after the optimum.56
The acetone concentration at the exit in the aqueous phase at different nanoparticle concentrations and organic flow rates is shown in Fig. 7 at a constant aqueous flow rate of 0.22 mL min−1. As shown, the acetone concentration increases with an increase in organic flow rate of the base fluid and nanofluids. In fact, an increase in the organic flow rate at constant aqueous flow rate causes a decrease in the ratio of Qaq/Qorg and as a result the slope decreases, thus the driving force decreases and finally the aqueous phase acetone concentration is higher. Based on this figure, higher effects on the acetone concentration profile are observed at lower organic flow rates for nanofluids with 0.001 vol% concentration.
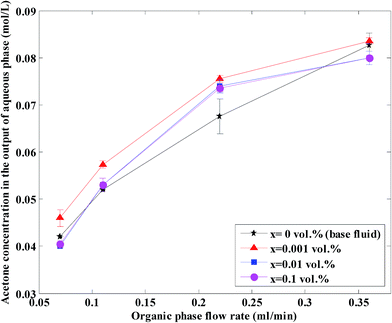 | ||
| Fig. 7 Acetone concentration at different nanoparticle concentrations and organic flow rates at a constant aqueous flow rate of 0.22 mL min−1. | ||
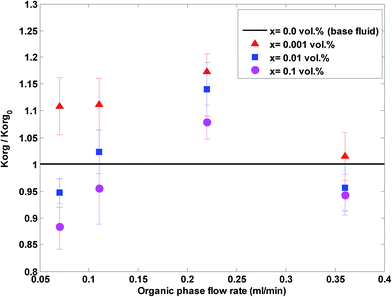
The overall mass transfer coefficient at different organic flow rates and nanoparticle concentrations and at a constant aqueous flow rate of 0.22 mL min−1 is shown in Fig. 8. Similar to Fig. 5, it is observed that the overall mass transfer coefficient rises with an increase in the organic flow rate of the base fluid and nanofluids, because of a more enhanced flow profile and thinner boundary layer at higher organic flow rates. Fig. 9 shows the ratio of the overall mass transfer coefficient in a nanofluid to the overall mass transfer coefficient in a base fluid under these conditions.
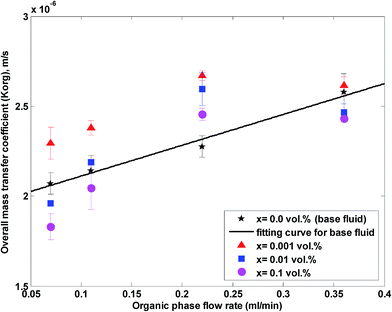 | ||
| Fig. 8 Overall mass transfer coefficient in a nanofluid at different organic flow rates and nanoparticle concentrations at a constant aqueous flow rate of 0.22 mL min−1. | ||
As observed in Fig. 8 and 9, higher effects on acetone concentration profile are observed at lower organic flow rates for nanofluids with a 0.001 vol% concentration. A maximum enhancement of 20% in the overall mass transfer coefficient is observed for a silica nanoparticle concentration of 0.001 vol%. Similar to Fig. 5 and 6, a silica nanoparticle concentration of 0.001 vol% is an optimum nanoparticle concentration within the concentration range of 0 to 0.1 vol%.
To compare the experimental overall mass transfer coefficient (Korg) obtained based on eqn (1) with literature data, overall mass transfer coefficients at different organic and aqueous flow rates and nanoparticle concentrations were calculated based on eqn (3). For both the base fluid and nanofluids, eqn (8) was used to calculate the individual mass transfer coefficient of the aqueous phase. However, to calculate the individual mass transfer coefficient of the organic phase, eqn (9) was used for experiments with the base fluid and eqn (7) was applied for experiments with nanofluids. For nanofluidic systems the parameters of eqn (7) were optimized based on the DE method and experimental data of the overall mass transfer coefficient. Eqn (10) shows the final optimal results for nanofluids in a micro-contactor system.
 | (10) |
Fig. 10 shows the values of experimental and calculated mass transfer coefficients at different nanoparticle concentrations and different flow rates. The average of absolute relative deviation between the experimental and calculated overall mass transfer coefficients for the nanofluids and base fluid are respectively 5.14% and 8.25% (without considering the highest experimental value of the overall mass transfer coefficient in Fig. 10). Although some errors for the base fluid are higher than 10%, since these data are based on eqn (9) without any correlation, these errors are acceptable. In addition to this, it is believed that available correlations in the literature underestimate the overall mass transfer coefficients in a micro-structured contactor.5,57
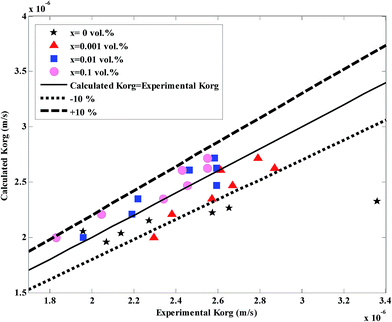 | ||
| Fig. 10 Comparison between the experimental overall mass transfer coefficient (eqn (1)) and the calculated overall mass transfer coefficient (eqn (3)) (more details of this figure are provided in the ESI†). | ||
Conclusions
In the present work, the influence of hydrophobic silica nanoparticles on mass diffusion in a membrane-based micro-contactor was studied. The chemical system of toluene–acetone–water proposed by the European Federation of Chemical Engineering (EFCE) was used, and the organic phase was a toluene-based nanofluid containing 0.001 to 0.1 vol% hydrophobic silica nanoparticles. The experiments were performed at various volumetric flow rates of organic and aqueous phases and with a mass transfer direction from the organic to the aqueous phase.The results showed that nanoparticles are more effective on mass transfer at low flow rates. A maximum enhancement of about 31% in the overall mass transfer coefficient was observed using 0.001 vol% of silica nanoparticles. At higher and lower nanoparticle concentrations, smaller extraction efficiencies were observed. Experimental overall mass transfer coefficients were in good agreement with calculated overall mass transfer coefficients based on literature equations. Brownian motion of nanoparticles and induced micro-convection could be responsible for observing mass transfer enhancements at low concentrations of nanoparticles. Also, nanoparticle aggregation and hindered diffusion (friction with nanoparticle aggregates) of the solute could be responsible for deteriorated mass transfer at higher nanoparticle concentrations.
References
- A. Javadi, D. Bastani and M. Taeibi-Rahni, AIChE J., 2006, 52(3), 895–910 CrossRef CAS.
- M. Wegener, N. Paul and M. Kraume, Int. J. Heat Mass Transfer, 2014, 71, 475–495 CrossRef.
- M. Wegener, Int. J. Heat Mass Transfer, 2014, 71, 769–778 CrossRef.
- M. Wegener and A. R. Paschedag, Int. J. Heat Mass Transfer, 2012, 55, 1561–1573 CrossRef CAS.
- S. Willersinn and H.-J. Bart, Chem. Eng. Process., 2015, 95, 186–194 CrossRef CAS.
- N. Kockmann, J. Kussi, G. Schembecker, V. Hessel, I. V. Gürsel and Q. Wang, Chem. Ing. Tech., 2012, 84(5), 660–684 CrossRef.
- J.-C. Charpentier, Chem. Eng. J., 2007, 134(1–3), 84–92 CrossRef CAS.
- E. Y. Kenig, Y. Su, A. Lautenschleger, P. Chasanis and M. Grünewald, Sep. Purif. Technol., 2013, 120, 245–264 CrossRef CAS.
- V. Hessel, A. Renken, J. C. Schouten and J. Yoshida, Micro Process Engineering, Wiley-VCH Weinheim, 2009 Search PubMed.
- K. P. Nichols, R. R. Pompano, L. Li, A. V. Gelis and R. F. Ismagilov, J. Am. Chem. Soc., 2011, 133(39), 15721–15729 CrossRef CAS PubMed.
- D. Ciceri, J. M. Perera and G. W. Stevens, Microfluid. Nanofluid., 2011, 11(5), 593–600 CrossRef CAS.
- M. Darekar, N. Sen, K. K. Singh, S. Mukhopadhyay, K. T. Shenoy and S. K. Ghosh, Hydrometallurgy, 2014, 144–145, 54–62 CrossRef CAS.
- J. Hereijgers, M. Callewaert, X. Lin, H. Verelst, T. Breugelmans and H. Ottevaere, J. Membr. Sci., 2013, 436, 154–162 CrossRef CAS.
- M. B. Mansur, M. J. Slater and E. C. Biscaia, Hydrometallurgy, 2002, 63(2), 107–116 CrossRef CAS.
- J. Hereijgers, N. van Oeteren, J. F. M Denayer and T. Breugelmans, Chem. Eng. J., 2015, 273, 138–146 CrossRef CAS.
- A. Bahmanyar, N. Khoobi, M. R. Mozdianfard and H. Bahmanyar, Chem. Eng. Process., 2011, 50, 1198–1206 CrossRef CAS.
- N. Khoobi, A. Bahmanyar, H. Molavi, D. Bastani, M. R. Mozdianfard and H. Bahmanyar, Can. J. Chem. Eng., 2013, 91(3), 506–515 CrossRef CAS.
- M. A. Ghafoori Roozbahani, M. Sattari Najafabadi, K. Nazari Hassan Abadi and H. Bahmanyar, Chem. Eng. Commun., 2015, 202(11), 1468–1477 CrossRef.
- A. Bahmanyar, N. Khoobi, M. Mohammad Ali Moharrer and H. Bahmanyar, Chem. Eng. Res. Des., 2014, 92(11), 2313–2323 CrossRef CAS.
- A. Mirzazadeh Ghanadi, A. Heydari Nasab, D. Bastani and A. K. Seife Kordi, Chem. Eng. Commun., 2015, 202(5), 600–605 CrossRef.
- G. Nematbakhsh and A. Rahbar-Kelishami, Chem. Eng. Commun., 2014, 202(11), 1493–1501 CrossRef.
- J. Saien and H. Bamdadi, Ind. Eng. Chem. Res., 2012, 51, 5157–5166 CrossRef CAS.
- J. Saien, H. Bamdadi and S. Daliri, J. Ind. Eng. Chem., 2015, 21, 1152–1159 CrossRef CAS.
- S. S. Ashrafmansouri and M. Nasr Esfahany, Sep. Purif. Technol., 2015, 151, 74–81 CrossRef CAS.
- S. S. Ashrafmansouri and M. Nasr Esfahany, AIChE J., 2015 DOI:10.1002/aic.15084 , accepted.
- S. U. S. Choi, J. Heat Transfer, 2009, 131(3), 1–9 CrossRef.
- P. Keblinski, J. A. Eastman and D. G. Cahill, Mater. Today, 2005, 8, 36–44 CrossRef CAS.
- J. Buongiorno, J. Heat Transfer, 2006, 128(3), 240–250 CrossRef.
- F. Asadzadeh, M. Nasr Esfahany and N. Etesami, Int. J. Therm. Sci., 2012, 62, 114–119 CrossRef CAS.
- S. Ozturk, A. Y. Hassan and V. M. Ugaz, Nano Lett., 2010, 10, 665–671 CrossRef CAS PubMed.
- H. A. Mohammed, A. A. Al-aswadi, N. H. Shuaib and R. Saidur, Renewable Sustainable Energy Rev., 2011, 15, 2921–2939 CrossRef CAS.
- S. Krishnamurthy, P. Bhattacharya, P. E. Phelan and R. S. Prasher, Nano Lett., 2006, 6(3), 419–423 CrossRef CAS PubMed.
- N. Keshishian, M. Nasr Esfahany and N. Etesami, Int. Commun. Heat Mass Transfer, 2013, 46, 148–153 CrossRef CAS.
- H. Beiki, M. Nasr Esfahany and N. Etesami, Microfluid. Nanofluid., 2013, 15(4), 501–508 CrossRef CAS.
- H. Beiki, M. Nasr Esfahany and N. Etesami, Int. J. Therm. Sci., 2013, 64, 251–256 CrossRef CAS.
- S. S. Ashrafmansouri and M. Nasr Esfahany, Int. J. Therm. Sci., 2014, 82, 84–99 CrossRef CAS.
- B. Olle, S. Bucak, T. C. Holmes, L. Bromberg, T. A. Hatton and D. I. C. Wang, Ind. Eng. Chem. Res., 2006, 45, 4355–4363 CrossRef CAS.
- E. Nagy, T. Feczkó and B. Koroknai, Chem. Eng. Sci., 2007, 62, 7391–7398 CrossRef CAS.
- J. Y. Jung, J. W. Lee and Y. T. Kang, J. Mech. Sci. Technol., 2012, 26(8), 2285–2290 CrossRef.
- H. Kim, J. Jeong and Y. T. Kang, Int. J. Refrig., 2012, 35(3), 645–651 CrossRef CAS.
- S. H. EsmaeiliFaraj, M. Nasr Esfahany, M. Jafari-Asl and N. Etesami, Ind. Eng. Chem. Res., 2014, 53(43), 16851–16858 CrossRef CAS.
- T. H. Schulte, R. L. Bardell and B. H. Weigl, Clin. Chim. Acta, 2002, 321(1–2), 1–10 CrossRef CAS.
- R. Prasad and K. K. Sirkar, Membrane based Solvent Extraction, in Membrane Handbook, Van Nostrand Reinhold, New York, 1992, pp. 727–763 Search PubMed.
- A. Gabelman and S. T. Hwang, J. Membr. Sci., 1999, 159, 61–106 CrossRef CAS.
- R. Viegas, M. Rodriguez, S. Luque, J. Alvarez, I. Coelhoso and J. Crespo, J. Membr. Sci., 1998, 145, 129–142 CrossRef CAS.
- S. B. Iversen, V. K. Bhatia, K. Dam-Johansen and G. Jonsson, J. Membr. Sci., 1997, 130, 205–217 CrossRef CAS.
- E. E. Wilson, Trans. ASME, 1915, 37, 47 Search PubMed.
- R. O. Crowder and E. L. Cussler, J. Membr. Sci., 1998, 145, 173–184 CrossRef CAS.
- C. Yang and E. L. Cussler, Biotechnol. Bioeng., 2000, 69, 66–73 CrossRef CAS PubMed.
- E. A. Fouad and H.-J. Bart, J. Membr. Sci., 2008, 307(2), 156–168 CrossRef CAS.
- P. van Male, M. H. J. M. de Croon, R. M. Tiggelaar, A. van den Berg and J. C. Schouten, Int. J. Heat Mass Transfer, 2004, 47(1), 87–99 CrossRef.
- B. V. Babu and R. Angira, Comput. Chem. Eng., 2006, 30, 989 CrossRef CAS.
- J. Veilleux and S. A. Coulombe, J. Appl. Phys., 2010, 108, 104316 CrossRef.
- J. Veilleux and S. A. Coulombe, Chem. Eng. Sci., 2011, 66, 2377–2384 CrossRef CAS.
- X. Fang, Y. Xuan and Q. Li, Appl. Phys. Lett., 2009, 95, 203108 CrossRef.
- C. Gerardi, D. Cory, J. Buongiorno, L. W. Hu and T. McKrell, Appl. Phys. Lett., 2009, 95, 253104 CrossRef.
- S. Willersinn and H.-J. Bart, Proceedings ISEC2014, 7–11.09.2014, Würzburg, ed. DECHEMA, Frankfurt, 2014, BRD Search PubMed.
Footnote |
| † Electronic supplementary information (ESI) available. See DOI: 10.1039/c5ra26056f |
| This journal is © The Royal Society of Chemistry 2016 |

