
Synthesis, screening and sensing applications of a novel fluorescent probe based on C-glycosides†
Tao Zhang,
Tianyi Wang and
Zhijie Fang*
Department of Chemical Engineering, Nanjing University of Science and Technology, Nanjing 210094, P. R. China. E-mail: zjfang@njust.edu.cn
First published on 9th February 2016
Abstract
A novel water soluble fluorescent probe based on C-glycoside with an aromatic aldehyde unit has been synthesized and its UV/Vis and fluorescence spectra, aggregation and disaggregation with bovine serum albumin were studied. Meanwhile, the comparison between the carbohydrate-derived probe and other neutral probes indicated that neutral probes with a carbohydrate moiety showed excellent hydrophily and biocompatibility. The absorption and emission max wavelength of the arylvinyl ketone C-furyl glycoside in different solvents were in the range 402–437 and 479–549 nm respectively. Fluorescence spectroscopic studies showed that the as-prepared dye could be used in the labeling of BSA and monitoring trypsin hydrolysis as it displayed a “turn-on” mechanism when the dye was incubated with protein in water. Compared to traditional probes, this neutral fluorescent probe has the advantages of being water soluble, easily synthesized and suitable for a wide range of applications involving biomolecules.
1 Introduction
Due to the high sensitivity and selectivity, fluorescence probes are particularly powerful tools for the detection of protein–protein interactions,1–3 and various probes have been used in this field, such as coumarin,4 supramolecular,5 squarain6–8 and azido-BODIPY.9 However, most of the available fluorescent probes require multi-step synthesis and their water-solubility is increased through ionization. As ionic groups can lower the binding ability of the dye,10 non-ionic dyes have become more popular with researchers in recent years. Although neutral probes show good stability, their applications are limited due to their poor water-solubility. Herein, carbohydrate derived fluorescent probe may be a good solution. During the past several years, carbohydrate-derived fluorescent probes have been researched in various areas, such as protein–carbohydrate interactions,11 determination of toxin ions12,13 and DNA staining.14 Compared with traditional probes, the carbohydrate-derived fluorescent probe is neutral, water-soluble, and biocompatible.15,16Our group spent considerable time investigating the synthesis of natural products, chemsensors, drugs and their intermediates with carbohydrates as starting materials.17 In addition, we have systematically explored the one-step synthesis of C-glycosides (the anomeric oxygen atom is replaced by a carbon atom) from glucose catalyzed by base18 and Lewis acids.19 At present, there are amounts of reports of base-catalyzed C-glycosides derivatives, while acid-catalyzed C-glycosides derivatives are few covered. The target product C-glycoside-derived tetrahydrofurans20,21 is consisted of a sugar ring and a rigid furan ring with an acetyl group which can be used as a reactive part to prepare derivatives for fluorescent probes. Therefore, we synthesized a set of novel C-glycoside derivatives with rigid structure through aldol reaction by using aromatic aldehydes. After screening the different aldehyde derivatives, a dye with strong green fluorescence was picked out for further investigation. The function of carbohydrate moiety was expressed by comparing the fluorescent properties of the compounds with/without sugar ring. Molecular computation22 was then employed to explore the mechanism for the fluorescent labelling. Bio-applications, such as detection of proteins as well as rate of enzymolysis23 and cell staining experiments24 were also evaluated.
2 Experimental section
2.1 General methods
All chemicals were analytical pure and used without further purification. Reactions were monitored by thin-layer chromatography using silica gel coated TLC plates and detection was performed by UV absorption (254 nm) where applicable, and by spraying with 50% sulfuric acid in ethanol followed by charring. Melting points (mp) were determined on a WRS-1B digital melting-point apparatus (Shanghai Shenguang Instrument Co., Ltd). 1H and 13C were recorded on a Bruker-500 (500/125 MHz) spectrometer or Bruker-300 (300/75 MHz). Fluorescence spectra were obtained by using a Shimadzu RF-5301PC Fluorescence Spectrometer equipped with a xenon lamp, 1.0 cm quartz cells. Absorption spectra were measured with Lambda 35 UV-vis spectrophotometer.2.2 Typical experimental protocol
![[thin space (1/6-em)]](https://www.rsc.org/images/entities/char_2009.gif) :4 petroleum ether–ethyl acetate), the reaction mixture was extracted by ethyl acetate, and the organic layer was evaporated to dryness under reduced pressure. The residue was purified by recrystallization using petroleum ether and ethyl acetate and furnished pure compound 2 (1.7 g, 87%).:2 petroleum ether–ethyl acetate), the reaction mixture was evaporated to dryness under reduced pressure, then the residue was dissolved in dichloromethane, washed by brine. The organic phase was collected and dried over anhydrous Na2SO4. The solvent was evaporated under reduced pressure and the residue was further purified by silica gel column chromatography using petroleum ether–ethyl acetate (v/v 1:1) to furnish pure arylvinyl ketone C-furyl glycoside 3a (0.26 g, 82%).
:4 petroleum ether–ethyl acetate), the reaction mixture was extracted by ethyl acetate, and the organic layer was evaporated to dryness under reduced pressure. The residue was purified by recrystallization using petroleum ether and ethyl acetate and furnished pure compound 2 (1.7 g, 87%).:2 petroleum ether–ethyl acetate), the reaction mixture was evaporated to dryness under reduced pressure, then the residue was dissolved in dichloromethane, washed by brine. The organic phase was collected and dried over anhydrous Na2SO4. The solvent was evaporated under reduced pressure and the residue was further purified by silica gel column chromatography using petroleum ether–ethyl acetate (v/v 1:1) to furnish pure arylvinyl ketone C-furyl glycoside 3a (0.26 g, 82%).2.3 Fluorescence probe bind with BSA and spectra properties
The buffer solution was PBS (0.01 mol L−1) and prepared from Na2HPO4, K2HPO4, NaCl and KCl. The concentration of BSA stock solution was 4 mg mL−1. For the construction of fluorescence probe conjugates with BSA, certain small amounts of BSA solution was added intermittently to 2 mL of the buffer solution of probes (40 μM) and carefully mixed. In all the experiments, the fluorescence detection were under the same conditions, the excitation wavelength was set at 413 nm. Both fluorescence and absorption spectral were measured at ambient temperature.2.4 Detection of trypsin action by fluorescence
The buffer solution of probes and BSA were mixed carefully, and the final concentrations were 10 μM and 1.6 mg mL−1. For the detection of trypsin, trypsin stock solution was added to the mix and the final concentrations of trypsin were 0 mU mL−1, 8 mU mL−1, 10 mU mL−1, 12 mU mL−1, 14 mU mL−1, 16 mU mL−1 and 18 mU mL−1, respectively. The fluorescence detection was carried out after all the prepared solutions were under 37 °C for 10 min.2.5 Determination of fluorescence quantum yields
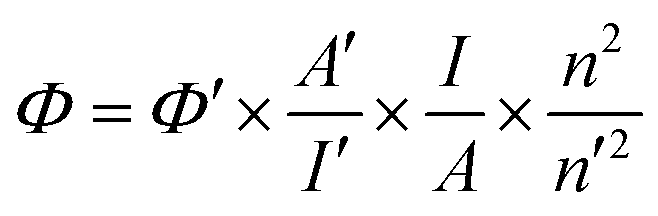
Quantum yields (QY) of the compound 3h in different solvents were determined by a widely accepted relative method. Specially, 9,10-diphenylanthracene (QY = 0.9 in n-hexane) was selected as the reference. The QY of a sample was calculated according to the following equation:where Φ is the QY of the testing sample, I is the testing sample's integrated emission intensity, n is the refractive index, and A is the optical density. The prime symbol (′) refers to the referenced dye of known QY. To minimize reabsorption effects, absorption was always kept below 0.05 at the excitation wavelength.
3 Results and discussion
3.1 Synthesis
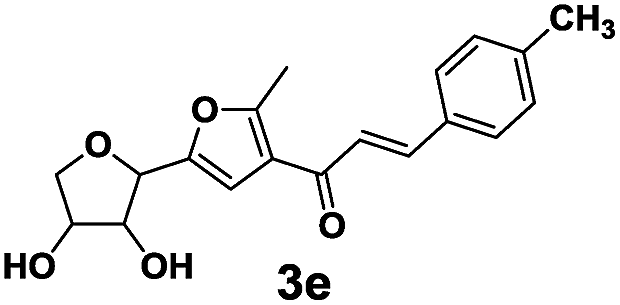
The novel dyes were synthesized by a simple two-step procedure (Scheme 1). In the first step, one-step synthesis of compound 2 from glucose catalyzed by Lewis acids has been reported.19 In the second step, compound 2 was reacted with several different aromatic aldehydes in a base-catalyzed Aldol reaction at 60 °C in ethanol, to provide a series of eight different dyes, 3a–3h (listed in Table 1). The products were used for subsequent analyses after being purified by chromatography. Compounds 3a–3h were then characterized by 1H NMR, 13C NMR, and HRMS, and then subjected to various spectral analyses, which are described in the subsequent sections.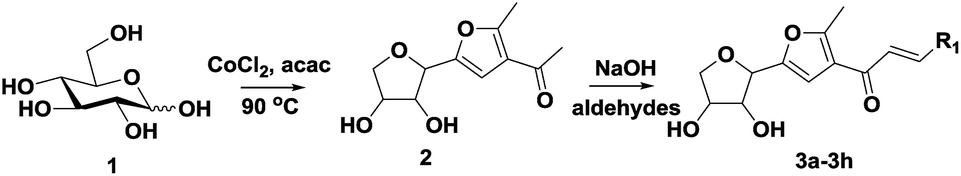 | ||
| Scheme 1 Synthesis of fluorescent probes by Aldol reaction. | ||


3.2 Spectral properties
 | ||
| Fig. 1 The absorption (a) and emission (b) spectra of compounds 3a–3h (50 μM) in acetonitrile, slit (3, 1.5). | ||
Although the extent of conjugation in the structures of 3f and 3g is more than that of 3b and 3h relatively, there is less electron density in these systems, which poses an obstacle for the generation of fluorescence. The electron density of 3g, 3b and 3h can be found in the ESI Fig. S2† with a computed electrostatic potential diagram, the red and yellow parts indicate that these parts are more negative and of high electron density. As seen in Fig. S2,† the colour of conjugation parts of 3b and 3h are more tend to red, which means they are of more electron than 3g. This is due to the p–π conjugation between an electron donating group and a conjugated system. The fluorescent properties of 3a–3h were further confirmed by DFT calculation (see in ESI†), and they reveals that the substituted benzaldehyde groups which provide strong electron-donating ability and rigidity to the molecules (cf. 3h) are responsible for the generation of strong fluorescence and red-shifting of the emission with decline in the HOMO–LUMO energy gap. Above all, we chose 3h as the preferred detection dye in the subsequent experiments because its higher fluorescence intensity and absorption compared with 3b, with excitation wavelength 413 nm and emission wavelength 518 nm.
 | ||
| Fig. 2 Spectral data of 3h in different solvents. Colour coding: red line: the maximum emission wavelength (Em.); blue line: the maximum absorption wavelength (Abs.); Stokes shift (S.S.); green line: the FL quantum yields of 3h in different solvents. | ||
Furthermore, the Stokes shift of dye 3h in protonic solvents is longer than in aprotic solvents, while its ultraviolet and fluorescence spectra in protonic solvents are red-shifted by several nanometers. That is because the dye 3h can generate hydrogen bond complexes with protonic solvents and these complexes will affect both the ultraviolet and fluorescence results. When the complexes are excited, the excited state with hydrogen bond becomes more stable than that with no hydrogen bond, resulting in a bathochromic shift of the fluorescence spectra. From the observed results, we selected acetonitrile as the detection solvent due to the long Stokes shift and strong fluorescence of 3h in acetonitrile solution.
The aggregation behaviour of the dyes was investigated by adding water to the acetonitrile solution of 3h (Fig. 3). As the dye is composed of both hydrophilic and hydrophobic parts, the dye is well dispersed in the acetonitrile. However, when water is added to the system, it facilitates the aggregation process of dye 3h. As seen in Fig. 3, when 0.01% of water was added, the intensity decreased by almost 300 a.u. When the water content reached up to 0.4%, the fluorescence was almost completely quenched, at the slit (3, 1.5). The hydrophilic heads are more sensitive to water due to the presence of dihydroxyl groups, thus it is easier to aggregate and shield the hydrophilic heads. In addition, when the water content in acetonitrile increases, the absorption decreases and the band becomes broad, and which indicates the formation of dye aggregates (Fig. 3). That shows water plays an important role in the fluorescence quenching of this system.
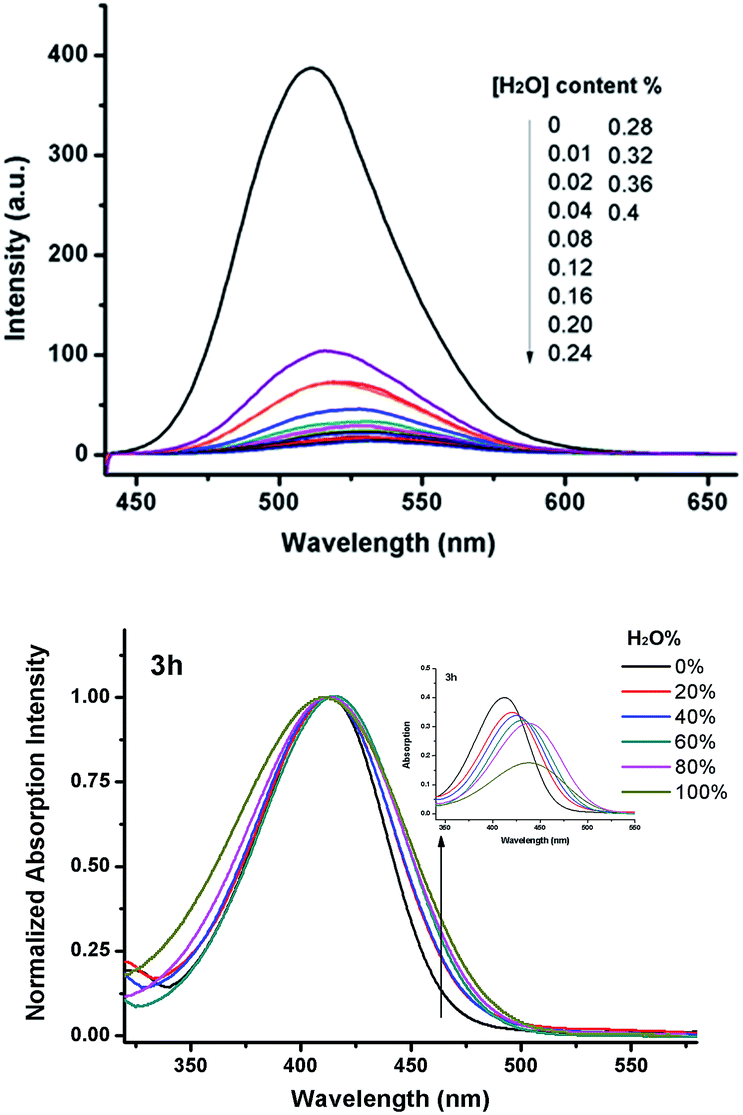 | ||
| Fig. 3 Effect of water on the fluorescence slit (3, 1.5) and normalized UV spectra of dye 3h. | ||
 | ||
| Fig. 4 Water effect of fluorescence (slit 5, 3) (a) and UV spectra (b) of compound 3h, A and B (10 μM). | ||
Another important advantage of the sugar group is to make the dyes biocompatible. Since the detection of proteins is usually performed in water rather than organic solvents, to prevent protein denaturation, the poor water-solubility of compounds A and B makes them unsuitable probes for detection of proteins. From the above, the excellent water-solubility and biocompatibility of the carbohydrate group in 3h makes this fluorescence probe extremely suitable for detection of biomolecules.
3.3 Fluorescence detection of BSA
Serum albumin (SA) is the most abundant protein in nature, accounting for 60% of the total serum protein. Bovine serum albumin (BSA) was selected as our protein model in this study due to its medical importance, low cost, ready availability, and unusual ligand-binding properties. It is also considered to be homologous with human serum albumin (HSA). The rationale behind the experimental design is illustrated in Fig. 4. As we mentioned above, in the water, the hydrophobic moieties of compound 3h accumulate together and hide the hydrophobic part inside, which quenches the fluorescence. However, upon addition of BSA, it lowers the polarity of the solvent, which makes the hydrophobic parts of dye 3h more disperse in the system. The DLS results (see in ESI†) indicate BSA destroys the aggregation of 3h in water and forms a new aggregation with 3h in the formation of BSA–3h complex. This is accompanied by the generation of strong green fluorescence under 365 nm UV light. However, in the presence of trypsin, the BSA would be enzymatically hydrolysed, resulting in the gradual breaking up and dispersion of the dye–BSA aggregation complexes. Therefore, the change in state of the dye 3h, from aggregation to disaggregation, results in a significant decrease in the fluorescence of the conjugated probes, thus enabling the sensitive and selective detection of trypsin.The fluorescence spectra of dye 3h associated with different concentrations of BSA are shown in Fig. 5. The fluorescence intensities of dye 3h at 518 nm increased gradually with the addition of BSA in phosphate buffered saline (PBS, pH 7.4). When the final concentration of BSA in the complex reached to 1.6 mg mL−1, the complex achieved equilibrium and thus the fluorescence intensity remained constant. Before reaching equilibrium, the fluorescence intensity increased with increasing concentrations of BSA, following a good linear relationship (R2 = 0.99179, y = 4.9914x + 1.00031). The correlation between fluorescence intensity and concentration of BSA was used to determine the optimum ratio of BSA to dye 3h in the dye–BSA complex (see Fig. 6). The results indicate that BSA can bind with 3h efficiently, and the optimum ratio was found to be 1.6 mg mL−1 BSA to 40 μM dye. Thus, the subsequent experiments were performed using the probe complex formed from 40 μM of dye 3h and 1.6 mg mL−1 of BSA.
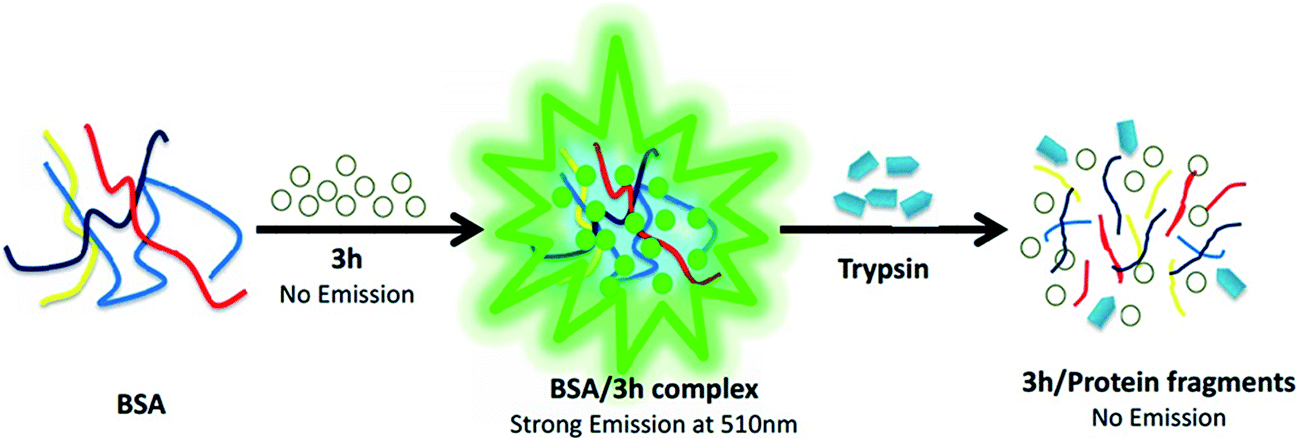 | ||
| Fig. 5 Schematic diagram of the detection process of BSA/3h complex. | ||
 | ||
| Fig. 6 Fluorescence spectra and linear fit of 40 μM dye 3h associated with different concentrations of BSA in pH = 7.4 PBS, slit (3, 1.5). | ||
3.4 Fluorescence detection of trypsin
To evaluate the feasibility of detecting trypsin activity using the probe complex, the fluorescence intensity of the dye–BSA probe complex was examined after incubating it with trypsin in PBS buffer solution (pH = 7.4) for 10 min. Fig. 7 shows the fluorescence spectra of dye 3h, the dye–BSA complex before and after incubating with trypsin and the dye 3h incubated with trypsin. The dye 3h shows low fluorescence intensity due to its excellent solubility and well-dispersed state in the buffer solution. After the addition of BSA into the solution, the dye–BSA complex is formed gradually, resulting in strong green fluorescence. Control experiments indicated that trypsin did not show any significant increase in its fluorescence after incubating with dye 3h, thus indicating that any change in fluorescence is not likely to depend on trypsin–dye interaction. | ||
| Fig. 7 Fluorescence spectra of dye 3h, BSA, the 3h–trypsin complex, the 3h probe–BSA complex before and after incubation with trypsin in PBS buffer solution (10 μM, pH 7.4). The concentration of 3h and BSA solution was 40 μM and 1.6 mg mL−1, respectively, and the concentration of trypsin was 18 mU mL−1. The excitation wavelength was 413 nm and data was monitored at 518 nm. The enzymolysis was carried out at 25 °C for 10 min, slit (3, 1.5). | ||
Upon addition of trypsin to the dye–BSA solution at r.t. for 10 min, the fluorescence intensity decreased rapidly. This is due to the enzymatic hydrolysis of BSA into fragments, resulting in breaking up of the dye–BSA aggregated complex and dispersion of dye 3h molecules in water again. This process caused the fluorescence intensity to decrease gradually. Based on these results, it can be concluded that trypsin enzymolysis can be studied by using our novel water soluble fluorescent probe.
The activity of enzymes can be affected by various factors such as temperature, interfering ions, presence of inhibitors, etc. Based on the high sensitivity, fluorescence measurement was selected for studying the change in activity of the trypsin enzyme (see in ESI Fig. S3†). In the absence of trypsin, the fluorescence intensity of the dye–BSA complex remained unchanged. After addition of trypsin, the fluorescence intensity decreased gradually. The increase of amount of added trypsin results in high initial cleavage reaction rates, thus showing a marked change in the fluorescence. The plot of the rate of enzymolysis was studied at different testing temperatures of 288 K, 298 K and 310 K. At the optimum temperature of 310 K, the intensity decreased most rapidly and the enzymolysis reaction reached the maximum speed.
4 Conclusions
In summary, a new “turn-on” fluorescent probe 3h, was developed for protein detection applications. The carbohydrate moiety not only increases the water solubility, but also enhances the biocompatibility in protein detection after comparing the spectroscopic properties of probe 3h with A and B. The relationship between fluorescence intensity and electronic effect as well as conjugation extent was further confirmed by molecular computation studies. In addition, the probe 3h showed a marked change in fluorescence behaviour through aggregation and disaggregation processes. The dye was used for detection of BSA protein by forming dye–BSA conjugates, and showed a linear relationship between fluorescence intensity and BSA concentration. The presence of trypsin enzyme hydrolysed BSA, and the decreased dye–BSA complex emission was used to measure the activity of the enzyme with good sensitivity. The desirable properties of this biocompatible dye make it a useful fluorescence probe, as presented in this work, and also allow potential applications for cell staining.Acknowledgements
The authors appreciate the support from “The Prospective Joint Project of Production, Education & Research in Jiangsu Province, China (Grant No. BY2013004-02)”.References
- T. J. Magliery, C. G. W. Wilson, W. Pan, D. Mishler, I. Ghosh, A. D. Hamilton and L. Regan, J. Am. Chem. Soc., 2005, 127, 146–157 CrossRef CAS PubMed.
- I. K. Nordgren and A. Tavassoli, Mol. BioSyst., 2014, 10, 485–490 RSC.
- Y. Lin, R. Chapman and M. M. Stevens, Anal. Chem., 2014, 86, 6410–6417 CrossRef CAS PubMed.
- A. Galarneau, M. Primeau, L. E. Trudeau and S. W. Michnick, Nat. Biotechnol., 2002, 20, 619–622 CrossRef CAS PubMed.
- D. A. Torres, M. A. Azagarsamy and S. Thayumanavan, J. Am. Chem. Soc., 2012, 134, 7235–7237 CrossRef PubMed.
- B. Wang, J. Fan, S. Sun, L. Wang, B. Song and X. J. Peng, Dyes Pigm., 2001, 85, 43–50 CrossRef.
- D. S. Pisoni, M. P. Abreu, C. L. Petzhold, F. S. Rodembusch and L. F. Campo, J. Photochem. Photobiol., A, 2013, 77–83 CrossRef CAS.
- R. Borrelli, S. Ellena and C. Barolo, Phys. Chem. Chem. Phys., 2014, 16, 2390–2398 RSC.
- J. J. Shie, Y. C. Liu, Y. M. Lee, C. Lim, J. M. Fang and C. H. Wong, J. Am. Chem. Soc., 2014, 136, 9953–9961 CrossRef CAS PubMed.
- G. Duportail, A. Klymchenko, Y. Mely and A. Demchenko, FEBS Lett., 2001, 508, 196–200 CrossRef CAS PubMed.
- C. H. Xue, V. R. R. Donuru and H. Liu, Macromolecules, 2006, 39, 5747–5752 CrossRef CAS.
- H. Yuasa, N. Miyagawa and T. Izumi, Org. Lett., 2004, 6, 1489–1492 CrossRef CAS PubMed.
- S. Ou, Z. Lin and C. Duan, Chem. Commun., 2006, 42, 4392–4394 RSC.
- R. A. Manderville, A. Omumi, K. M. Rankin, K. A. Wilson, A. L. Millen and S. D. Wetmore, Chem. Res. Toxicol., 2012, 25, 1271–1282 CrossRef CAS PubMed.
- (a) Y. L. Yang, Y. P. Lee, Y. L. Yang and P. C. Lin, ACS Chem. Biol., 2014, 9, 390–397 CrossRef CAS PubMed; (b) T. Fang, K. F. Mo and G. J. Boons, J. Am. Chem. Soc., 2012, 134, 7545–7552 CrossRef CAS PubMed; (c) K. F. Mo, T. Fang, S. H. Stalnaker, P. S. Kirby, M. Liu, L. Wells, M. Pierce, D. H. Live and G. J. Boons, J. Am. Chem. Soc., 2011, 133, 14418–14430 CrossRef CAS PubMed.
- J. X. Wang, Q. Chen, N. Bian, F. Yang, J. Sun, A. D. Qi, C. G. Yan and B. H. Han, Org. Biomol. Chem., 2011, 9, 2219–2226 CAS.
- (a) L. X. Li and Z. J. Fang, Spectrosc. Lett., 2015, 48, 578–585 CrossRef CAS; (b) J. Cheng, Z. J. Fang, S. Li, B. H. Zheng and Y. H. Jiang, Carbohydr. Res., 2009, 344, 2093–2095 CrossRef CAS PubMed; (c) Y. H. Jiang, Z. J. Fang, Q. G. Zheng, H. L. Jia, J. Cheng and B. H. Zheng, Synthesis, 2009, 2009, 2756–2760 CrossRef; (d) T. Fang and Z. J. Fang, Chin. J. Org. Chem., 2010, 30, 38–46 CAS.
- W. W. Feng, Z. J. Fang, J. M. Yang, B. H. Zheng and Y. H. Jiang, Carbohydr. Res., 2011, 346, 352–356 CrossRef CAS PubMed.
- Y. F. Xiang, Z. J. Fang and L. X. Li, Chem. Res. Appl., 2013, 25, 1426–1429 CAS.
- A. K. Misra and G. Agnihotri, Carbohydr. Res., 2004, 339, 1381–1387 CrossRef CAS PubMed.
- F. Rodrigues, Y. Canac and A. Lubineau, Chem. Commun., 2000, 20, 2049–2050 RSC.
- X. T. Liu, J. L. Zhang, K. Li, X. B. Sun, Z. J. Wu, A. Ren and J. K. Feng, Phys. Chem. Chem. Phys., 2013, 15, 4666–4676 RSC.
- M. Gao, Q. L. Hu, G. G. Feng, B. Z. Tang and B. Liu, J. Mater. Chem. B, 2014, 2, 3438–3442 RSC.
- H. Huang, Y. Xu, C. J. Tang, J. R. Chen, A. J. Wang and J. J. Feng, New J. Chem., 2014, 38, 784–789 RSC.
Footnote |
| † Electronic supplementary information (ESI) available. See DOI: 10.1039/c5ra26037j |
| This journal is © The Royal Society of Chemistry 2016 |