Resonance Rayleigh scattering and resonance nonlinear scattering methods for the determination of nicardipine hydrochloride using eosin Y as a probe

Junbo Li, Xiaoli Yang, Jinxiang Yang* and Lina Lai*
Pharmaceutical Department, Changzhi Medical College, Changzhi 046000, China. E-mail: lijunbo81@tom.com; 1250684153@qq.com; Fax: +86 355 3151571; Tel: +86 355 3151571

Received 4th December 2015 , Accepted 22nd February 2016

First published on 22nd February 2016


Abstract

In a Britton–Robinson (pH 3.5) buffer solution, nicardipine hydrochloride (NCD) reacted with eosin Y (EY) to form an ion-association complex of [NCD·EY], which would self-aggregate to form [NCD·EY]n nanoparticles with an average size of 55 nm via the squeezing effect of the aqueous phase and the van der Waals force. As a result, the intensities of resonance Rayleigh scattering (RRS), second-order scattering (SOS) and frequency doubling scattering (FDS) were enhanced and the new scattering spectra appeared. The maximum RRS, SOS and FDS wavelengths were located at 294 nm, 552 nm and 327 nm, respectively. The increments of scattering intensity (ΔIRRS, ΔISOS and ΔIFDS) were directly proportional to the concentration of NCD in certain ranges. The detection limits (3σ) of RRS, SOS and FDS were 1.3 ng mL−1, 2.2 ng mL−1 and 1.6 ng mL−1. The optimum conditions of the RRS method and the influence factors were discussed. In addition, the structure of the ion-association complex and the reaction mechanism were investigated. The shape of nanoparticles was characterized by transmission electron microscopy. The reaction mechanism and the reasons for enhancement of scattering were discussed based on infrared spectra, quantum chemical calculations and absorption spectroscopy. Accordingly, a novel rapid, convenient, sensitive and selective RRS method for determination of NCD was proposed and applied to detect NCD in tablet and urine samples with satisfactory results.

Introduction

Nicardipine hydrochloride (NCD), 2-(N-benzyl-N-methylamino)ethyl methyl 1,4-dihydro-2,6-dimethyl-4-(m-nitrophenyl)-3,5-pyridinedicarboxylate monohydrochloride, is a calcium antagonist of the dihydropyridine class with highly potent vasodilating activity, and has been widely used for the treatment of angina pectoris, hypertension and cerebrovascular disease.1,2 Meanwhile, NCD also has a less negative inotropic effect than other calcium channel entry blockers, so it has been used safely even for hospitalized children and newborns for the management of hypertensive crisis.3,4

Various approaches have been reported for the quantitative analysis of NCD, including spectrophotometry (SP),5,6 fluorescence spectroscopy (F),7 electrochemistry (EC),8 capillary column gas chromatography (GC),9 high performance liquid chromatography (HPLC),10,11 liquid chromatography-mass spectroscopy (LC-MS),12 gas chromatography-mass spectroscopy (GC-MS),13 solid-phase extraction-high performance liquid chromatography (SPE-HPLC)14,15 and capillary electrophoresis (CE).16 Among them, SP methods have been applied in the determination of NCD due to its simplicity. However, the sensitivities were not high enough for trace analysis. GC and HPLC were less efficient and require a number of pretreatment steps of sample. LC-MS and GC-MS were expensive and time consuming. Some other reported methods such as F and EC methods also have some deficiencies in the sensitivity, selectivity or simplicity. Therefore, it is still a worthwhile subject to develop a sensitive, convenient and fast method for the determination of trace NCD.

Resonance Rayleigh Scattering (RRS) and resonance nonlinear scattering, as a newly analytical technique,17 has drawn much more attention due to its sensitivity and simplicity. It has been applied in the analysis of biomacromolecules,18 organic compounds,19 pharmaceuticals20,21 and inorganic ions.22 To the best of our knowledge, the application of EY as probe for the quantitative determination of NCD has not been reported to date. Herein, a simple, rapid, time-saving, low-cost and sensitive assay of NCD by RRS method was proposed for the first time.

Our study showed that in Britton–Robinson (pH 3.5) buffer solution, NCD reacted with eosin Y (EY) to form the neutral hydrophobic complex [NCD·EY], which would self-aggregate to be nanoparticles [NCD·EY]n with an average size of 55 nm via the squeezing effect of the aqueous phase and the van der Waals force. This results in a great enhancement of RRS, second-order scattering (SOS) and frequency doubling scattering (FDS). The maximum RRS, SOS and FDS wavelengths located at 294 nm, 552 nm and 327 nm, respectively. The increments of scattering intensity (ΔIRRS, ΔISOS and ΔIFDS) were directly proportional to the concentration of NCD in certain ranges. The detection limits (3σ) of NCD–EY system were 1.3 ng mL−1 (RRS method), 2.2 ng mL−1 (SOS method) and 1.6 ng mL−1 (FDS method), separately. The sensitivities of the RRS method were not only two orders of magnitude higher than those of common spectrophotometric5,6 and fluorescence7 method, but also higher than those common HPLC10–12,14,15 and electrophoresis.16 Hence, it is more suitable for the determination of trace NCD.

It is known that like other 1,4-dihydropyridines, NCD was found to undergo photodegradation under light exposure leading to molecular changes thus decreasing the therapeutic effects or even causing toxic effects after administration. Due to the high photosensitivity of these drugs, operating conditions should be strictly complied with to keep the light exposure at a minimum. Therefore, an analytical method must be as rapid as possible and based on a low number of steps.23 The proposed method just need to mix NCD and EY in suitable buffer solution, and the reaction could complete in 5 min at room temperature. So the RRS method could completely meet the requirement of simple and fast for the determination of NCD.

In this work, the spectral characteristics of RRS, SOS and FDS, the optimum reactions and the influence factors had been investigated. Furthermore, the mechanism of ion-association reaction and the reasons for the enhancement of RRS were discussed also. The combined use of quantum chemical calculations and infrared spectra, transmission electron microscopy and absorption spectroscopy will permit validation of our hypothesis and provide structural and spectroscopic features on the ion-association complex.

Based on the above mentioned researching, a highly sensitive, simple and rapid method for the determination of trace amounts of NCD by resonance light scattering technique had been developed. The method can be applied satisfactorily to the determination of NCD in tablet and urine samples.

Experimental

Materials and reagents

100 μg mL−1 stock solution of nicardipine (NCD, purchased from the National Institute for the Control of Pharmaceutical and Biological Products (Beijing, China), and were used without further purification) was prepared. The working solution of 10 μg mL−1 was prepared by diluting the stock solution. Eosin Y (EY, purchased from Sigma-Aldrich Co. Tokyo, Japan) working solution concentration was 2.5 × 10⁻⁴ mol L−1. Britton–Robinson (BR) buffer solution with different pH was prepared by mixing the mixed acid (H3PO4, HAc, H3BO3) and 0.2 mol L−1 NaOH in different proportions.

All the reagents used were of analytical reagent grade. Distilled water was used in all the experiments.

A Hitachi F-4600 fluorescence spectrophotometer (Hitachi Ltd. Tokyo, Japan) was used to record the RRS, SOS and FDS spectra and to measure the scattering intensities with the slits (ex/em) of 5.0/5.0 nm for the RRS, 10.0/10.0 nm for the SOS and FDS, the photomultiplier tube (PMT) voltage was 400 V. A TU-1901 UV-VIS spectrophotometer (Purkinje General Instrument Co. Ltd., Beijing, China) was used for recording the absorption spectra. Fourier transform infrared (FT-IR) spectra were recorded as KBr pellets on a Bruker Optics TENSOR 27 spectrophotometer. A JEM-1011 transmission electron microscope (JEOL, Japan) was used to observe the morphology. A pHS-3C meter (Shanghai precision & scientific instrument Co. Ltd., Shanghai, China) was used to adjust pH values.

Experimental methods

Suitable amounts of NCD (10 μg mL−1) were placed in a 10 mL calibrated flask, followed by 0.5 mL BR buffer solution (pH 3.5) and 1.2 mL EY (2.5 × 10⁻⁴ mol L−1) solution. The mixture was diluted with water to the mark and mixed thoroughly. After 5 min, the RRS spectra of the system was recorded with synchronous scanning at λem = λexλ = 0 nm). The RRS intensity (IRRS) for the NCD–EY complex and I0RRS for the reagent blank at their maximum wavelength (λmax) was measured, ΔIRRS = IRRSI0RRS. And the spectra of absorption was also recorded. Simultaneously, the SOS and FDS spectra were recorded by scanning at λex = 1/2λem and λex = 2λem, respectively. The scattering intensity ISOS and IFDS for the reaction product and I0SOS and I0FDS for the reagent blank at their maximum wavelengths were measured, ΔI = II0. All measurements were performed at room temperature (15–20 °C).

Quantum chemical calculations

The DFT calculations have been performed using the Gaussian 09 program package. Geometries were fully optimized without any symmetry constraints at the B3LYP level of theory. Frequency calculations were carried out at the same level of theory.

Results and discussion

RRS spectra

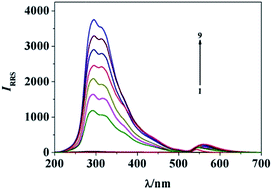
The RRS spectra of NCD–EY system is shown in Fig. 1. From where, it can be seen that the RRS intensities of NCD and EY was very weak. However, when NCD reacted with EY to form the ion-association complex, the RRS intensity was enhanced greatly. The maximum RRS peak was located at 294 nm. It could also be seen from Fig. 1 that the enhancement of RRS intensity of NCD–EY system was directly proportional to the concentration of NCD. So, the RRS method could be applied to the determination of NCD.
image file: c5ra25851k-f1.tif
Fig. 1 RRS spectra of NCD, EY and NCD–EY. 1: NCD, ρ(NCD) = 1.0 μg mL−1; 2: EY, c(EY) = 3.0 × 10⁻⁵ mol L−1; 3–9: NCD–EY, ρ(NCD)/(μg mL−1): 0.1, 0.3, 0.5, 0.7, 0.9, 1.1, 1.3; c(EY) = 3.0 × 10⁻⁵ mol L−1; pH 3.5.

SOS and FDS spectra

Because of the FDS and SOS are a series of nonlinear scattering phenomena produced by RRS and their intensities are weaker than that of RRS. Therefore, the sensitivities of SOS and FDS method are much lower than that of RRS.24 So, in order to improve the sensitivity, the experiment chose to record the SOS and FDS spectra and measured the scattering intensities with the slits (ex/em) of 10.0/10.0 nm. The SOS and FDS spectra of NCD–EY system was shown in Fig. 2 and 3. It can be seen from Fig. 2(a) and 3(a) that (1) the SOS and FDS intensities at different wavelengths are different; (2) under experimental conditions, the SOS and FDS intensities of spectra of EY and NCD were very weak, but the NCD–EY association complex had strong SOS and FDS intensities. Their maximum wavelengths (λex/λem) were located at 276 nm/552 nm (SOS) and 654 nm/327 nm (FDS). The enhancement of SOS and FDS intensity of NCD–EY system was directly proportional to the concentration of NCD [Fig. 2(b) and 3(b)]. Hence, the SOS and FDS method could be applied to the determination of trace of NCD.
image file: c5ra25851k-f2.tif
Fig. 2 SOS spectra of NCD, EY and NCD–EY. (a) 1: NCD; 2: EY; 3: NCD–EY; ρ(NCD) = 1.5 μg mL−1, c(EY) = 3.0 × 10⁻⁵ mol L−1, pH 3.5. (b) NCD–EY, c(EY) = 3.0 × 10⁻⁵ mol L−1; ρ(NCD)/(μg mL−1), 1–3: 0.3, 0.6, 0.9; pH 3.5.

image file: c5ra25851k-f3.tif
Fig. 3 FDS spectra of NCD, EY and NCD–EY. (a) 1: NCD; 2: EY; 3: NCD–EY; ρ(NCD) = 1.0 μg mL−1, c(EY) = 3.0 × 10⁻⁵ mol L−1, pH 3.5. (b) NCD–EY. c(EY) = 3.0 × 10⁻⁵ mol L−1; ρ(NCD)/(μg mL−1), 1–4: 0.3, 0.6, 0.9, 1.2; pH 3.5.

Optimum conditions for the reaction

Of the three methods, RRS assay had the highest sensitivity, so the experimental conditions were optimized by RRS.
Effect of the acidity. The influences of different types of buffer solutions, such as BR, HAc–NaAc and HCl–NaAc were tested. The results showed that the sensitivity and stability of the BR buffer solution were the best. Therefore, the BR buffer solution was chosen to control the pH of the solutions. The enhanced intensities (ΔIRRS) of the systems reached a maximum and remained relatively constant in the pH range 3.0–4.0 (Fig. 4a). In the water solution, EY has the following equilibrium,25
image file: c5ra25851k-t1.tif
according to the dissociation constant of EY (pKa1 = 2.10, pKa2 = 2.85, pKa3 = 4.95),26,27 in pH 3.0–4.0 weak acidic medium, EY mainly exits as a univalent anion HL, which can react with NCD to form a ternary ion-association complex. When the pH value further increases or decreases, H2L or L2− species would increase, which are disadvantageous to the reaction.28 Therefore, BR buffer of pH 3.5 was taken as the reaction medium in the following experiments, and the appropriate amount was 0.5 mL.

image file: c5ra25851k-f4.tif
Fig. 4 Optimum conditions for the reaction. (a) Effect of acidity. ρ(NCD) = 1.0 μg mL−1; c(EY) = 3.0 × 10⁻⁵ mol L−1. (b) Effect of EY concentration. ρ(NCD) = 1.0 μg mL−1; pH 3.5. (c) Effect of ionic intensity. ρ(NCD) = 1.0 μg mL−1; c(EY) = 3.0 × 10⁻⁵ mol L−1; pH 3.5. (d) Effect of reaction time. ρ(NCD) = 1.0 μg mL−1; c(EY) = 3.0 × 10⁻⁵ mol L−1; pH 3.5.
Effect of the EY concentration. The effect of EY concentration on the intensity was studied. According to the experimental results, when the concentration of EY was 3.0 × 10⁻⁵ mol L−1, ΔIRRS reached to the maximum and keep stability in the range of 2.8 × 10⁻⁴ to 3.2 × 10⁻⁴ mol L−1 (Fig. 4b). Without enough EY, the reaction was incomplete, when EY was excessive, the scatting intensity would be reduced, because the reagent blank would enlarge. Therefore, we choose 3.0 × 10⁻⁵ mol L−1 as a suitable EY concentration in the experiment.
Effect of ionic intensity. The effect of ionic strength on the intensity of RRS was investigated by adding the different concentration of sodium chloride (NaCl) solution. The experimental results showed that it had little effect on RRS when NaCl concentration was less than 0.01 mol L−1. However, ΔIRRS decreased gradually with the increasing of the concentration of NaCl (Fig. 4c). Therefore, the ion-association reaction should be in a low ion strength solution.
Reaction speed and the stability. At room temperature, the reaction could complete in 5 min and RRS intensity remained constant for 3 h (Fig. 4d). So, experiment was carried out in 5 min.

Formation of the ion-association complex and its composition ratio

The composition ratio of the ion-association complex is determined by Job's method and molar ratio method. The results showed that the ratio of NCD[thin space (1/6-em)]:[thin space (1/6-em)]EY was 1[thin space (1/6-em)]:[thin space (1/6-em)]1. Hence, NCD could react with EY to form a 1[thin space (1/6-em)]:[thin space (1/6-em)]1 neutral ion-association complex.

Gaussian 09 program was employed to optimize and a frequency calculation to verify the stable structure of NCD molecular. Then NBO analysis was performed based on the optimized geometry. From the results of NBO charge distribution of NCD (Fig. 5), the N atom of has the most negative charge density (−0.620), can attract proton (H+) and be protonated more easily.


image file: c5ra25851k-f5.tif
Fig. 5 NBO charge distribution of NCD.

Eosin Y was a weak acid and its pKa1, pKa2 and pKa3 are 2.10, 2.85 and 4.95, respectively. In pH 3.5 weak acidic medium, the distribution fraction of EY is 80.7%. Although, theoretically, there will be two kinds of enantiotropic isomers produced by the dissociation of hydroxyl and carboxyl, the hydroxyl dissociation is predominant. EY (tetrabromofluorescein), as a halogenated fluorescein, has two electron-withdrawing groups of Br being close to –OH, which reduces the charge density of the oxygen atom on –OH, therefore, –OH tends to dissociate more easily. We use the quantum chemistry DFT method to calculate the system's enthalpy change when –OH on xanthen and –COOH on phenyl dissociated.

The results were −649.02 kJ mol−1 and −453.71 kJ mol−1, respectively. The former emitted 195.31 kJ mol−1 was more than the latter did, which indicated that the system was more stable when –OH dissociated.

Therefore, under the experimental conditions, NCD can be protonized easily and become positive-charged (Fig. 6, I). And this time, EY is existed with one negative charge with EY structure (Fig. 6, II). When the EY and HNCD+ solutions are mixed, EY and HNCD+ will form a 1[thin space (1/6-em)]:[thin space (1/6-em)]1 neutral ion-association complex by the electrostatic attraction and the hydrophobic effect. The reaction is shown as follows (Fig. 6).


image file: c5ra25851k-f6.tif
Fig. 6 The ion-association reactions of NCD with EY.

IR spectra of NCD, EY, physical mixture of NCD with EY and ion-association complex in KBr disk were recorded. Since the difference of the spectrum of reactant and complexes has been observed in the wavenumber range 500–2000 cm−1, the spectrums are shown in Fig. 7. Comparing curve a, curve b and curve c, it is obviously that the curve c was the simple accumulation of curve a and curve b. Each absorption peak in curve c could be found in curve a or curve b, and there was no new absorption band appear. However, contrasting curve c and curve d, the region was completely different. It was shown that the ion-association complex was not a simple mixture of the reactant and the ion association reaction was happened. Moreover, comparing curve b with curve d, we observed that the absorption peaks in 1092 cm−1 and 1243 cm−1 belonging to the γO–H of phenolic hydroxyl in EY were disappeared,29 and the characteristic absorption peak in 1214 cm−1 was observed which could be attributed to the γO–H of carboxyl in EY,25 these demonstrate that the HNCD+ bound with –O to form a neutral ion-association complex.30 The structural characteristics such as shape and size of the reactants and product were observed by TEM. It can be found that the sizes of EY and NCD are small (Fig. 8a and b), the diameters gotten by quantum chemical calculations are 1.52 nm and 1.46 nm, respectively, also indicating that the sizes of EY and HNCD+ are small. However, the complex [NCD·EY] with strong hydrophobicity is not a monomer, it will aggregate to be [NCD·EY]n nanoparticles by squeezing effect of the aqueous phase and the van der Waals force.25,31–33 The nanoparticles disperse uniform in the solution and their average size is 55 nm (Fig. 8c).


image file: c5ra25851k-f7.tif
Fig. 7 IR spectra of NCD, EY, physical mixture and NCD–EY. (a) NCD, (b) EY, (c) physical mixture, (d) NCD–EY.

image file: c5ra25851k-f8.tif
Fig. 8 TEM image and particle size distribution of EY, NCD and NCD–EY. (a) NCD, (b) EY, (c) NCD–EY.

Reasons for RRS enhancement

Resonance enhanced scattering effect. Since RRS is a scattering–absorbing–rescattering process produced by the resonance of the scattering and absorption, RRS band should be closely related to the absorption band. The comparison of the absorption spectrum of the reaction system with the RRS spectrum (Fig. 9) illustrates that the RRS spectrum is located within its molecular absorption band, and two RRS peaks (294 nm and 552 nm) are close to corresponding absorption peaks (279 nm and 520 nm and 565 nm). Therefore, the intensity of Rayleigh scattering is remarkably increased due to the absorption of light and a re-scattering process. Therefore, the resonance enhanced effect is an important reason for scattering enhancement of the ion-association complex system.
image file: c5ra25851k-f9.tif
Fig. 9 Comparison of absorption (a) and RRS (b) spectra for NCD–EY system.
Enlargement of molecular volume. According to the formula of Rayleigh scattering, the increase of the volume of the scattering molecule is advantageous to the enhancement of scattering intensity. Hence, it may be deduced that the formation of [NCD·EY]n nanoparticles which enlarges the volume of the scattered molecular was the main reason for the enhancement of RRS intensity.
Formation of the hydrophobic interface. Before the reaction, EY is one negative charged, while NCD is a cation with one positive charge, and they both are well water-soluble and can form hydrates easily in water. The scattering intensities are very weak under this condition. When they react with each other to form an ion-association complex, their charges are neutralized, and they will lose hydrophilic. The formation of the hydrophobic interface is advantageous to enhancement of scattering. Affected by all the above factors, the intensities of RRS will enhance notably.

Calibration graphs and selectivity of the method

Calibration graphs. Under optimum conditions, NCD with different concentrations reacted with EY and the IRRS, ISOS and IFDS of the ion-association complexes was measured at their own maximum scattering wavelengths by the methods of RRS, SOS and FDS. The calibration graphs of ΔI versus the concentrations of NCD were constructed. Linear regression equation, correlation coefficient, linear ranges and detection limits (3σ) for the calibration curves were shown in Table 1. It can be seen from Table 1 that the three methods have high sensitivities, and their detection limits are between 1.3 ng mL−1 and 2.2 ng mL−1. Among them, RRS method is most sensitive, and could be applied to the determination of trace NCD.
Table 1 Related parameters for calibration curves
Method Linear regression equation [ρ/(μg mL−1)] Linear range/(μg mL−1) Correlation coefficient (r) Detection limit, 3σ/(ng mL−1)
RRS ΔI = 996.1 + 2111.1ρ 0.012–3.0 0.9997 1.3
SOS ΔI = 2181.7 + 2725ρ 0.023–2.5 0.9998 2.2
FDS ΔI = −37.5 + 1111ρ 0.019–2.4 0.9999 1.6


Selectivity of the method. The effect of foreign coexisting substances on the determination of NCD were investigated by pre-mixing NCD with foreign substances, and the results are listed in Table 2. As shown, when the relative error was lower than ±5.0%, the larger amounts of common metal ions, inorganic acid radical ions, as well as the large amounts of some amino acids and urea have little interference.
Table 2 Effects of coexisting substances [ρ(NCD) = 1.0 μg mL−1]
Coexisting substances Concentration (μg mL−1) Relative error (%) Coexisting substances Concentration (μg mL−1) Relative error (%)
Ba2+Cl 300 3.2 β-CD 145 3.1
Ca2+Cl2 180 −4.3 Sucrose 280 −2.6
Mg2+, Cl2 90 0.8 Glucose 78 3.3
NH4+, Cl 120 1.6 Urea 336 2.6
K+, Cl 400 −3.2 Lactose 168 −3.8
Fe3+, Cl3 200 2.6 BSA 100 1.4
K+, Br 210 −2.2 HSA 120 3.5
Na+, NO3 315 3.0 Starch 138 0.7
Zn2+, SO42− 220 0.3 Threonine 56 −4.6
Cu2+, SO42− 187 −2.7 Glycine 58 3.0
Al23+, (SO4)32− 220 2.1 DL-Arginine 49 2.7
K+, H2PO4 300 −1.1 L-Aspartic acid 187 −2.4
Hg2+, Cl2 400 −3.9 L-Histidine 153 3.3
SDS 240 2.5 L-Proline 162 −3.3
SDBS 220 0.9 L-Leucine 145 3.1
CTAB 230 3.0 L-Valine 170 −2.2


Analytical application

Determination of NCD in tablets. Ten tablets (10 mg per tablet) were weighed accurately and ground into a fine powder. A suitable amount of the powder (containing about one quarter of the sample) was accurately weighed and dissolved in water, then leached and the filtrate was transferred into a 250 mL volumetric flask, diluted to the mark with water and mixed thoroughly. Then 10.0 mL of this solution was piped into 100 mL volumetric flask and diluted to the mark as working solution for the assay. The results are listed in Table 3 and are in good agreement with those obtained by the standard method of The Pharmacopeia of the Peoples Republic of China.
Table 3 Determination results of NCD in tablet (n = 5)
Method Mark mg per tablet Found mg per tablet Added mg per piece Total found mg per tablet RSD (%) Recovery (%)
RRS 10.0 10.02 5.0 14.82, 15.05, 15.11, 14.73, 15.21 1.3 99.9
Pharmacopeia method 10.0 9.97 5.0 15.36, 15.01, 14.74, 15.12, 15.29 1.6 100.7


Determination of NCD in human urine samples. Fresh urine samples were observed and centrifuged at 3000 rpm for 30 min, and then the supernatant fluid was separated for analysis. Into 10 mL volumetric flask added 1.0 mL of the filtered human urine, 0.5 mL BR buffer solution (pH 3.5) and 1.2 mL EY (2.5 × 10⁻⁴ mol L−1) solution. The mixture was diluted to the mark with doubly distilled water, and then the flask was inverted 25 times to ensure mixed completely. Then according to the experimental procedure, the concentration of the NCD was determined, the recovery was tested by using the standard addition method (as shown in Table 4).
Table 4 Results for the determination of NCD in urine samples
Sample ρ (found)/(μg mL−1) ρ (added)/(μg mL−1) ρ (total found)/(μg mL−1) RSD (%) Recovery (%)
a Not detected.
Urine 1 NDa 0.3 0.945, 0.954, 0.977, 0.982, 0.941 1.9 96.0
Urine 2 ND 0.6 1.547, 1.495, 1.536, 1.521, 1.543 1.4 101.9
Urine 3 ND 0.9 2.043, 2.013, 2.054, 1.998, 1.978 1.6 100.9


From Tables 3 and 4, it can be seen that the method has a good repeatability for determination of NCD in tablet and urine samples, and relative standard deviation (RSD) is between 1.3–1.9%. So, this method had a high accuracy and a good reproducibility in the determination of NCD in tablet and urine samples. The average recovery was from 96.0–101.9%.

Conclusions

In summary, a new, simple, rapid and accurate method is presented for detecting NCD based on RRS, SOS and FDS. Under the optimum experimental conditions, EY interacted with NCD, a new RRS spectrum appears and the scattering intensity increases dramatically. The analytical results show that RRS method is more sensitive. Therefore, the proposed method was suitable for pharmaceutical preparations and the actual samples rapid determination of NCD in tablet and urine samples, which will provide valuable evidence for clinical doctors to use NCD reasonably and safely.

Acknowledgements

This project was supported by the Scientific and Technological Development Projects in University in Shanxi province (No. 20121101), the Technology Start Funding Project (popular item) in Changzhi Medical College (No. QDZ201515), the Science and Technology Innovation Team Project in Changzhi Medical College (No. CX201409) and National Training Programs of Innovation and Entrepreneurship for Undergraduates (No. 20142199).

Notes and references

  1. T. Chiba, M. Yamanaka, S. Takagi, K. Shimizu, T. Mao and K. Shirai, J. Pharmacol. Sci., 2015, 128, 185 CrossRef CAS PubMed.
  2. M. Koga, S. Arihiro, Y. Hasegawa, Y. Shiokawa, Y. Okada and K. Kimura, J. Stroke Cerebrovasc. Dis., 2014, 23, 2780 CrossRef PubMed.
  3. H. Yui, U. Imaizumi, H. Beppu, M. Ito, M. Furuya and H. Arisaka, Anesthesiol. Res. Pract., 2011, 521084 Search PubMed.
  4. A. L. Hurst, N. Clark, T. C. Carpenter, S. S. Sundaram and P. D. Reiter, Pediatr. Transplant., 2015, 19, E83 CrossRef CAS PubMed.
  5. G. Ragno, C. Vetuschi, A. Risoli and G. Ioele, Talanta, 2003, 59, 375 CrossRef CAS PubMed.
  6. C. Yáñez and J. Squella, Electroanalysis, 2003, 15, 1771 CrossRef.
  7. S. M. Alghannam and A. M. Alolyan, Open Chem., 2008, 6, 222 CAS.
  8. K. Zarei, L. Fatemi and K. Kor, J. Anal. Chem., 2015, 70, 615 CrossRef CAS.
  9. N. Watari, J. Mizumura and S. Higuchi, J. Chromatogr., Biomed. Appl., 1990, 530, 438 CrossRef CAS.
  10. M. I. Walash, F. Belal and N. E. A. Abdelal, J. Liq. Chromatogr. Relat. Technol., 2007, 30, 1015 CrossRef CAS.
  11. K. Li, X. Zhang, Y. S. Yuan and F. L. Zhao, Biomed. Chromatogr., 1998, 12, 326 CrossRef CAS PubMed.
  12. Q. Meiling, W. Peng and J. Xin, J. Chromatogr. B: Anal. Technol. Biomed. Life Sci., 2006, 830, 81 CrossRef PubMed.
  13. I. Hiroshi, K. Masahiko, S. Koichi, T. Hisako, Y. Ken-Ichi and I. Hirotaro, Forensic Sci. Int., 2002, 130, 25 CrossRef.
  14. X. Y. Wei, G. L. Yang, L. Qi and Y. Chen, Talanta, 2009, 77, 1197 CrossRef CAS PubMed.
  15. C. M. Fernandes and F. J. B. Veiga, Biomed. Chromatogr., 2003, 17, 33 CrossRef CAS PubMed.
  16. R. Pomponio, R. J. Gotti, V. Cavrini, P. Mura, M. Cirri and F. Maestrelli, J. Pharm. Biomed. Anal., 2004, 35, 267 CrossRef CAS PubMed.
  17. A. E. Yi, Z. F. Liu and S. P. Liu, Luminescence, 2009, 24, 23 CrossRef CAS PubMed.
  18. Z. X. Cai, G. X. Chen and X. Huang, Sens. Actuators, B, 2011, 157, 368 CrossRef CAS.
  19. Q. L. Yang, Q. M. Lu and Z. F. Liu, Anal. Chim. Acta, 2009, 632, 115 CrossRef CAS PubMed.
  20. J. B. Li, X. L. Yang, J. X. Yang and L. N. Lai, Luminescence, 2014, 30, 643 CrossRef PubMed.
  21. J. B. Li, X. L. Yang, J. X. Yang and Y. B. He, Spectrosc. Lett., 2015, 48, 153 CrossRef CAS.
  22. Q. Li, Z. Q. Han and Y. Chen, J. Chromatogr. A, 2006, 1110, 235 CrossRef PubMed.
  23. S. M. Chen, M. C. Hsieh, S. H. Chao, E. E. Chang, P. Y. Wang and A. B. Wu, Biomed. Chromatogr., 2008, 22, 1008 CrossRef CAS PubMed.
  24. Z. Cai, H. Yu and M. Ma, Spectrochim. Acta, Part A, 2011, 78, 1266 CrossRef PubMed.
  25. L. Kong, Z. F. Liu and X. L. Hul, Sci. China: Chem., 2010, 53, 2363 CrossRef CAS.
  26. N. El-Enany, IL Farmaco, 2004, 59, 63 CrossRef CAS PubMed.
  27. Y. Fujita, I. Mori, M. Toyoda and T. Matsuo, Anal. Sci., 1993, 9, 829 CrossRef CAS.
  28. J. Liu, Z. F. Liu and X. L. Hu, J. Pharm. Biomed. Anal., 2007, 43, 1452 CrossRef CAS PubMed.
  29. M. Q. Zhou, J. D. Peng and R. X. He, Spectrochim. Acta, Part A, 2015, 136, 1181 CrossRef CAS PubMed.
  30. I. Bratu, F. Veiga and C. Fernandes, J. Spectrosc., 2004, 18, 459 CrossRef CAS.
  31. S. G. Yan, Y. R. Tang and M. L. Yu, RSC Adv., 2015, 5, 59603 RSC.
  32. H. J. Peng, M. Q. Zhou and J. D. Peng, Food Anal. Methods, 2015, 1 Search PubMed.
  33. Q. Y. Xu, Z. F. Liu and X. L. Hu, Anal. Chim. Acta, 2011, 707, 114 CrossRef CAS PubMed.

This journal is © The Royal Society of Chemistry 2016
Click here to see how this site uses Cookies. View our privacy policy here.