Measuring the interaction between a pair of emulsion droplets using dual-trap optical tweezers

Marjorie R. Griffithsab, Allan Raudseppc, Kathryn M. McGrathabd and Martin A. K. Williams*bcd
aSchool of Chemical and Physical Sciences, Victoria University of Wellington, New Zealand
bRiddet Institute, Massey University, Palmerston North, New Zealand
cInstitute of Fundamental Sciences, Massey University, Palmerston North, New Zealand. E-mail: M.Williams@massey.ac.nz
dMacDiarmid Institute for Advanced Materials and Nanotechnology, Wellington, New Zealand

Received 25th November 2015 , Accepted 21st January 2016

First published on 25th January 2016


Abstract

Optical tweezers have been used to investigate the dependance of electrostatic inter-particle forces on separation, in systems consisting of pairs of either model silica beads or emulsion droplets. Measurements were carried out as a function of ionic strength and, at salt concentrations where the Debye length was larger than the standard deviation of Brownian fluctuations of the particles in the traps, results were found to agree reasonably well with the predictions of DLVO theory. Experiments were also carried out where the salt concentration of the environment was changed in real-time while interactions were continuously measured. Specifically, single pairs of particles or emulsion droplets were held in a microfluidic channel in close proximity to an interface created between milliQ water and a 5 mM NaCl solution. Changes in the force–separation curves were measured as a function of time and used to monitor changes in the Debye length, and thus the local salt concentration, as ions diffused away from the interface. The results were shown to be consistent with expectations based on a relevant diffusion equation.

Introduction

Studying emulsions with optical tweezers

Emulsions are colloidal dispersions of immiscible liquid phases and are widely found in nature. These dispersions are thermodynamically unstable relative to the bulk separation of their components,1 making the control of their destabilization rates vital in technological applications. While inter-particle forces control several important destabilization processes, such as flocculation and droplet coalescence,2 there are few studies to date that have focused directly on measuring the interactions between pairs of emulsion droplets. Such studies can provide new information on how interactions might vary throughout an ensemble that is not obtainable with more conventional bulk measurements. These interactions are, however, difficult to measure because they are small in magnitude (pN) and often short-ranged (nm), creating unique instrumental challenges.

Optical tweezers (OT) are optical micromanipulators that use a highly focused laser beam to optically trap dielectric particles.3 While optical trapping can be used simply to position particles, the method is also increasingly used to probe forces on microscopic length scales.4–7 With knowledge of the spatial dependence of the optical restoring force, external forces can be inferred from measurements of a trapped particle's displacement. In the past decade technical advances have increased the utility of OT, with tools such as spatial light modulators (SLMs) being applied to generate holographic optical tweezers (HOT) that can be used to dynamically generate multiple steerable traps in the field of view. Moreover, quantitative force measurement can also be carried out using HOT, with measurable forces typically in the range of one to tens of pN.8 Such forces can be measured by using a sensitive photodiode9 or a high-speed camera10 to measure the resulting displacement of a particle from the centre of an optical trap of known spring constant (typically obtained from studying the restriction of the Brownian motion of the particle).

Despite the obvious potential of OT in the colloid science arena only a few investigations have been carried out on the trapping and manipulation of emulsion droplets using the technique.11–13 Ward et al. showed in 2006 that it was possible to deform oil droplets with low surface tensions using optical traps11 and Bauer et al. studied the pH-dependent interactions of individual droplets using OTs in 2011,12 although no quantitative force–separation curves were obtained. Most recently, a proof of concept study has been reported showing that it is possible to qualitatively measure interactions between emulsion droplets brought into contact with each other.13 Using optical traps to position emulsion droplets and measure inter-particle forces can potentially offer advantages in ease of sample preparation over other approaches to direct force measurement such as AFM14 and micropipettes,15 where droplets have to be attached to cantilevers or other surfaces. In addition, by holding both droplets in optical traps, rather than, for example, one with a micropipette, they are still free to rotate and there are no complications arising from modified hydrodynamic interactions owing to the introduction of nearby obstructions.

In this paper we investigate inter-particle forces between pairs of model silica beads and emulsion droplets and interpret results using DLVO theory. The paper is arranged as follows:

(1) In order to demonstrate the capabilities of the method, the inter-particle forces between model silica beads of a known size were directly measured at high resolution as a function of bead separation. The interactions were examined between separate pairs of beads in milliQ water and at increasing salt concentrations.

(2) Next, a diffusion-based method was developed using the model silica bead system, in which the salt concentration of the environment was changed in real time. Here the evolution of the interactions between a single pair of beads with increasing salt concentration was measured.

(3) Using the approach developed above, and with special attention paid to experimentally determining particle size, the interaction between separate pairs of emulsion droplets of differing size was examined in milliQ water.

(4) Finally, the real-time diffusion method was used to measure the evolution of the interaction forces between a single pair of emulsion droplets.

We show that, using OT, quantitative interaction forces can be measured between emulsion droplets as they approach one another, and that physically meaningful data can be extracted from the measured force–separation curves.

DLVO theory

Electrostatic inter-particle forces are of key importance in determining the stability of colloidal suspensions. When a bead is immersed in an aqueous solution, the surface becomes charged through ionic adsorption and the dissociation of ionizable surface groups.16 Aqueous solutions contain cations and anions that interact with partial charges on the surface, creating a net surface charge, and immersed beads are surrounded by a cloud of counter-ions extending into the solution known as the electrical double layer. When two charged beads come into close proximity and the electrical double layers of the beads overlap, a repulsive force is induced, arising from the excess concentration of counter-ions in the region of the double-layer overlap. This force can be overwhelmed by the addition of salt, so that while colloidal particles can be electrostatically stabilized against van der Waals-driven flocculation in a low-ionic-strength environment, aggregation may still ensue at higher ionic strengths. DLVO theory is routinely used to describe the stability of electrostatically-stabilised colloidal suspensions.15,17,18 The theory describes a short-ranged attraction, attributed to dispersion forces, and a longer-range screened Coulomb repulsion.

The electrostatic contribution derived from the DLVO theory is given (when x < 2R) by:

 
F(x) = 64πRkBTcbulkΓ2κ−1[thin space (1/6-em)]exp(−κx) (1)
where x is the surface-to-surface separation between two colloidal spheres of radius, R, kBT is the thermal energy, cbulk the concentration of ions, and κ−1 the Debye length. The Debye length (in units of nm) for monovalent salts, at 25 °C in water, can be given by:
 
κ−1 = 0.304/cbulk0.5 (2)
and Γ2 in eqn (1) by:
 
Γ2 = σ2/(32kBTcbulkε0εr) (3)
where ε0 is the permittivity of free space, εr, is the relative permittivity and σ2 is:
 
σ2 = e2Z2/(4πR2)2 (4)
with e, the elementary charge and Z, the total number of charges. The expression for the electrostatic force acting between two spherical particles can then be simplified by combining expressions so that the parameters that dictate the magnitude of the force are the charge, particle size, and Debye length (salt concentration). The resulting simplified function that was used to fit the force–displacement curves presented here is given by:
 
F(x) = (e2Z2/(8πε0εrR3))κ−1[thin space (1/6-em)]exp(−κx). (5)

The zeta potential (ζ) can be determined for individual beads from knowing the surface charge Z and the Debye length obtained from fitting the force–displacement curve. The relationship between surface charge and ζ potential is given by:

 
Z = (/kBT)(R/λb)(1 + κR) (6)
where the Bjerrum length, λb = e2/(4πε0εrkBT), is the separation at which two elementary charges have an electrostatic interaction energy of kBT.

Experimental

Experimental work was carried out using Holographic Optical Tweezers (HOT) (Arryx, Chicago USA) to translate a trapped particle towards another similar particle held in a fixed trap (Fig. 1). Specifically, the optical traps were formed using (i) a maximum 2 W, λ = 1064 nm diode laser with a Boulder NLS phase-only SLM modulating the phase to control trap positions in 3-D and (ii) a maximum 5 W, λ = 1030 nm diode laser, which formed a fixed trap. Holograms for SLM control were generated using the software HOT-Utility, supplied by Arryx.
image file: c5ra25073k-f1.tif
Fig. 1 OT set-up.

Both the fixed and translating beads (or emulsion droplets) were imaged in bright-field using a Nikon, Eclipse TE2000-U microscope with a 60×, numerical aperture 1.2, plano-apo, water-immersion objective in combination with a 1.5× auxiliary, for a total magnification of 90×. Images of the interactions were captured using a 16-bit CMOS camera (Andor NEO) using acquisition frame rates of between 250 and 500 s−1, and exposure times of 1–2 ms, at background intensities of ∼20 kcounts unless otherwise noted. All analysis was performed using Matlab (Mathworks). Trap spring constants were determined by measuring the restricted Brownian motion of the particles under study, acquired using the high-speed camera with integration times properly taken into account. Particle positions in 3D were obtained with a particle-tracking algorithm using an interpolation-based normalized cross-correlation approach.19

Interactions between pairs of mono-disperse spherical silica beads with nominal diameters of 1.850 μm (Bangs Laboratory Inc, CV 10–15%) were examined. The beads were diluted so that there were only a few beads per 100 μL. The medium used for dilution varied depending on the environment to be probed, with either ultra-pure milliQ water, with a resistivity of ∼18.2 MΩ cm, or sodium chloride solutions at concentrations from 100 μM to 5 mM being used. The dilute bead solutions were kept on ice to inhibit bacterial growth.

Interactions between pairs of sodium-caseinate-stabilised soybean oil-in-water emulsion droplets were also examined. Concentrated emulsions were prepared at 60 wt% oil, with 1 wt% sodium caseinate in a 100 mM pH 7.0 sodium–phosphate buffer. The emulsion was pre-emulsified using a hand-held mixer and then homogenised using 3 passes at 103 MPa (Avestin, EmulsiFlex-C5). Emulsions were stored at 4 °C and were kept no longer than 1 week before experiments were performed. The emulsions had a droplet size D [3, 2] = (3.2 ± 0.8) μm as measured by static light scattering (Malvern Mastersizer). To carry out the force measurements emulsions were diluted by a factor of around 108, resulting in ionic concentrations in the diluted solutions close to those found in the diluent.

For the interaction studies between separate pairs of particles, the dilute dispersions were examined in welled slides. The solution was introduced into the well, coverslips placed on top, and the well sealed with nail polish to eliminate evaporation as well as drift during the experiment. The same beads or emulsion droplets could be trapped and manipulated for many hours.

The diffusion-based interaction studies on the same pairs of particles were conducted in a single channel of a multi-channel glass microfluidic chip (Micronit, Enschede, NL, flow cell, FLC50.3). The chip contained three single channels of approximately 50 μm depth: A, B and C: only channel B, (1.5 × 40 mm; 2.8 μL), was used for these experiments. Slim bonded-port connectors (Labsmith, C360-400S) were glued onto the microfluidic chip with quick dry epoxy resin (LabSmith). Several coats of epoxy resin were applied to ensure a strong connection to the microfluidic chip and were left to dry overnight. An interface demarcating volumes of differing ionic strength was created by injecting a known volume of salt solution into one end of the filled-channel, displacing a certain volume of the milliQ water initially filling the channel. The channel was subsequently sealed (One-Piece Plug, C360-101, LabSmith). A pair of silica beads or emulsion droplets, selected from a population that had been dispersed at low concentration in the milliQ water were identified, trapped using laser tweezers, and were held close to (and with the axis joining their centres perpendicular to) the salt solution–water interface. Diffusion of ions from the interface allowed the salt concentration at the particle's position to slowly change over-time with minimal mechanical perturbation.

Results and discussion

Interactions between separate pairs of silica beads

The electrostatic interactions between pairs of silica beads were first measured in milliQ water. In each measurement one of the beads (held in a steerable SLM-generated trap) was stepped towards the other bead (held stationary in a fixed trap). Fig. 2(a) shows an illustrative progression of images recorded during such a measurement: bead B is stepped toward bead A until bead A is displaced from the centre of the trap in which it is constrained. When bead B is retracted, bead A returns to its unperturbed position, in the centre of its optical trap. The displacement induced when the beads are in close proximity is proportional to the force acting between the two beads. The starting positions of the beads were chosen so that when the beads were close there was minimal z-displacement and the dominant force was in the direction of the bead approach.
image file: c5ra25073k-f2.tif
Fig. 2 (a) Visualization of the interaction between two silica beads in water in a welled-slide. Bead B is stepped toward bead A between t1 and t3, then stepped away t3 and t5. The white dashed line is included for reference. (b–g) Tracked positions of the bead in the fixed (bottom row) and moving traps (top row) in the y, x and z positions. The moving bead was stepped in the y-direction. The tracked data have been corrected for drift and smoothed over the frame rate 250 s−1 (note the different y-scales). It can be seen that when the beads are close, the stationary bead is predominantly displaced in the direction of approach (y-direction). However, there is also detectable movement in the x and z directions. The effect of the corresponding bead-trap interaction is plotted along side the bead–bead interaction in red.

More specifically, the approach and retraction of the moving bead described a triangular waveform with a peak-to-peak amplitude of 800 nm and a total period of 120 s (120 steps) (Fig. 2(b)). Images (120 × 100 pixels) were collected at 250 s−1, with an exposure time of 2 ms. This protocol produced a total measurement time of 4 minutes, and approximately 60[thin space (1/6-em)]000 frames. Each interaction sequence was completed in duplicate. Additionally, the same sequence was repeated twice more, once with the moving trap empty and secondly with the stationary trap empty (the tracked motion of the single beads present in these control experiments is shown in red in Fig. 2). These control measurements were subtracted from the corresponding bead–bead interaction data in order to account for the fact that when the beads are at close separation each trap can exhibit a small attractive force on the bead held in the opposite trap.

The laser powers for the stationary (λ = 1030 nm) and moving traps (λ = 1064 nm) were fixed at ∼1 W. The trap spring constants were determined by observing the variance of the Brownian fluctuations of the trapped beads over 2000 frames when they were well separated using:

 
kx = kBT/〈x2 (7)
where kx is the trap spring constant, kBT is thermal energy and 〈x2〉 is the variance. The measured trap strengths in the experiments carried out using silica beads in water are given in Table 1.

Table 1 The measured trap strengths using silica beads in millQ water with the laser power set to 1.0 W
Bead Power [W] kx [pN μm−1] ky [pN μm−1] kz [pN μm−1]
(A) Fixed 1.0 8.45 7.73 1.57
(B) Moving 1.0 5.22 6.21 1.84


Once the position data were determined from image sequences, and the trap spring constants calculated, the force between the silica beads could be calculated. First, the centre-to-centre displacement between the two beads was determined using:

 
rAB = ([xBxA]2 + [yByA]2 + [zBzA]2)0.5 (8)
where rAB is the center-to-center separation between the two beads, xB is the x-position of the moving bead, xA is the x-position of the stationary bead, etc. Then the force was calculated using Hooke's law, F = kx, where k is the trap strength and x is the displacement. The force is reported as the sum of the individual force components recorded in the x, y and z directions, each projected along the vector joining the centres of the particles:
 
FrA = (kxA[xAxAC])([xAxB]/rAB) + (kyA[yAyAC])([yAyB]/rAB) + (kzA[zAzAC])([zAzB]/rAB) (9)
 
FrB = (kxB[xBxBC])([xAxB]/rAB) + (kyB[yByBC])([yAyB]/rAB) + (kzB[zBzBC])([zAzB]/rAB) (10)
where xBC is the x-position of the moving bead in the empty trap experiment, xAC is the x position of the stationary bead in the empty trap experiment, etc. With the force directed along centre-to-centre vector determined, the relationship between force and surface-to-surface separation, rABRARB, can be calculated. A typical force–separation curve measured as described with our dual trap optical tweezers set-up is shown in Fig. 3(a). With silica bead sizes assumed to be 2RA = 2RB = 1.85 μm based on the manufacturer's specifications, the solid line is the result of a fit to eqn (5). The surface charge density extracted from the fit is (5.4 ± 0.1) × 103 e μm−2, in reasonable agreement with calculations of the surface charge of silica as a function of pH and ionic strength16 and with previous work that found (2.0 ± 0.2) × 103 e μm−2 in 1 μM solution20 and (7.4 ± 1.3) × 103 e μm−2 in KCl solutions with ionic strengths greater than 40 μM.21 The Debye length is found to be (109 ± 10) nm, giving an ionic strength for the water of (8 ± 2) μM (consistent with expectations for milliQ water). The resolution is remarkable.


image file: c5ra25073k-f3.tif
Fig. 3 Measured force–separation curves of silica beads (2a = 1.85 μm) in welled-slides and fits to eqn (5). (a) In milliQ-water, and (b–d) in NaCl solutions. Nominal (i.e. not accounting for the ions in the milliQ water initially) ionic strengths are given in the figures.

To explore this method further, the interactions between silica beads were measured at increasing ionic strengths (decreasing Debye lengths), controlled by means of salt addition. It is well known that salt impacts the electrostatic forces between colloidal particles: an increase in salt reduces the Debye length,16–18 resulting in a shorter ranged repulsion, and typically leads to the destabilization of colloidal solutions (e.g. flocculation). Eqn (2) shows the relationship between the Debye length, κ−1, and monovalent salt concentration, CI, at 25 °C. Each interaction (at a different salt concentration) was carried out using a different pair of silica beads. However, it should be noted that for these silica particles interactions in the same environment were reproducible within experimental uncertainties, so that the differences seen in different salt conditions were assumed to reflect the effects of the environment and not the change in the specific bead pair. The reproducibility suggests that in this case there is little pair-to-pair variation or that any significant heterogeneity in surface properties is averaged over on the time-scale of the measurement (the rotational diffusion coefficient is expected to be of the order of 0.1 rad2 s−1).

Fig. 3(b)–(d) shows the force separation curves measured in solutions with approximate salt concentrations of 100, 500, and 1000 μM NaCl; again the resolution is remarkable. The corresponding fits to eqn (5) are also shown. At a nominal salt concentration of 100 μM, the Debye length extracted from the force curve agrees reasonably well with expectations, (27 ± 2) nm, corresponding to (123 ± 20) μM (and the surface charge density (11 ± 2) × 103 e μm−2 is again in fair agreement with prior experimental and theoretical work).

It should be noted however, that at higher salt concentrations the decay constants extracted from the fits do not match with the expected Debye lengths despite the seemingly exponential form of the data. Instead, the decay constants more closely follow the standard deviation of thermal fluctuations of the particles as determined by trap strength. We hypothesize that when the Brownian excursions of the beads within the trap are large, some particle trajectories are excluded and a repulsive entropic force results. A thorough investigation of this phenomena forms part of ongoing work. For now, it should be noted that while weak trap strengths increase the resolution of the measurement by maximizing the magnitude of excursions generated by small forces, if the length scale of the Brownian fluctuations becomes greater than the length scale over which the repulsive electrostatic force is significant, then the apparent force curve must be analyzed with care. Under such conditions the data simply fitting an exponential functional form is no guarantee that the Debye length can be faithfully recovered from the decay constant.

Interactions between a single pair of silica beads with increasing salt concentration

Ultimately, to probe the dependence of the interactions on environmental conditions, such as ionic strength, temperature and pH, in systems such as emulsions, where care must be taken in order to account for the possible influence of droplet-to-droplet heterogeneity, measurements need to be repeated with the exact same pair of particles while environmental conditions are changed. Therefore, a method was developed where the same pair of beads could be introduced to new environments and resulting changes in force directly measured. This was demonstrated by measuring the evolution of force–separation curves obtained from the same pair of silica beads during an increase of salt concentration and was successfully carried out by using a microfluidic channel. First, an interface between particle-containing water and a salt solution was produced in the channel simply by successive injections of the different solutions. A pair of beads was then located and held trapped on the water-side of the interface for an extended period of time, during which the local salt concentration changed in a predictable manner owing to diffusion of ions from the interface formed with the more concentrated solution, and force measurements were sequentially carried out. Specifically, silica beads were trapped within a sealed microfluidic channel at a position 1.29 cm away from a millQ-water/5 mM NaCl solution interface and the interactions between this single pair of beads were measured over 2.8 hours. The preparation of the microfluidic chip is detailed in Experimental section. The set-up is shown in Fig. 4.
image file: c5ra25073k-f4.tif
Fig. 4 Image of the mounted microfluidic chip used for this diffusion experiment. Water and beads were added to the right side of the chip and a 5 mM NaCl solution was added to the left side of the chip, creating an interface at 1.29 cm from the objective (the beads were trapped where the objective is positioned in the photograph). The chip was sealed to ensure a static environment.

The force–displacement curves measured over time, as ion diffusion increased the local salt concentration at the position of the particles, are presented in Fig. 5(a). Here 13 interaction measurements were collected over 2.8 hours. Measurements were collected at times of 4, 15, 96, 101, 113, 127, 132, 138, 147, 154, 159 and 168 minutes from the time the salt solution was introduced into the channel creating the interface. The gap in time between 15 minutes and 96 minutes was used to acquire reference images for use with the 3D-tracking. As salt diffused into the water from the interface, the silica bead interactions became shorter-ranged resulting in shorter Debye lengths, as expected. The force–separation curves were fitted to the electrostatic component of the DLVO theory (eqn (5) and Fig. 5(a)) and the particle charge, Debye lengths, and thus corresponding measured local salt concentrations were extracted (Fig. 5(b)).


image file: c5ra25073k-f5.tif
Fig. 5 (a) Force–separation curves of silica beads as a function of time as the local salt concentration was increasing. 13 measurements were taken over 2.8 hours. Fits in solid black lines. (b) Shows the evolution of the salt concentration extracted from the changing force curves, shown in (a), as a function of time (inferred from the Debye lengths shown in Table 2) compared with the behaviour predicted by the standard one-dimensional diffusion formalism (eqn (11)).

Table 2 shows the results from fitting the time-resolved measured force–displacement curves. The Debye lengths and zeta potentials are presented alongside the corresponding R2 value of the fits, showing excellent agreement to the predicted functional form for all force–separation curves. Eqn (2) was used to determine the salt concentrations from the fitted Debye lengths (note that these measurements are all within the range where the Debye lengths are considerably larger than the root mean square excursions of the beads in the traps).

Table 2 The results from fitting silica bead force–separation curves (Fig. 5) to eqn (5). The square of the number of charges on the beads, the Debye lengths and corresponding salt concentrations (eqn (2)) are presented. The R2 values are also reported. Note that the uncertainties are 95% confidence limits from the non-linear regression of the functional from to the data, but do not account for other systematic uncertainties such as those in the size of the particles
# t [min] κ−1 [nm] c [μM] Z2 [×109] ζ [mV] R2
1 4 114.5 ± 0.4 6.9 ± 0.1 3.18 ± 0.01 121 ± 5 0.9852
2 15 89.0 ± 0.3 11.4 ± 0.1 4.81 ± 0.01 104 ± 6 0.9845
3 96 60.2 ± 0.4 24.8 ± 0.3 2.46 ± 0.02 58 ± 0.5 0.9699
4 101 62.3 ± 0.4 23.8 ± 0.3 1.97 ± 0.01 54 ± 0.3 0.9651
5 113 49.3 ± 0.2 38.1 ± 0.2 2.33 ± 0.02 48 ± 0.2 0.9792
6 127 38.5 ± 0.3 62.5 ± 0.8 2.54 ± 0.01 44 ± 0.2 0.9773
7 132 45.1 ± 0.2 45.4 ± 0.6 1.71 ± 0.01 47 ± 0.6 0.9746
8 138 32.4 ± 0.2 86 ± 1 2.53 ± 0.02 31 ± 0.2 0.9664
9 147 32.0 ± 0.2 90 ± 1 2.13 ± 0.01 36 ± 0.2 0.9827
10 154 30.5 ± 0.2 97 ± 2 2.07 ± 0.01 30 ± 0.2 0.9775
11 159 30.8 ± 0.2 98 ± 1 1.90 ± 0.01 27 ± 0.2 0.9763
12 168 28.3 ± 0.2 115 ± 2 1.87 ± 0.01 25 ± 0.4 0.9745


Assuming the ion diffusion in the microfluidic channel is one-dimensional and that the initial salt concentration, CI0, is maintained at the water/salt solution interface, the salt concentration at a known distance from the interface x, can be calculated at any time, t:

 
CI = CI0 erfc (x/(4Dt)0.5) (11)
where erfc is the complementary error function and D is the diffusion constant,22 taken as D = 1.5 × 10⁻⁹ ms−2.

Fig. 5(b) shows the evolution of the salt concentration extracted from the changing force–separation curves, shown in Fig. 5(a) as a function of time (inferred from the Debye lengths shown in Table 2) compared with the behaviour predicted by the standard one-dimensional diffusion formalism presented in eqn (11). There can be seen to be reasonable agreement.

These results demonstrate the application of dual-trap optical tweezers to directly measure interactions between micron-sized colloidal particles, and the ability to record data in multiple environments using the same pair of beads. This method is now applied to measuring the interaction between a pair of emulsion droplets.

Interactions between separate pairs of emulsion droplets

Theories of interaction between colloidal particles are ultimately cast in terms of distances between surfaces, whilst accurate tracking methods generally return information on the centre-to-centre separation. Mapping to surface-to-surface separation is trivial if the particle radii are well known. However, individual emulsion droplets generally have unknown sizes that vary to some degree from droplet to droplet, so that to obtain useful measurements of their interactions their sizes must also be experimentally determined.

The sizes of individual emulsion droplets selected for interaction measurements were determined by measuring the restricted diffusion of the droplets in weak SLM-generated optical traps.19 Each droplet was trapped in a low-power SLM trap (0.2 W) and the thermally-driven movement of the droplet was filmed (3 × 5000 frames per bead, at 500 Hz, with an exposure time 1 ms, background ∼10 kcounts). The region of interest (ROI) analysed was chosen so that the Brownian excursions of the droplets remained inside the selected area, which resulted in an 80 × 80 pixel area with our 60× objective. Corresponding reference images and background images were collected at the same exposure time for particle tracking. The positions were determined by 3D particle tracking as described in detail elsewhere.19

To demonstrate the sizing method the restricted diffusion of silica beads of known size was first investigated (2R = 1.85 μm, CV 10–15%). The measured mean-squared-displacement (MSD) of such a silica particle was measured in the x, y and z directions and the experimental data were found to fit to a model calculation taking a diffusion coefficient of D = 2.13 × 10⁻¹³ m2 s−1, consistent with the given bead size, and the viscosity of water.

The same method was applied to emulsion droplets of an unknown size. Here, the diffusion constant was chosen based on how well the model calculation agreed with the experimentally measured MSD. Fig. 6 shows the experimentally measured MSDs for two different emulsion droplets. The best fits to a restricted diffusion model, (validated using silica beads as described above), were achieved with diffusion constants 1.2 × 10⁻¹³ m2 s−1 and 0.7 × 10⁻¹³ m2 s−1 respectively, resulting in diameters of 1.80 and 3.09 μm. Realistically the uncertainty in the radii of droplets measured in this manner is around 50 nm, although it is worth noting that in fact the large permissible “translations along the x-axis” of the force–separation curves that result from uncertainties in the droplet radii have little effect on the extracted Debye length.


image file: c5ra25073k-f6.tif
Fig. 6 Mean squared displacement of two emulsion droplets with MSD model calculations achieved with diffusion constants of (a) 1.2 × 10⁻¹³ m2 s−1 and (b) 0.7 × 10⁻¹³ m2 s−1 respectively.

The interactions between pairs of protein-coated oil droplets, sized as described, were measured in millQ water using the same method demonstrated above for silica beads. Fig. 7(a)–(c) shows the interactions between 3 different pairs of sodium-caseinate-stabilised oil droplets in water. Corresponding fits to eqn (5) are shown in red and are found, as was the case with silica beads, to capture the data well.


image file: c5ra25073k-f7.tif
Fig. 7 (a–c) Force–separation curves measured for three pairs (pair 1–3) of sodium-caseinate-stabilised oil droplets in milliQ water. (d) Corresponding images of the well-separated droplets are also shown.

Images of each pair of droplets at their maximum separation are also presented (Fig. 7(d)). The measured droplet sizes that correspond to the interaction measurements presented in Fig. 7 are given in Table 3 (calculated as discussed). It can be seen that the individual droplets of each selected pair were found to be similar in size and that “pair 2” had the largest droplets, consistent with visual observations, (Fig. 7(d)). Also presented in Table 3 are the results of fits to the electrostatic force component of the DLVO theory. It can be seen that each interaction measurement fitted well to the proposed functional form. The corresponding Debye lengths and thereby the ionic strengths of the environments (assuming a monovalent salt and 25 °C) are also given. The ion concentrations extracted are all close to that commonly reported for de-ionised (milliQ) water of ∼10 μM and the ζ-potentials appear of reasonable magnitude (−93 ± 3; −61 ± 2; −98 ± 4 mV) (note these uncertainties are only from fitting and do not include estimates of the effects of other systematic errors, such as the relatively large uncertainty in droplet size). While these values are individually different from a bulk measurement, which returned (−50 ± 5) mV, small variations in ionic strengths could easily explain these differences. Assessing how homogeneous the ensemble might be in reality forms part of further work that can now be tackled using the methodology developed here. It should be noted that calculating the charge per square micron surface area yields (5.8 ± 0.5) × 103, (5.5 ± 0.5) × 103 and (5.7 ± 0.5) × 103 e μm−2 respectively for the three different emulsion droplet pairs studied, the similarity of the results providing further confidence in their meaningful nature.

Table 3 Diffusion coefficients, D, and corresponding droplet radii obtained from fitting the short time MSD behaviour for the three pairs of droplets presented in Fig. 7. The Debye lengths, κ−1, salt concentrations, c, and the square of the droplet's surface charges, determined from the fitted force–separation curves are also reported. The ζ potential was calculated from eqn (6). The R2 values again show excellent fits of the measured force–separation curves to the predicted functional form. Uncertainties have been calculated from the 95% confidence bounds of the fitting procedure, except for the droplet radii uncertainties that have been assessed from the sensitivity of the predicted restricted diffusion calculation to changes in radius
  Pair 1 Pair 2 Pair 3
DA [μm2 s−1] 0.115 0.100 0.255
DB [μm2 s−1] 0.115 0.090 0.225
RA [μm] 1.87 ± 0.05 2.15 ± 0.05 0.84 ± 0.05
RB [μm] 1.87 ± 0.05 2.38 ± 0.05 0.95 ± 0.05
κ−1 [nm] 74.5 ± 1.3 55.4 ± 0.4 87 ± 2
c [μM] 16.6 ± 0.6 30.1 ± 0.4 12.2 ± 0.4
Z2 [×109] 65 ± 1 126 ± 10 3.8 ± 0.1
ζ [mV] −93 ± 1 −61 ± 1 −98 ± 6
R2 0.97 0.93 0.97


Interactions between a single pair of emulsion droplets with increasing salt concentration

The nature of emulsions presents a unique challenge as droplet-to-droplet variation is expected to be likely. This droplet heterogeneity may include droplet size, surface charge and distribution of charge, as well as steric contributions from surfactants and emulsifiers. Therefore, to understand how emulsion droplets interact when subjected to multiple environments, interaction measurements must be carried out on the very same pair of droplets. Here, such a capability is demonstrated by measuring the interactions between a single pair of emulsion droplets as a function of increasing salt concentration, using the diffusion of ions from an interface created in a microfluidic channel, as established using silica particles.

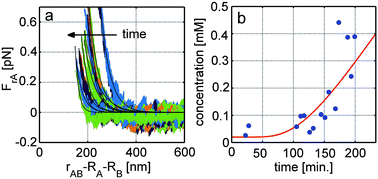
Two emulsion droplets were trapped within a microfluidic chip, at a known distance (1.15 cm) from an interface created between millQ water and a 5 mM NaCl solution (with the axis joining the centres of the droplets parallel to the interface). The sizing of these droplets was described above and shown in Fig. 6. The force–displacement curves, measured over time as salt diffused from the interface, thus locally increasing the ionic strength, are presented in Fig. 8(a). Here 15 interactions were collected over 3.3 hours. The times corresponding to each interaction measurement are given in Table 4. The gap in time between 28 minutes and 105 minutes was the time where reference images were collected for use with the 3D-tracking of the droplets. As salt diffused into the water from the interface, the interactions between the emulsion droplets become shorter ranged, as expected. The force–separation curves were fitted to the electrostatic component of the DLVO theory, as described previously, and the square of the surface charges, the Debye lengths, and corresponding salt concentrations were extracted (see Table 4).


image file: c5ra25073k-f8.tif
Fig. 8 Force–separation curves of emulsion droplets as a function of time as the local salt concentration was increasing owing to the diffusion of ions from an interface with a 5 mM salt solution. Fifteen measurements were taken over 200 min (a) shows the interaction data in colour and their corresponding fits (eqn (5)) in solid black lines. (b) The salt concentrations extracted from the time-resolved force data as a function of time. The prediction of the diffusion formalism is shown in red.
Table 4 The results obtained from fitting the force–separation curves shown in Fig. 8 using eqn (5). The Debye lengths, corresponding salt concentrations (eqn (2)) and the squares of the number of charges on the droplets are presented. Note that the uncertainties are 95% confidence limits from the non-linear regression of the functional from to the data, but do not account for other systematic uncertainties such us those in the size of the particles
# t [min] κ−1 [nm] c [μM] Z2 [×109] ζ [mV] R2
1 22 59.8 ± 0.2 25.8 ± 0.2 9.5 ± 0.1 84 ± 1 0.97
2 28 38.8 ± 0.2 61.5 ± 0.5 28.2 ± 0.7 97 ± 1 0.97
3 105 39.9 ± 0.3 58.0 ± 0.7 14.3 ± 0.3 70 ± 2 0.97
4 112 30.9 ± 0.3 97 ± 1 28 ± 1 79 ± 3 0.95
5 117 30.6 ± 0.3 99 ± 2 25.7 ± 0.8 74 ± 2 0.97
6 126 49.6 ± 0.2 37.6 ± 0.4 6.8 ± 0.1 60 ± 1 0.95
7 132 42.1 ± 0.2 52.2 ± 0.6 8.1 ± 0.2 55 ± 2 0.95
8 145 29.9 ± 0.2 103 ± 1 16.7 ± 0.5 85 ± 3 0.95
9 151 31.8 ± 0.2 91 ± 1 11.2 ± 0.3 50 ± 2 0.95
10 157 22.4 ± 0.2 185 ± 4 32 ± 2 62 ± 4 0.89
11 168 27.3 ± 0.2 124 ± 2 12.1 ± 0.5 46 ± 2 0.93
12 173 14.5 ± 0.3 445 ± 21 121 ± 30 88 ± 6 0.79
13 188 15.5 ± 0.4 387 ± 18 60 ± 12 62 ± 10 0.75
14 194 19.5 ± 0.5 243 ± 12 18 ± 3 45 ± 24 0.74
15 199 15.4 ± 0.4 389 ± 21 46 ± 10 58 ± 12 0.63


Fig. 8(b) shows the local salt concentration at the position of the held particles, extracted from the time-resolved force–separation curves. Here, results calculated from the diffusion equation are also presented in order to predict the salt concentration at the position of the droplets, assuming that CI0 = 5 mM, and the interaction measurement takes place 1.15 cm from the interface. Table 4 also presents the results of the fits to the electrostatic component of the DLVO theory. Measurements 1–5 recovered reasonable estimates for the Debye length, and the fits all resulted in R2 values of greater than 0.95. Furthermore, the presented ζ-potentials of the droplets calculated using eqn (6) are also very reasonable (Table 4). At later times, when the length scale of the interaction was reduced, the travel of the approaching particle did not sample a large repulsion and the curves, while not clearly changing functional form, became considerably noisier, leading to considerably lower R2 values. Nevertheless, while these measurements show considerably more scatter than the silica-bead force measurements presented, the general trend is consistent with expectation.

The emulsion-droplet force–separation curves presented show no evidence of droplet deformation and fit to the same theory used in the analysis of the hard-sphere silica measurements presented, at least at low salt concentrations. The droplets (or beads) never actually came into contact during the interaction measurements reported here and while longer-ranged repulsions could perhaps induce a slight deformation, this is likely to be insignificant compared to the full-contact force between the droplets as applied in AFM or recent OT measurements.13,23–27 It is also worth noting that in studies where deformation has been seen in interaction measurements the droplets are typically an order of magnitude larger than the droplets studied in this work (with a concomitant reduction in Laplace pressure).

Extending this work to higher ionic strength forms part of ongoing work. While these systems represent the greatest challenge owing to the decreasing length scale over which significant interactions extend it is exactly in this region that richer behaviour might be expected. It is well known for example that the ionic strength greatly impacts on the conformation of the protein at the interface, affecting the interfacial tension and surface charge. Such conformational changes that potentially generate new charged groups at the interface at higher ionic strengths would clearly be expected to impact on the interactions between droplets and in principal might be measureable. Although, much work is still required to investigate such possibilities this research shows that multiple environments can be probed with the same pair of emulsion droplets, using dual trap optical tweezers.

Conclusions

The interactions between pairs of sodium-caseinate-stabilized emulsion droplets have been measured as a function of separation, and for the first time their force–displacement curves have been fitted to the electrostatic component of the DLVO theory. When the root mean square excursions of the beads in the traps are smaller than the Debye lengths, then fitting successfully recovered reasonable estimates of the Debye length and the droplet's surface charge.

Acknowledgements

The authors would like to acknowledge Simon Hall for support and interesting discussions and IFS Mechanical Workshops for experimental support.

Notes and references

  1. P. Becher, Emulsions Theory and Practise, Oxford University Press, 2001 Search PubMed.
  2. E. Dickinson, An Introduction to Food Colloids, Oxford Science, Oxford, 1992 Search PubMed.
  3. A. Ashkin, J. M. Dziedzic, J. E. Bjorkholm and S. Chu, Opt. Lett., 1986, 11, 288–290 CrossRef CAS PubMed.
  4. U. F. Keyser, B. N. Koeleman, S. vanDorp, D. Krapf, R. M. M. Smeets, S. G. Lemay, N. H. Dekker and C. Dekker, Nat. Phys., 2006, 2, 473–477 CrossRef CAS.
  5. K. C. Neuman and A. Nagy, Nat. Methods, 2008, 5, 491–505 CrossRef CAS PubMed.
  6. O. Brzobohaty, T. Cizmar, V. Karasek, M. Siler, K. Dholakia and P. Zemanek, Opt. Express, 2010, 18(24), 25389–25402 CrossRef CAS PubMed.
  7. S. Suei, A. Raudsepp, L. M. Kent, S. A. J. Keen, V. V. Filichev and M. A. K. Williams, Biochem. Biophys. Res. Commun., 2015, 466, 226–231 CrossRef CAS PubMed.
  8. A. Farré, A. van der Horst, G. A. Blab, B. P. Downing and N. R. Forde, J. Biophotonics, 2010, 3, 224–233 CrossRef PubMed.
  9. D. delToro and D. E. Smith, Appl. Phys. Lett., 2014, 104, 143701 CrossRef PubMed.
  10. A. van der Horst and N. R. Forde, Opt. Express, 2010, 18, 7670–7677 CrossRef CAS PubMed.
  11. A. D. Ward, M. G. Berry, C. D. Mellor and C. D. Bain, Chem. Commun., 2006, 4515–4517 RSC.
  12. W. A. C. Bauer, J. Kotar, P. Cicuta, R. T. Woodward, J. V. M. Weaver and W. T. S. Huck, Soft Matter, 2011, 7, 4214–4220 RSC.
  13. J. Nilsen-Nygaard, N. Sletmoen and K. I. Draget, RSC Adv., 2014, 4, 52220 RSC.
  14. R. F. Tabor, C. Wu, F. Grieser and D. Y. C. Chan, Soft Matter, 2013, 9, 2426–2433 RSC.
  15. C. Gutsche, U. Keyser, K. Kegler, F. Kremer and P. Linse, Phys. Rev. E: Stat., Nonlinear, Soft Matter Phys., 2007, 76, 031403 CrossRef CAS PubMed.
  16. S. H. Behrens and D. G. Grier, J. Chem. Phys., 2001, 115, 6716–6721 CrossRef CAS.
  17. B. Derjaguin, A. Titijevskaia, I. Abricossova and A. Malkina, Discuss. Faraday Soc., 1954, 18, 24–41 RSC.
  18. Y. Liang, N. Hilal, P. Langston and V. Starov, Adv. Colloid Interface Sci., 2007, 134, 151–166 CrossRef PubMed.
  19. A. Raudsepp, M. Griffiths, A. J. Sutherland-Smith and M. A. K. Williams, Appl. Opt., 2015, 54(32), 9518–9527 CrossRef PubMed.
  20. T. Squires and M. P. Brenner, Phys. Rev. Lett., 2000, 85, 4976 CrossRef CAS PubMed.
  21. C. Gutsche, M. M. Elmahdy, K. Kegler and I. Semenov, et al., J. Phys.: Condens. Matter, 2011, 23, 184114 CrossRef CAS PubMed.
  22. J. Crank, The Mathematics of Diffusion, Oxford University Press, Oxford, 1979 Search PubMed.
  23. A. P. Gunning, A. R. Mackie, P. J. Wilde and V. J. Morris, Langmuir, 2004, 20, 116–122 CrossRef CAS PubMed.
  24. R. R. Dagastine, G. W. Stevens, D. Chan and F. Grieser, J. Colloid Interface Sci., 2004, 273, 339–342 CrossRef CAS PubMed.
  25. R. R. Dagastine, R. R. Manica, S. L. Carnie, D. Y. C. Chan, G. W. Stevens and F. Grieser, Science, 2006, 313, 210–213 CrossRef CAS PubMed.
  26. R. F. Tabor, F. Grieser, R. R. Dagastine and D. Y. C. Chan, J. Colloid Interface Sci., 2012, 371, 1–14 CrossRef CAS PubMed.
  27. A. P. Gunning, A. R. Kirby, P. J. Wilde, R. Penfold, N. C. Woodward and V. J. Morris, Soft Matter, 2013, 9, 11473–11479 RSC.

This journal is © The Royal Society of Chemistry 2016