In vivo detection of fluoride at trace levels and its removal from raw water at neutral pH utilizing a cyanobacterium pigment as a luminescent probe

Mousumi Chatterjee, Chandan Ghosh, Milan K. Barman, Bhavya Srivastava, Dipika Roy and Bhabatosh Mandal*
Department of Chemistry, Visva-Bharati, Santiniketan-731235, India. E-mail: bhabatosh_mandal@yahoo.co.in

Received 21st November 2015 , Accepted 18th December 2015

First published on 22nd December 2015


Abstract

A selective method has been developed for trace level (0.01 mg L−1) fluoride detection in HEPES buffer in the presence of interfering ions (such as Cl, I, Br, SO42−, ClO4, and CH3COO) using a cyanobacterium as a luminescent probe. It is able to detect trace levels well below the PHS recommended levels for drinking water (0.7–1.2 ppm), which places this probe among the most sensitive fluoride sensors reported to date. The cellular pigment, phycocyanobilin 2, of living algae plays an anchoring role to sense fluoride at trace levels via instantaneous fluorescence. Algal biomass was used for the removal of fluoride from raw water at neutral pH. The maximum uptake capacity (BTC: 6.76 mg g−1 and Q0: 6.08 mg g−1) and preconcentration factor (PF: 64.2) were found to be appreciably high. Interference caused by the presence of several co-existing ions is also discussed. The proposed method has been applied to real samples, such as pond water, well water and ground water, with good analytical reliability: removal of fluoride up to 92.3% ± 1.3%, with a relative standard deviation of 2–3%, and re-usability of 70–90 cycles.

1. Introduction

Recently, research on receptors and sensors for anions is attracting considerable interest because of the importance of anions in environmental, biological, and chemical processes.1 Fluoride intake is always regarded as a double-edged sword. On the one hand, fluoride plays a beneficial role in treating osteoporosis and protecting dental health,2 on the other hand, excessive ingestion of fluoride may cause fluorosis3 and urolithiasis.1,4 Fluorosis, which is caused by high fluoride concentrations (>1.5 mg L−1), has been reported in various countries, including India, Argentina, UK, South Africa, the United States, Norway, Mexico, China, and Poland.3,4 Fluoride toxicity leads to enhanced bone density and cancer.5 Due to the adverse and beneficial effects of fluoride, the development of sensors for trace level fluoride detection has fascinated many researchers.6 To date, most of the reported and common sensor designs involve polarization of the –NH protons in heterocyclic nitrogen pyrrole and indole moieties6 or in urea, thiourea, pyrrole, amide, and imidazolium7 moieties, wherein the design strategies are mostly sophisticated, expensive and sometimes exhibit delayed response for a particular recognition event.7 Moreover, the developed fluoride sensors mainly work via one of the following strategies: anion–π interactions,8 fluoride–hydrogen bonding at the –NH proton,6,9 irreversible cleavage of the O–Si bond10 and Lewis acid–base interaction (boron–fluoride complexation).11 These methods have disadvantages such as (a) the formation of the B–F bond in tri-coordinated organoboron, which has the interference of cyanide and (b) the interference of the fluoride assisted cleavage of Si–O bond by thiols.12 A Rhodamine imidazole derivative has recently been utilized for the fluorescence imaging of fluoride in HeLa cells under physiological conditions.13 Herein, we report the design of a biosensor based on an algal pigment (which is present inside living cyanobacterium) appended Rhodamine B dye, which enables the trace level detection of fluoride ions, in vivo, selectively. It is a known fact that along with trace level detection, the removal of fluoride in real samples poses a challenge to analytical chemists. The control of fluoride contamination in groundwater is difficult because fluoride contamination is influenced by many hydrogeologic and physicochemical parameters.14 Many defluoridation methods have been critically reviewed15,16 and adsorption is now evolving as a frontier defense. Selective adsorption utilizing titanium-rich bauxite,17 various forms of quartz,18 aluminum sorbent,19 aluminum-impregnated carbon,20 activated alumina,21 alum-impregnated activated alumina,22 aluminum-type superparamagnetic adsorbents,23 activated carbons (ACs), carbon black,24 red mud,25 zeolite,26 chitin and chitosan,27 magnetic chitosan particles,28 lime stone,29 biomass and carbonized biomass,30 carbonaceous materials,31 and bone char32 have been reported. Metabolic specificity for a given toxicant can be advantageous in bioremediation strategies for bioaccumulation.33,34 Biosorption offers a potential alternative to conventional processing methods, mainly because of its low cost, strong metal binding capacity, high sorption efficiency in dilute effluents, environmental friendliness and, more importantly, because of the use of self maintained adsorbent beds.33,34 Moreover, it provides a cost-effective solution for industrial wastewater management.35 In the present study, the analytical applicability of Phormidium luridum (microalgae) as a biosorbent and biosensor for the detection, recovery, and removal of fluoride has been rationalized for following reasons. First, this toxicant is of high concern and is attracting mounting interest in the scientific community due to its duplicitous nature (used in human diet, drinking water should contain ≤1.5 mg L−1; however, recently it has been accused for several human pathologies).2–6 Second, a limited number of studies are available on the treatment by algal species (fresh and marine water) in spite of their ubiquitous distribution and their central role in the fixation and turnover of carbon.36,37 Moreover, this potential biosorbent can easily intake fluoride inside its living cells.38

Our present study proposes a selective, rapid, eco-friendly and cost-effective method for the detection, preconcentration, separation, recovery and removal of aqua fluoride-species (asymm.) from an aqueous solution of a complex nature (comprised coexisting ions in concentration ranges similar to their natural abundance) at near neutral pH (6.5–6.8) by cyanobacterium. More importantly, global hardness (η) is a definite quantum mechanical descriptor and is the cardinal index of chemical reactivity, as well as the stability of atoms and ions.39 A standard density functional theory (DFT)40 calculation has thus been performed, not only to analyze the structure of the extractor site and the extractor–[(assym. HF2 (aq.))] complex, but also to rationalize the sorption pathway in terms of hardness.

2. Experimental

2.1 Apparatus and reagents

An Olympus BX41 epifluorescence trinocular microscope fitted with a digital camera, Nikon Coolpix 4500, at a magnification of 45 × 10 was used to identify the specific algal strain. Fluorescence micrographs were recorded on a Leica microscope (model no: Leica DM1000, Germany) fitted with a digital camera (Leica DF420C), at a magnification of 45 × 10 utilizing the LAS (Leica Application Suite) Software (Version 4.1.0). The experimental setup is as follows: left part (A): excitation (UV source), excitation filter (BP340-380), mirror (400), suppression (LP425); middle part (I3): excitation (blue source), excitation filter (BP450-490), mirror (510), suppression (LP515); right part: excitation (green source), excitation filter (BP515-560), mirror (580), suppression (LP590). Confocal microscopy images were taken on a LEICA TCS SP8 inverted microscope using the LASX Software with a 405 nm laser source for excitation. pH measurements were conducted using a digital Elico L1-120 pH meter combined with a glass electrode. Scanning electronic microscopy (SEM) images of the algae was obtained at 15 kV on an S530 HITACHI, Japan scanning electron microscope. Fourier transform infrared (FTIR) spectra of the biosorbent in its F loaded and unloaded forms were obtained in the range of 4500–500 cm−1 on a Shimadzu FTIR spectrophotometer (model no. FTIR-8400S) using sample[thin space (1/6-em)]:[thin space (1/6-em)]KBr pellets in the weight ratio 1[thin space (1/6-em)]:[thin space (1/6-em)]10. The amount of fluoride was estimated using an ion selective electrode, Thermo Scientific (Orion 5 Star Benchtop Multi W/ISE meter, Singapore). A thermostat was used to carry out the extraction under a controlled temperature. Different salt solutions were prepared by dissolving NaCl, NaNO3, NaH2PO4 and NaF in distilled water. All the chemicals and solvents used in this study, unless otherwise stated, were of analytical grade (BDH, Mumbai, India/E Merck, Mumbai, India). A Perkin Elmer LS-55 spectrofluorometer was used to carry out the fluorescence titration experiments.

2.2 Identification of algae

Axenic culture of the green microalgae, P. luridum, which was originally isolated from a soil sample, was collected from river basin, Ajoy33,34 and maintained in the Analytical Laboratory, Department of Chemistry, Visva-Bharati, for use in this study. An aliquot of culture was grown in 100 mL Erlenmeyer flasks containing 25 mL of BG 11 (+)33,34 in an orbital shaker set at 150 rpm under 3 × 36 W cool white fluorescent light at 24 ± 2 °C.41 P. luridum was identified15 within three days of its collection without fixation by comparing various standard monographs with our microscopic observation using an Olympus BX41 epifluorescence trinocular microscope.

2.3 Trace level detection of fluoride

Fluorescence micrographs were recorded to observe the transport of fluoride inside the living cell. The cultures were examined under a microscope for the presence of any contaminating fluorescent materials or debris in the medium other than the autofluorescent microalgal cells. After staining with Rhodamine B, algal cells were exposed to fluoride to observe its effect on the fluorescent pattern for Rhodamine B. Micrographs were taken at 10, 15 and 20 minutes of incubation with a fixed concentration of fluoride (0.01 mg mL−1). Micrographs were also obtained at fixed time intervals (10 minutes) of incubation with different initial fluoride concentrations (0.01–0.1 mg L−1). The same investigations were also conducted with algal cells: either having no chlorophyll-a or containing completely damaged chlorophyll-a, to determine the role of this pigment in the formation of any type of fluorescence pattern inside the cell itself. Algal cells in acetone were centrifuged at 1000 rpm for 3 hours to completely remove chlorophyll-a and the mass was collected after filtering through a sterile membrane filter of 0.45 μm pore diameter. On the other hand, algal cells were placed under the stress of fluoride (≥15 mg L−1) and incubated for a period of 15 days to obtain cells containing completely damaged chlorophyll-a. An untreated culture (in the absence of fluoride), which was incubated similarly to the treated culture served as a control. Considering its analytical application in real samples, micrographs were also taken for the detection of fluoride (0.01 mg mL−1) together with several other commonly occurring anions (Cl1−, Br1−, I1−, SO42−, ClO4, and CH3COO) and cations, such as Na+, K+, Cr3+, Cu2+, Co2+, Ni2+, Zn2+, Cd2+, Hg2+, and Pb2+, in their natural contamination concentration (50–300 mg L−1) ranges. Confocal microscopy images were obtained at an excitation of 552 nm and emission of 568–597 nm laser sources to determine the role of algal pigments in the fluorescence pattern inside the cell.

2.4 Systematic studies on luminescence properties

Chlorophyll-a was extracted with 90% acetone.34 A set (five) of fluorescence samples in DMSO was prepared by dissolving extracted chlorophyll-a. Fluorescence spectra of chlorophyll-a were obtained on a Perkin Elmer LS-55 spectrofluorometer at varying concentrations (0.325 × 10⁻⁶ to 5 × 10⁻⁶ M). The effect of Rhodamine B (0.2 × 10⁻⁶ to 0.5 × 10⁻⁶ M) on the fluorescence pattern of chlorophyll-a at a fixed concentration was investigated. Fluorescence patterns of solutions containing chlorophyll-a and Rhodamine B a fixed concentration (0.325 × 10⁻⁶ M) was investigated over the range of fluoride concentration of 0.168 × 10⁻⁶ to 0.782 × 10⁻⁶ M. The luminescence properties of all the systems were evaluated at an excitation wavelength of 330 nm.

2.5 Influence of fluoride exposure

Assays were conducted with an exponentially growing culture of P. luridum (3 × 10⁴ cells per mL) in 25 mL of BG 11 (+). Algal suspensions were placed in a set of cuvettes containing fluoride solutions (5 mL) in the range of concentration of 10–50 mg L−1. Micrographs of P. luridum (both pure and algal cells under stressed conditions) at different time intervals (1–14 days) were recorded on an Olympus BX41 epifluorescence trinocular microscope fitted with a digital camera (MC 120 HD at a magnification of 45 × 10) to observe any morphological changes.

2.6 Sorption studies

Fluorescence and confocal microscopic studies indicate the definite transport of fluoride inside the algae cells. Systematic investigations were conducted (both batch and column methods) on the sorption (at required time intervals to attain equilibrium) of fluoride [(assym. HF2 (aq.)); η = 15.21 eV] at different initial concentrations (10–50 mg L−1) over the pH range of 6.5–7.5.
2.6.1 Batch experiment. Systematic studies on batch equilibrium experiments were conducted to determine the optimum pH, contact time, temperature, and solution concentration for quantitative sorption of fluoride on the surface of the biomass. A set of six flasks (250 mL) containing biomass (0.1 g) were shaken at a constant rate (1000 rpm), and allowed sufficient time to obtain adsorption equilibrium. It is assumed that an optimum shaking speed allows all the surface areas to come in contact with the analyte over the entire period of the experiment. The study was carried out at room temperature (27 °C), which represents environmentally relevant condition.
2.6.1 (i) Adsorption isotherm. 0.1 g biomass was added to 100 mL fluoride solution of different initial concentrations (8–20 mg L−1) at neutral pH. The solutions were stirred at 1000 rpm for 10 min and the amount of fluoride adsorbed per unit mass, qe (mg g−1), was computed (eqn (1)).34
 
qe = (CiCe)V/m (1)
where Ci and Ce are initial and equilibrium concentrations (μg mL−1), m is the mass (g) of biosorbent, and V is the analyte volume (mL). The different parameters of the batch experiment are given in Table 1.
Table 1 Langmuir and Freundlich parameters [algae: 0.1 g; sample volume: 100 mL; temperature: 27 °C; and stirring: 1000 rpm]a
Ce (mg L−1) qe (exp.) (mg g−1) Ce/qe (g L−1) qe (theoretical) RMSE
Langmuir Freundlich Langmuir Freundlich
a Differences between the theoretical and experimental values for qe are shown in parenthesis.
08 3.2000 2.5 3.07355(0.1265) 3.1771(0.0229) 0.09 0.06
10 3.3667 2.9703 3.41103(−0.04433) 3.4445(0.0778)    
12 3.7651 3.1872 3.68043(0.08467) 3.67978(0.0853)    
14 3.8674 3.6200 3.9005(−0.0331) 3.8909(−0.0235)    
16 4.0794 3.9221 4.08358(−0.0042) 4.0838(−0.0044)    


The correlation coefficient, R2, and the residual root mean square error (RMSE) (eqn (2)) were used to examine the goodness-of-fit for the applicability of the Langmuir (eqn (3)) and Freundlich (eqn (4)) isotherms.33,34 A maximum R2 and minimum RMSE value obtain the applicability of the isotherms.

 
image file: c5ra24713f-t1.tif(2)
[where qe = the experimental value (average of three determinations), qe(t) = estimate from isotherms for the corresponding qe and m = number of observations].
 
image file: c5ra24713f-t2.tif(3)
&
 
image file: c5ra24713f-t3.tif(4)
where qe is the amount of fluoride sorbed (mg g−1), Q0 is the monolayer adsorption capacity (mg g−1), b is a constant related to the binding energy for the fluoride to algal surface (L mg−1), and Ce is the fluoride concentration at equilibrium (mg L−1). With an increase in b, more and more adsorbate is adsorbed (i.e., image file: c5ra24713f-t4.tif will decrease), which, in turn, decreases the intercept and appreciates the Langmuir parameter. The adsorption constants, KF and 1/n, specifically, are measures of adsorption capacity and adsorption intensity, respectively. KF is an empirical parameter, which is composed of three components: a binding constant, a term related to the number of adsorption sites, and solution composition. Practically, the solution composition is constant for any given water sample. Thus, in practice, only the binding constant and the number of surface sites are the true contributors of KFs. The parameter, n, is a measure of the affinity between the sorbate and surface. Sorption ability increases with an increase in n.42 The Freundlich isotherm, 1/n, can be estimated based on the structure of the adsorbent cell surface and the density of carboxyl groups on this surface.43

2.6.2 Column experiments. Batch adsorption equilibrium isotherm studies suggest the maximum sorption capacity for monolayer saturation (Q0) of the ion exchange material and binding energy of adsorbates to the ion exchange surface (b: mL μM−1), adsorption capacity (KF) and adsorption intensity (1/n) of the adsorbent. However, repetitive filtrations are required in both the extraction and elution steps; thus, column chromatography is an effective alternative.
2.6.2 (i) Preparation of exchanger bed. Columns (0.8 × 28 mL) were packed with inactivated biomass (1 g) containing naturally occurring sand and gravel, which were collected from the river side. An aliquot containing fluoride (20 ppm) in raw water at neutral pH was passed through the column containing micro algae at a flow rate of 4 mL min−1. After extraction, fluoride was stripped with 5 mL 0.005 M NaNO3 and its quantity in every 2 mL fraction was determined using an ion selective electrode.
2.6.2 (ii) Effect of pH on extraction. pH is considered to be the most important parameter in the biosorptive process because it may affect the solution chemistry of adsorbates, activity of the functional groups in biomass and competitive ions.44,45 Systematic studies at the pH range of 2.5–7.5 were conducted to determine the effect of pH on the sorption of fluoride.
2.6.2 (iii) Breakthrough capacity and preconcentration factor. The exchanger bed was thoroughly cleaned with distilled water. A fluoride solution (0.02 mg mL−1) was passed (4 mL min−1) through the column containing 1 g of dry biomass. After saturation through extraction, fluoride was eluted with 5 mL 0.005 M NaNO3. To determine the effect of foreign ions on the retention of fluoride, an analyte solution (100 mL) containing Cl, I, Br, SO42−, PO43−, ClO4, and CH3COO (Na+/K+ salts) in their natural contamination range (50–100 mM L−1) was passed through the column at fixed optimum values of all other variables. With respect to the application of the developed method for the removal of fluoride in real samples, some analyses were performed with various water samples (pond, well and tap water).
2.6.2 (iv) Effect of temperature on sorption. The feed (fluoride: 0.02 mg mL−1) was passed through the exchanger bed (1 g biomass) at the temperature range of 278–298 K to investigate the involvement of different thermodynamic parameters in the sorption process. From the slope of the linear relationship (y = −3.2763x + 13.0222) between 1000/T and log[thin space (1/6-em)]Kd, ΔH was evaluated (eqn (5)) and utilizing the standard van't Hoff equation (eqn (6) and (7)), ΔG and ΔS at 300 K were determined.46
 
ΔH = −(slope) × 2.303 × R (5)
 
ΔG = −2.303RT[thin space (1/6-em)]log[thin space (1/6-em)]Kd (6)
&
 
image file: c5ra24713f-t5.tif(7)
where R (8.314 J mol−1) is the gas constant.

2.7 Computational studies

Phycocyanobilin 2 is a fluoride sensing pigment present in live algae.34 Consequently, single crystal XRD for the precise geometry of the phycocyanobilin 2–fluoride complex is not possible. Thus, as an alternative, a reliable DFT calculation was performed to achieve the 3D structural configuration of fluoride loaded phycocyanobilin 2. The geometry of the fluoride loaded complex was optimized with Becke's three parameter hybrid exchange functional and the Lee–Yange–Parr correlation functional (B3LYP)47–49 by exploiting the 6-31 + G** basis set. Optimization was carried out without any geometrical constraints. To ensure that the optimized geometries correspond to true minima on a potential energy surface, vibrational frequencies were computed using DFT(B3LYP/6-31 + G**). All these calculations were carried out using the Gaussian 09 package.40

3. Results and discussions

3.1 Physico-chemical properties of the sorbent

P. luridum is a multi celled green algae species. It is filamentous in shape, approximately 450–600 μM in length and 2–10 μM in diameter (Fig. 1). The SEM images of the loaded and unloaded form (Fig. S1) indicate that the exchange material is porous and fluoride incorporation influences the structure of the material. Microalgae contain (i) a relatively high nitrogen content (2–4 wt%) due to the protein component, (ii) significantly higher amounts of alkali earth metals and accumulated heavy metals, (iii) a high halogen content (2.5–4.5 wt%) due to its saline environment (mainly associated with Na), (iv) moisture content of 8–12%, and (v) about 1–2 wt% lipid fraction.50 The pure algae exhibit three major steps of weight loss (Fig. S2) corresponding to the thermal decomposition (in TGA) of different bio-polymers.50 The first step (<180 °C) corresponds to dehydration, the 2nd step (180–600 °C) corresponds to devolatilisation, and a region for the decomposition of mineral oxides occurs at the 3rd step (>600 °C).50 The devolatilisation includes the stepwise decomposition of different bio-polymer fractions. The gradual loss in mass above 600 °C may be attributed to the decomposition of the oxides of the mineral components in pure algae.50,51
image file: c5ra24713f-f1.tif
Fig. 1 Effect of fluoride (≥15 mg L−1) on chlorophyll-a at different time intervals: (a) 24 hours (b) 48–72 hours (c) 72–96 hours and (d) ≥8–12 days.

3.2 Detection of fluoride

Fluorescence microscopy is indispensable to the biological sciences because of its high sensitivity, selectivity with which it could be used to analyze signals, and its non-destructive character, which make it possible to carry out in vivo experiments for real-time analyses.52 A very weak fluorescence (for the autofluorescence pigment, chlorophyll-a) was obtained from pure algae cells and its intensity did not differ noticeably in presence of fluoride (Fig. 2(a) and (b)). However, intense red colored fluorescence images of higher intensity were obtained for the Rhodamine B-stained algal cells (Fig. 2c). The recognition of fluoride (at a very trace level: 0.01 mg L−1) was sensitized by an instantaneous yellow fluorescence (Fig. 2(d)–(f) and 3), which glitters on the intense red colored area achieved after staining with Rhodamine B, inside the cell. Both the fluoride concentration and contact time gave a positive influence on fluorescence intensity (Fig. 2 and 3). Moreover, it was not affected by the presence of foreign ions such as Cl, I, Br, SO42−, ClO4, and CH3COO. This indicates selective fluoro-complexation with algal pigments. Algae cells with damaged chlorophyll-a or without chlorophyll-a also obtained the same fluorescence pattern inside the cell (Fig. 4). Outside the cell either Rhodamine B itself or its presence with fluoride does not give any detectable color changes. Consequently, the cellular pigments of living algae, with the exception of chlorophyll-a, seem to play an anchoring role in the formation of a very highly fluorescent sensitive complex (red) with Rhodamine B, which is subsequently able to sense fluoride at trace levels via instantaneous glittering (yellow fluorescence). Confocal microscopic studies on pure algae cells indicate that the chlorophyll-a pigment, which resides just beneath the cell surface (0.6–1.0 μm), produces a weak signal consisting of only two fluorescence plates (each of 0.3 μm in thickness) (Fig. 5i(a) and (b)). This result agrees with the fluorescence micrographs (Fig. 2(a) and (b)). On the other hand, confocal microscopic images of algal cells (either having chlorophyll-a or not) stained with Rhodamine B, produce a more intense signal for fluoride. These two sets of images (having chlorophyll-a or not) (Fig. 5ii(a)–(n) and iii(a)–(l)) consist of about 12–14 fluorescence plates (starting after the 7th plate), which appear because of some different pigments located far away (2.1–2.6 μm within the cell) from the cell surface of the algae. Systematic studies on the luminescence properties of three different solution systems in DMSO medium: (a) chlorophyll-a of varying concentrations, (b) chlorophyll-a of a fixed concentration (5 × 10⁻⁶ M) containing Rhodamine B of varying concentrations and (c) a fixed concentration of both chlorophyll-a and Rhodamine B (5 × 10⁻⁶ M and 0.5 × 10⁻⁶ M, respectively) containing fluoride of varying concentrations show that the luminescent character (intensity and number/nature of peaks) is of the same order of magnitude for each of the solution systems (a, b, and c) (Fig. 6). The fluorescence intensity in Fig. 6c was found to increase slightly (only 15–18 units) with an appreciable increase in fluoride concentration (7 fold). Thus, practically, fluoride has no influence on chlorophyll-a. This also clearly indicates that the interaction between Rhodamine B and chlorophyll-a is not responsible for the more intense coloration of the Rhodamine B stained-cell fluorescence image (Fig. 2c). It should also be noted that chlorophyll-a of the fluoride-contaminated microalgae was found to be affected from the 2nd day and is completely damaged in ≥12 days at a concentration of fluoride of >15 mg L−1 (Fig. 1(b)–(d)). This indicates slow kinetics. On the other hand, fluorescence micrographs (Fig. 2–4) suggest that transport of fluoride inside the algal cell follows fast kinetics (required time: 10–20 minutes). This reveals that fluoride does not directly interact with chlorophyll-a, but it favors the proximity of other algal pigments such as phycocyanobilin 2 and this affects the system. Phycocyanobilin 2 is a unit protein of phycobilisome (PBSs)53 and it is also the light harvesting antenna, which is connected with the photosystems and transfers light energy to the photosynthetic light reaction center, chlorophyll-a.54,55 Thus, fluoride instantaneously attacks the algal pigment, phycocyanobilin 2, and as a secondary effect, it slowly affects chlorophyll-a by preventing the transfer of light energy. Both chlorophyll-a and phycocyanobilin 2 contain four pyrrole rings in their molecular structures (Fig. 7). Because of its small size and high charge density, among all other anions fluoride has the highest affinity for protons and ability to interact with hydrogen-containing polar groups such as NH.1 The heterocyclic nitrogens in chlorophyll-a (Fig. 7a) are tightly bonded with Mg(II) and does not have any –NH proton for fluoride binding through H-bonding. On the other hand, phycocyanobilin 2 contains a large amount of attackable heterocyclic-NH6 protons (Fig. 7b) in its pyrrole rings for hydrogen bonding with F, which is an established mechanistic path in fluoride sensing.6
image file: c5ra24713f-f2.tif
Fig. 2 Fluorescence micrographs of P. luridum in the presence of interfering ions such as Cl, I, Br, SO42−, ClO4, and CH3COO: (a) pure algae cell (b) pure algae cell in the presence of fluoride (c) algae cell stained with Rhodamine B; (d–f) influence of fluoride concentration on algae cell stained with Rhodamine B, at a constant time interval (10 minutes): (d) 0.01 mg L−1, (e) 0.05 mg L−1 and (f) 0.1 mg L−1.

image file: c5ra24713f-f3.tif
Fig. 3 Fluorescence micrographs of P. luridum in the presence of interfering ions, such as Cl, I, Br, SO42−, ClO4, and CH3COO: (a) algae cell stained with Rhodamine B; (b–d) influence of fluoride (at the constant concentration of 0.01 mg mL−1) on algae cell stained with Rhodamine B at different time intervals: (b) 10 minutes (c) 15 minutes and (d) 20 minutes.

image file: c5ra24713f-f4.tif
Fig. 4 (a and b) Fluorescence images without chlorophyll-a at high resolution and (c and d) fluorescence images in the presence of damaged chlorophyll-a (c) at low and high (d) resolution.

image file: c5ra24713f-f5.tif
Fig. 5 Confocal images (i) fluorescence appears from chlorophyll-a of pure algae cells; (ii) chlorophyll-a containing algae cells, stained with Rhodamine B and (iii) chlorophyll-a free algae cells, stained with Rhodamine B. Both (ii) and (iii) are comprised 12–14 fluorescence plates ((a–n) and (a–l); 0.3 μm in thickness each). Intensity gradually increases, approaches a maximum at (g/e); then gradually diminishes and reaches a minimum at (n/l).

image file: c5ra24713f-f6.tif
Fig. 6 Luminescent properties of: (a) chlorophyll-a of varying concentrations, (b) chlorophyll-a (5 × 10⁻⁶ M) containing Rhodamine B of varying concentrations, and (c) fixed concentrations of both chlorophyll-a and Rhodamine B (5 × 10⁻⁶ M and 0.5 × 10⁻⁶ M, respectively) containing fluoride of varying concentrations. Excitation wavelength: 330 nm and solvent: DMSO.

image file: c5ra24713f-f7.tif
Fig. 7 (a) Chlorophyll-a and (b) phycocyanobilin 2.

After fluoride sorption, the electronic structure of the adsorbent molecule is disturbed.34,38,56,57 Consequently, nearly all FTIR bands shifted after the sorption of fluoride. However, this major change was accompanied by the appearance of two new peaks at 1725 cm−1 and 2440 cm−1 and another extended broad band, appeared at 3132–3650 cm−1 as well. The strong absorption band (for pure algae) at 3400–3650 cm−1 suffers a shift as a broad band (3132–3650 cm−1)34,38 in the loaded FTIR spectrum (Fig. S3a), thereby confirming the formation of intramolecular H-bonds in the fluoride extracted species (Fig. S3a). This clearly indicates the involvement of the extractor in the fluoride sorption process. To gain insight on the mechanistic path for fluoride sensing through the interaction of the heterocyclic –NH protons of phycocyanobilin 2 by fluoride, a standard DFT calculation was performed. Three fluorides exist as H-bonded species [H-bond length 80.78 pm for N(5)H⋯F(86); H-bond length 90.28 and 64.50 pm for N(9)H⋯F(82)⋯HO(61); and H-bond length 54.43 pm for F(84)⋯HO(49)] in the DFT optimized fluoride loaded complex (Fig. S4). The computed FTIR (Fig. S3b) spectrum of the optimized protein fragment (phycocyanobilin 2), loaded with fluoride shows peaks assigned to –NH stretching in NH⋯F(86) (DFT) at 3191.3 cm−1; the peak at 2447.3 cm−1 (DFT) was for the ν(OH) stretching mode in F(84)⋯HOOC; peaks at 1732.3 cm−1 and 3456 cm−1 (DFT) were for ν(NH) bending and ν(NH) stretching, respectively, in N(9)H⋯F(82) (DFT); and a peak at 1807.8 cm−1 (DFT) for the ν(OH) bending mode in NH⋯F(82)⋯HOOC. This DFT computed FT-IR spectrum rationalizes the experimental FT-IR spectral pattern of the loaded extractor.34,38,58 It confirms the participation of –NH protons in fluoride uptake [Table S1].

All these results, in unison, give a clear verdict that the cellular pigment, phycocyanobilin 2, plays an anchoring role for the formation of a very highly fluorescent sensitive complex (intense red) with Rhodamine B, which subsequently is able to sense fluoride at trace levels via instantaneous glittering (yellow fluorescence).

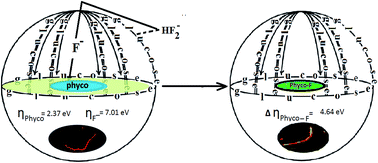
Finally, as a plausible mechanistic path it may be stated that a naturally occurring aqua F-species, [HF2 (assym.): H–F = 49.7 pm, F–F = 197.3 pm, energy = −5398.2 eV and global hardness, η = 15.2 eV], will have a high chance of interaction (through the HSAB pathway39) with the –OH of the living extractant, P. luridum, at its surface through the formation of H-bonds.34 This surface, which is built up of polysaccharides (glucose is the basic unit of polysaccharides: η[glucose] = 6.34 eV), forms a weak complex (Scheme 1(a)) with aqua F-species, [HF2 (assym.); image file: c5ra24713f-t6.tif]. This H-bonded species, [glucose–HF2] leaves behind the more active [F (aq.)] species (η = 7.01 eV), which subsequently moves inside and forms a more stable complex in vivo with phycocyanobilin 2 (Scheme 1(b)), having close/comparable hardness (η[phycocyanobilin 2] = 2.37 eV and Δη[F (aq.)/phycocyanobilin 2] = 4.64 eV).


image file: c5ra24713f-s1.tif
Scheme 1 (a) Assym. HF2 (η: 15.21 eV)–surface glucose (η: 6.34 eV) weak complexation (Δη: 8.87 eV) and (b) F (η: 7.01 eV)–phycocyanobilin 2 (η: 2.37 eV) strong complexation (Δη: 4.64 eV) inside the living cell.

3.3 Preconcentration, separation, recovery and removal of fluoride

Exploiting the weak complexation at the algal surface (Scheme 1(a)), fluoride in real samples may be quantitatively retrieved through selective elution. On the other hand, the more stable complexing ability with phycocyanobilin 2 in vivo supports an efficient fluoride-removal-strategy (Scheme 1(b)) in effluent. Thus, along with detection, fluoride sorption for its preconcentration, separation, recovery and removal was also investigated.
3.3.1 Sorption parameters and isotherm equations. Two isotherms (eqn (3) and (4)) have been investigated to rationalize the sorption behavior of biomass towards fluoride uptake. The relationships show their applicability for both Langmuir (y = 0.16441x + 1.28757; R = 0.9928; SD = 0.062) and Freundlich (y = 0.36227x + 0.17486; R2: 0.9859; SD: 0.08) isotherms (Fig. S5). However, the comparable co-relation coefficient and lower RMSE (0.06) (Table 1) suggests the greater acceptability of the Freundlich isotherm over the Langmuir model. Consequently, it agrees with the formation of a multilayer by the gradual sorption of analyte (Freundlich) on the adsorbent surface. Attachment of the adsorbate on the surface of the sorbent is not only guided by hard–soft binding, but also by physical types of interactions, i.e. the sorption process.59,60 Herein, the adsorbate is adsorbed at the first layer on the surface via chemical binding, which has a high Langmuir energy parameter (b: 0.1277 L mg−1). Maximum sorption (Langmuir Q0: 6.08 mg g−1) is attained at a somewhat reduced level to the column breakthrough capacity (Fig. S6) of 6.76 mg g−1 as is expected and this reiterates the formation of a multilayer by sorption with a high level of Freundlich adsorption capacity (1.49) and adsorption intensity (n = 5.72).
3.3.2 Effect of temperature, pH, volume and flow rate of the influent [fluoride solution, containing common cations/anions as interference] on sorption. Thermodynamic parameters, (ΔH = 0.063 kJ mol−1; ΔG = −1.21 kJ mol−1 and ΔS = 0.06 kJ mol−1) were calculated from standard thermodynamic relationships (eqn (5)–(7)) utilizing the linear regression (y = −3.2763 + 13.0222) for 1000/T vs. log[thin space (1/6-em)]Kd (Fig. S7). Sorption occurs instantaneously (−ΔG) and appreciably and produces a very high level ordered system (low values of +ΔS) through the accumulation of adsorbate on the algal surface. With respect to the effect of pH (2.5–7.5) on the sorption of fluoride on algae, we find that it is quantitative at near neutral pH. Complete retention in the column was found up to a flow rate of 4 mL min−1. Systematic studies on the desorption and reusability of the material show that 5 mL 0.005 M NaNO3 quantitatively elutes the sorbed fluoride. Sorption–desorption was carried out on the same column for 3–4 months and up to 70–90 cycles was found to be quantitative.

During our investigation on break-through capacity (BTC) and preconcentration factor (PF), it was found that the leakage of fluoride (0.02 mg mL−1) started after passing 338 mL (6.76 mg) of analyte solution through the column containing 1 g sorbent (Fig. S6). This gives the maximum uptake capacity (BTC) of 6.76 mg g−1 of biomass. During this continuous extraction, fluoride was accumulated gradually on the column from its influent of lower concentration (0.02 mg mL−1) and after elution, the effluent (5 mL) was found to be rich with fluoride with higher concentrations (0.6422 mg mL−1). Therefore, this method preconcentrates the analyte in the effluent by a factor of 64.2 (95% recovery) on the mg level. Systematic studies on the effect of influent-volume on the sorption of fluoride (10 ppm) indicate that a sample volume of up to 0.4 L does not influence the preconcentration factor image file: c5ra24713f-t7.tif and is optimum at 72 with a recovery of 90%.

In vivo complexation (Scheme 1(b)) was applied in the removal-strategy and the effect of foreign ions (50–100 mM L−1) was found to be low enough in the removal (>93%) of fluoride (Table S2) from its synthetic solution (100 mL). The effectiveness of the proposed method was evaluated by the removal of fluoride in its quantitative range (90%) from real samples (pond, well and tap water) (20 ppm) (Table 2).

Table 2 Removal of fluoride [biomass: 1 g; sample volume: 100 mL; flow-rate: 4 mL mL−1; temperature: 27 °C; and pH of the influent sample: 6.8]
Sample Water samples: 100 mL
Anion Added (ppm) Found (ppm) Removal (%)
Pond water Fluoride 20 1.82 90.9
Well water Fluoride 20 1.28 93.6
Tap water Fluoride 20 1.54 92.3


4. Conclusions

The cellular pigment, phycocyanobilin 2, of living algae plays an anchoring role in the formation of a very highly fluorescent sensitive complex (red) with Rhodamine B, which is subsequently able to sense fluoride at trace levels (0.01 mg L−1) via instantaneous glittering (yellow fluorescence). It is able to detect well below the PHS recommended levels for drinking water (0.7–1.2 ppm), which places this probe among the most sensitive fluoride sensors reported to date.61 Fluoride instantaneously attacks the algal pigment, phycocyanobilin 2, and as a secondary effect, it prevents the transfer of light energy, which slowly affects chlorophyll-a. Algal biomass effectively adsorbs fluoride (Langmuir Q0: 6.08 mg g−1; column BTC: 6.76 mg g−1; adsorption capacity, KF: 1.4958 and adsorption intensity, n: 5.72) and the process was found to be endothermic, and its spontaneity is attributed to the positive change in entropy (ΔH = 0.063 kJ mol−1; ΔS = 0.06 kJ mol−1 and ΔG = −1.21 kJ mol−1).

Acknowledgements

M. Chatterjee, one of the authors, gratefully acknowledges Prof. Samit Roy for the experimental assistance for algal detection (Olympus BX41 epifluorescence trinocular microscope fitted with digital camera, Nikon Coolpix 4500) from the Algal Research Laboratories, Department of Botany, V.B, W.B., India.

References

  1. (a) P. D. Beer and P. A. Gale, Anion Recognition and Sensing: The State of the Art and Future Perspectives, Angew. Chem., Int. Ed., 2001, 40, 486–517 CrossRef CAS; (b) B. Sui, B. Kim, Y. Zhang, A. Frazer and K. D. Belfield, Highly Selective Fluorescence Turn-On Sensor for Fluoride Detection, ACS Appl. Mater. Interfaces, 2013, 5, 2920–2923 CrossRef CAS PubMed and references there in.
  2. Z. Yang, K. Zhang, F. Gong, S. Li, J. Chen, J. S. Ma, L. N. Sobenina, A. I. Mikhaleva, G. Yang and B. A. Trofimov, A new fluorescent chemosensor for fluoride anion based on a pyrrole-isoxazole derivative, J. Org. Chem., 2011, 7, 46–52 CAS.
  3. S. Ayoob and A. K. Gupta, Fluoride in Drinking Water: A Review on the Status and Stress Effects, Crit. Rev. Environ. Sci. Technol., 2006, 36(6), 433–487 CrossRef CAS.
  4. K. Upadhyay, R. K. Mishra, V. Kumar and P. Chowdhury, A coumarin based ICT probe for fluoride in aqueous medium with its real application, Talanta, 2010, 82, 312–318 CrossRef CAS PubMed.
  5. (a) M. Kleerekoper, The role of fluoride in the prevention of osteoporosis, Endocrinol. Metab. Clin. North Am., 1998, 27, 441–452 CrossRef CAS PubMed; (b) B. D. Gessner, M. Beller, J. P. Middaugh and G. M. Whitford, Acute fluoride poisoning from a public water system, N. Engl. J. Med., 1994, 330, 95–99 CrossRef CAS PubMed.
  6. (a) M. Cametti and K. Rissanen, Recognition and sensing of fluoride anion, Chem. Commun., 2009, 2809–2829 RSC; (b) Y. Zhou, J. F. Zhang and J. Yoon, Fluorescence and Colorimetric Chemosensors for Fluoride-Ion Detection, Chem. Rev., 2014, 114, 5511–5571 CrossRef CAS PubMed.
  7. A. K. Masood and J. Sankar, Exclusive fluoride ion recognition and fluorescence “turn-on” response with a label-free DMN Schiff base, Analyst, 2013, 138, 4760–4763 RSC and references there in.
  8. (a) Y. Kubo, T. Ishida, A. Kobayashi and T. D. James, Fluorescent alizarin–phenylboronic acid ensembles: design of self-organized molecular sensors for metal ions and anions, J. Mater. Chem., 2005, 15, 2889–2895 RSC; (b) Y. Kubo, A. Kobayashi, T. Ishida, Y. Misawa and T. D. James, Detection of anions using a fluorescent alizarin–phenylboronic acid ensemble, Chem. Commun., 2005, 2846–2848 RSC; (c) Z. Xu, N. J. Singh, S. K. Kim, D. R. Spring and K. S. Kim, Yoon, Induction-Driven Stabilization of the Anion–π Interaction in Electron-Rich Aromatics as the Key to Fluoride Inclusion in Imidazolium-Cage Receptors, Chem.–Eur. J, 2011, 17, 1163–1170 CrossRef CAS PubMed.
  9. (a) S. Kumar, V. Luxami and A. Kumar, Chromofluorescent Probes for Selective Detection of Fluoride and Acetate Ions, Org. Lett., 2008, 10(24), 5549–5552 CrossRef CAS PubMed; (b) C. H. Zhao, E. Sakuda, A. Wakamiya and S. Yamaguchi, Highly Emissive Diborylphenylene-Containing Bis(phenylethynyl)benzenes: Structure–Photophysical Property Correlations and Fluoride Ion Sensing, Chem.–Eur. J., 2009, 15, 10603–10612 CrossRef CAS PubMed.
  10. (a) T. H. Kimm and T. M. Swager, A Fluorescent Self-Amplifying Wavelength-Responsive Sensory Polymer for Fluoride Ions, Angew. Chem., Int. Ed., 2003, 42, 4803–4806 CrossRef PubMed; (b) S. Y. Kim and J. I. Hong, Chromogenic and Fluorescent Chemodosimeter for Detection of Fluoride in Aqueous Solution, Org. Lett., 2007, 9, 3109–3112 CrossRef CAS PubMed; (c) R. Hu, J. Feng, D. Hu, S. Wang, S. Li, Y. Li and G. Yang, A Rapid Aqueous Fluoride Ion Sensor with Dual Output Modes, Angew. Chem., Int. Ed., 2010, 49, 4915–4918 CrossRef CAS PubMed; (d) P. Sokkalingam and C. H. Lee, Highly Sensitive Fluorescence “Turn-On” Indicator for Fluoride Anion with Remarkable Selectivity in Organic and Aqueous Media, J. Org. Chem., 2011, 76, 3820–3828 CrossRef CAS PubMed; (e) J. Du, M. Hu, J. Fan and X. Peng, Fluorescent chemodosimeters using “mild” chemical events for the detection of small anions and cations in biological and environmental media, Chem. Soc. Rev., 2012, 41, 4511–4535 RSC; (f) Y. Yang, Q. Zhao, W. Feng and F. Li, Luminescent chemodosimeters for bioimaging, Chem. Rev., 2013, 113, 192–270 CrossRef CAS PubMed.
  11. (a) T. W. Hudnall, C. W. Chiu and F. P. Gabbaï, Fluoride ion recognition by chelating and cationic boranes, Acc. Chem. Res., 2009, 42, 388–397 CrossRef CAS PubMed; (b) C. R. Wade, A. E. J. Broomsgrove, S. Aldridge and F. P. Gabbaï, Fluoride Ion Complexation and Sensing Using Organoboron Compounds, Chem. Rev., 2010, 110, 3958–3984 CrossRef CAS PubMed; (c) F. Jäkle, Advances in the synthesis of organoborane polymers for optical, electronic, and sensory applications, Chem. Rev., 2010, 110, 3985–4022 CrossRef PubMed; (d) F. Pammera and F. Jäkle, 3-Vinylborane-functionalized oligothiophenes: isomer-dependent electronic structure and fluorescence enhancement upon anion binding, Chem. Sci., 2012, 3, 2598–2606 RSC; (e) P. C. A. Swamy, S. Mukherjee and P. Thilagar, Dual emissive borane–BODIPY dyads: molecular conformation control over electronic properties and fluorescence response towards fluoride ions, Chem. Commun., 2013, 49, 993–995 RSC; (f) S. K. Sarkar, S. Mukherjee and P. Thilagar, Going beyond Red with a Tri- and Tetracoordinate Boron Conjugate: Intriguing Near-IR Optical Properties and Applications in Anion Sensing, Inorg. Chem., 2014, 53, 2343–2345 CrossRef CAS PubMed.
  12. (a) B. Sui, B. Kim, Y. Zhang, A. Frazer and K. D. Belfield, Highly Selective Fluorescence Turn-On Sensor for Fluoride Detection, ACS Appl. Mater. Interfaces, 2013, 5, 2920–2923 CrossRef CAS PubMed; (b) J. Wang, L. Yang, C. Hou and H. Cao, A new N-imidazolyl-1,8-naphthalimide based fluorescence sensor for fluoride detection, Org. Biomol. Chem., 2012, 10, 6271–6274 RSC; (c) C. Wang, G. Li and Q. Zhang, A novel heteroacene, 2-(2,3,4,5-tetrafluorophenyl)-1H-imidazo[4,5-b]phenazine as a multi-response sensor for F detection, Tetrahedron Lett., 2013, 54, 2633–2636 CrossRef CAS; (d) J. Yoon, S. K. Kim, N. J. Singh and K. S. Kim, Imidazolium receptors for the recognition of anions, Chem. Soc. Rev., 2006, 35, 355–360 RSC; (e) E. J. Jun, Z. Xu and M. Lee, Yoon, A ratiometric fluorescent probe for fluoride ions with a tridentate receptor of boronic acid and imidazolium, Tetrahedron Lett., 2013, 54, 2755–2758 CrossRef CAS.
  13. G. Sivaraman and D. Chellappa, Rhodamine based sensor for naked-eye detection and live cell imaging of fluoride ions, J. Mater. Chem. B, 2013, 1, 5768–5772 RSC.
  14. D. Mohan, R. Sharma, V. K. Singh, P. Steele and C. U. Pittman Jr, Fluoride Removal from Water using Bio-Char, a Green Waste, Low-Cost Adsorbent: Equilibrium Uptake and Sorption Dynamics Modeling, Ind. Eng. Chem. Res., 2012, 51, 900–914 CrossRef CAS.
  15. S. Ayoob, A. K. Gupta and V. T. Bhat, A Conceptual Overview on Sustainable Technologies for the Defluoridation of Drinking Water, Crit. Rev. Environ. Sci. Technol., 2008, 38, 401–470 CrossRef CAS.
  16. A. Bhatnagar, E. Kumar and M. Sillanp€a€a, Fluoride Removal from Water by Adsorption. A Review, Chem. Eng. J., 2011, 171(3), 811–840 CrossRef CAS.
  17. N. Das, P. Pattanaik and R. Das, Defluoridation of Drinking Water Using Activated Titanium Rich Bauxite, J. Colloid Interface Sci., 2005, 292, 1–10 CrossRef CAS PubMed.
  18. X. Fan, D. J. Parker and M. D. Smith, Adsorption Kinetics of Fluoride on Low Cost Materials, Water Res., 2003, 37, 4929–4937 CrossRef CAS PubMed.
  19. C.-L. Yang and R. Dluhy, Electrochemical Generation of Aluminum Sorbent for Fluoride Adsorption, J. Hazard. Mater., 2002, B94, 239–252 CrossRef.
  20. R. L. Ramos, J. Ovalle-Turrubirates and M. A. Sanchez-Castillo, Adsorption of Fluoride from Aqueous Solution on Aluminum-Impregnated Carbon, Carbon, 1999, 37, 609–617 CrossRef CAS.
  21. S. Ghorai and K. K. Pant, Equilibrium, Kinetics and Breakthrough Studies for Adsorption of Fluoride on Activated Alumina, Sep. Purif. Technol., 2005, 42, 265–271 CrossRef CAS.
  22. S. S. Tripathy, J.-L. Bersillon and K. Gopal, Removal of Fluoride from Drinking Water by Adsorption onto Alum-Impregnated Activated Alumina, Sep. Purif. Technol., 2006, 50(3), 310–317 CrossRef CAS.
  23. C.-F. Changa, P.-H. Lin and W. Holl, Aluminum-Type Superparamagnetic Adsorbents: Synthesis and Application on Fluoride Removal, Colloids Surf., A, 2006, 280, 194–202 CrossRef.
  24. I. Abe, S. Iwasaki, T. Tokimoto, N. Kawasaki, T. Nakamura and S. Tanada, Adsorption of Fluoride Ions onto Carbonaceous Materials, J. Colloid Interface Sci., 2004, 275, 35–39 CrossRef CAS PubMed.
  25. Y. Cengelo glu, E. l. Kır and M. Ers€oz, Removal of Fluoride from Aqueous Solution by using Red Mud, Sep. Purif. Technol., 2002, 28, 81–86 CrossRef CAS.
  26. M. S. Onyango, Y. Kojima, O. Aoyi, E. C. Bernardo and H. Matsuda, Adsorption equilibrium Modeling and Solution Chemistry Dependence of Fluoride Removal from Water by Trivalent-Cation-Exchanged Zeolite F-9, J. Colloid Interface Sci., 2004, 279, 341–350 CrossRef CAS PubMed.
  27. S. P. Kamblea, S. Jagtap, N. K. Labhsetwar, D. Thakare, S. Godfrey, S. Devotta and S. S. Rayalu, Defluoridation of Drinking Water using Chitin, Chitosan and Lanthanum-Modified Chitosan, Chem. Eng. J., 2007, 129, 173–180 CrossRef.
  28. W. Ma, F.-Q. Ya and R. W. Mei Han, Characteristics of Equilibrium, Kinetics Studies for Adsorption of Fluoride on Magnetic-Chitosan Particle, J. Hazard. Mater., 2007, 143, 296–302 CrossRef CAS PubMed.
  29. E. J. Reardon and Y. A. Wang, Limestone Reactor for Fluoride Removal from Wastewaters, Environ. Sci. Technol., 2000, 34, 3247–3253 CrossRef CAS.
  30. S. Sinha, K. Pandey, D. Mohan and K. P. Singh, Removal of Fluoride from Aqueous Solutions by Eichhornia crassipes Biomass and Its Carbonized Form, Ind. Eng. Chem. Res., 2003, 42, 6911–6918 CrossRef CAS.
  31. Y. H. Li, S. G. Wang, X. F. Zhang, J. Q. Wei, C. L. Xu, Z. K. Luan and D. H. Wu, Adsorption of Fluoride from Water by Aligned Carbon Nanotubes, Mater. Res., 2003, 38, 469–476 CAS.
  32. R. Leyva-Ramos, J. Rivera-Utrilla, N. A. Medellin-Castillo and M. Sanchez-Polo, Kinetic Modeling of Fluoride Adsorption from Aqueous Solution onto Bone Char, Chem. Eng. J., 2010, 158(3), 458–467 CrossRef CAS.
  33. B. Mandal, C. U. Ghosh and S. Roy, Role of river-derived algae on bioaccumulation in fixed bed reactors; a low-cost safe drinking water plant, Desalin. Water Treat., 2012, 45, 343–350 CrossRef CAS.
  34. B. Mandal, M. Mondal, B. Srivastava, M. K. Barman, C. Ghosh and M. Chatterjee, Chromatographic method for pre-concentration and separation of Zn(II) with microalgae and density functional optimization of the extracted species, RSC Adv., 2015, 5, 31205–31218 RSC.
  35. B. Volesky and Z. R. Holan, Biosorption of heavy metals, Biotechnol. Prog., 1995, 11, 235–250 CrossRef CAS PubMed.
  36. S. V. Mohan, S. V. Ramanaiah, B. Rajkumar and P. N. Sarma, Removal of fluoride from aqueous phase by biosorption onto algal biosorbent Spirogyra sp.-IO2: Sorption mechanism elucidation, J. Hazard. Mater., 2007, 141, 465–474 CrossRef CAS PubMed.
  37. M. Bhatnagar, A. Bhatnagar and S. Jha, Interactive biosorption by micro algal biomass as a tool for fluoride removal, Biotechnol. Lett., 2002, 24, 1079–1081 CrossRef CAS.
  38. P. Ghosh, B. G. Ray, S. K. Mukhopadhyay and P. Banerjee, Recognition of fluoride anion at 10 ppm level inside living cell and from fluorine affected tooth and saliva samples, RSC Adv., 2015, 5, 27387–27392 RSC.
  39. R. G. Pearson, Electronegativity and Hardness: Application to Inorganic Chemistry, Inorg. Chem., 1988, 27, 734–740 CrossRef CAS.
  40. E. Frisc, M. J. Frisch, F. R. Clemente and G. W. Trucks, Gaussian 09, Revision D.01, Gaussian, Inc., Wallingford CT, 2013 Search PubMed.
  41. S. Gupta and S. C. Agrawal, Survival of blue-green and green algae under stress condition, Folia Microbiol., 2006, 51(2), 121–128 CrossRef CAS.
  42. A. Ozer, D. Ozer, G. Dursun and S. Bulak, Cadmium(II) adsorption on Cladophora crispata in batch stirred reactors in series, Waste Manag., 1999, 19, 233–240 CrossRef CAS.
  43. H. T. Chang, E. G. Furuya, Y. Miura and K. E. Noll, Effect of surface functional groups on Freundlich adsorption isotherm, Water Sci. Technol., 2000, 42, 161–166 Search PubMed.
  44. M. Galun, E. Galun, B. Z. Siegel, P. Keller, H. Lehr and S. M. Siegel, Removal of metal ions from aqueous solutions by Pencillium biomass: Kinetic and uptake parameters, Water, Air, Soil Pollut., 1987, 33, 359–371 CrossRef CAS.
  45. N. Friis and P. Myers-Keith, Biosorption of uranium and lead by Streptomyces longwoodensis, Biotechnol. Bioeng., 1986, 28, 21–28 CrossRef CAS PubMed.
  46. B. Mandal, U. S. Roy, D. Datta and N. Ghosh, Combined Cation-Exchange and Extraction Chromatographic Method of Pre-concentration and Concomitant Separation of Cu(II) with High Molecular Mass Liquid Cation Exchanger after its online detection, J. Chromatogr. A, 2011, 1218, 5644–5652 CrossRef CAS PubMed.
  47. (a) A. D. Becke, Density-functional exchange-energy approximation with correct asymptotic behavior, Phys. Rev. A: At., Mol., Opt. Phys., 1988, 38, 3098–3100 CrossRef CAS; (b) A. D. Becke, A new mixing of Hartree–Fock and local density-functional theories, J. Chem. Phys., 1993, 98, 1372–1377 CrossRef CAS; (c) A. D. Becke, Density-functional thermochemistry. III. The role of exact exchange, J. Chem. Phys., 1993, 98, 5648–5652 CrossRef CAS; (d) C. Lee, W. Yang and R. G. Paar, Development of the Colle-Salvetti correlation-energy formula into a functional of the electron density, Phys. Rev. B: Condens. Matter Mater. Phys., 1988, 37, 785–789 CrossRef CAS.
  48. (a) P. J. Hay and W. R. Wadt, Ab initio effective core potentials for molecular calculations. Potentials for K to Au including the outermost core orbitals, J. Chem. Phys., 1985, 82, 299–310 CrossRef CAS; (b) J. Dunning, J. Hay and H. F. Schaefer, Modern Theoretical Chemistry, Plenum, New York, 1976, vol. 3, p. 1 Search PubMed.
  49. W. J. Hehre, L. Radom, P. V. R. Schleyerand and J. A. Pople, Ab Initio Molecular Orbital Theory, Wiley Interscience, New York, 1986 Search PubMed.
  50. A. B. Ross, K. Anastasakis, M. Kubacki and J. M. Jones, Investigation of the pyrolysis behaviour of brown algae before and after pre-treatment using PY-GC/MS and TGA, J. Anal. Appl. Pyrolysis, 2009, 85, 3–10 CrossRef CAS.
  51. K. Anastasakis, A. B. Ross and J. M. Jones, Pyrolysis behaviour of the main carbohydrates of brown macro-algae, Fuel, 2011, 90, 598–607 CrossRef CAS.
  52. L. Zhang, K. Gase, I. T. Baldwin and I. Gális, Enhanced fluorescence imaging in chlorophyll-suppressed tobacco tissues using virus-induced gene silencing of the phytoene desaturase gene, BioTechniques, 2010, 48(2), 125–133 CrossRef CAS PubMed.
  53. R. Micura and K. Grubmayr, Long-wavelength absorbing derivatives of phycocyanobilin: new structural aspects of phytochrome, Bioorg. Med. Chem. Lett., 1994, 4(21), 2517–2522 CrossRef.
  54. W. A. Sidler, Phycobilisome and phycobiliprotein structures, in The Molecular Biology of Cyanobacteria, ed. D. A. Bryant, Kluwer Academic Publishers, Dordrecht, 1994, pp. 139–216 Search PubMed.
  55. Y. Fujita, A. Murakami and K. Aizawa, Short-term and long term adaptation of the photosynthetic apparatus: homeostatic properties of thylakoids, in The Molecular Biology of Cyanobacteria, ed. D. A. Bryant, Kluwer Academic Publishers, Dordrecht, 1994, pp. 677–692 Search PubMed.
  56. B. Srivastava, M. K. Barman, M. Chatterjee and B. Mandal, EBT anchored SiO2 3-D microarray: a simultaneous entrapper of two different metal centers at high and low oxidation states using its highest occupied and lowest unoccupied molecular orbital, respectively, RSC Adv., 2015, 5, 55686–55703 RSC.
  57. M. K. Barman, M. Chatterjee, B. Srivastava and B. Mandal, Characterization and Density Functional Theory Optimization of a Simultaneous Binder (FSG-XO) of Two Different Species Exploiting HOMO–LUMO Levels: Photoelectronic and Analytical Applications, J. Chem. Eng. Data, 2015, 60(8), 2197–2208 CrossRef CAS.
  58. J. A. Camargo, Fluoride Toxicity to Aquatic Organisms: A Review, Chemosphere, 2003, 50(3), 251–264 CrossRef PubMed.
  59. O. S. Okay, P. Donkin, L. D. Peters and D. R. Livingstone, The role of algae (Isochrysis galbana) enrichment on the bioaccumulation of benzo[a]pyrene and its effects on the blue mussel Mytilus edulis, Environ. Pollut., 2000, 110(1), 103–113 CrossRef CAS PubMed.
  60. H. Okabayashi, I. Shimizu, E. Nishio and C. J. O'Connor, Diffuse reflectance infrared Fourier transform spectral study of the interaction of 3-aminopropyltriethoxysilane on silica gel. Behavior of amino groups on the surface, Colloid Polym. Sci., 1997, 275, 744–753 CAS.
  61. X. Zhou, R. Lai, H. Li and C. I. Stains, The 8-Silyloxyquinoline Scaffold as a Versatile Platform for the Sensitive Detection of Aqueous Fluoride, Anal. Chem., 2015, 87, 4081–4086 CrossRef CAS PubMed.

Footnote

Electronic supplementary information (ESI) available. See DOI: 10.1039/c5ra24713f

This journal is © The Royal Society of Chemistry 2016