New understanding on the reaction pathways of the polyacrylonitrile copolymer fiber pre-oxidation: online tracking by two-dimensional correlation FTIR spectroscopy†
Jing Zhao,
Jihai Zhang,
Tao Zhou*,
Xifei Liu,
Qiang Yuan and
Aiming Zhang
State Key Laboratory of Polymer Materials Engineering of China, Polymer Research Institute, Sichuan University, Chengdu 610065, China. E-mail: zhoutaopoly@scu.edu.cn; Fax: +86-28-85402465; Tel: +86-28-85402601
First published on 22nd December 2015
Abstract
Polyacrylonitrile (PAN) copolymer fiber pre-oxidation has important influence on the final properties of carbon fibers. Understanding and tracking the reaction pathways of this pre-oxidation has great significance in guaranteeing the quality of the resulting carbon fibers. In this study, in situ FTIR spectroscopy in combination with scaling moving-window two-dimensional correlation spectroscopy (scaling-MW2D) and 2D correlation analysis was used to study the reaction pathways. In addition, DSC and 13C solid-state NMR were used to assist in the determination and verification of chemical structures. Scaling-MW2D revealed that pre-oxidation consists of an initial process (A, 69–223 °C) and a main process (B, 223–309 °C). From the sequential order of 2D correlation analysis, more detailed pathways were obtained. The induced reaction of comonomer units took place in process A (69–223 °C). In process B (223–309 °C), the initial cyclic structures were first generated from the induced structure formed in process A. Then, these initial cyclic structures underwent a series of oxidations and subsequent isomerization. Subsequently, a large number of AN units were immediately involved in the main cyclization reaction, and some β-amino nitriles were produced. One new understanding obtained is that the initial cyclic structures after oxidation and isomerization are the real induced “nucleus” of the main cyclization reaction, and therefore oxygen in the air plays a key role in the main cyclization of PAN. The final step is the dehydrogenation reaction on the polycyclic structures at a high temperature.
1. Introduction
Carbon fibers are excellent materials with ultrahigh mechanical strength, superior corrosion-resistance, lightweight, and they have been widely applied in the automotive and civilian industries, sports apparatus, and especially in the field of aerospace.1–3 It's worth mentioning that the polyacrylonitrile (PAN) precursor fiber is one of the most popular raw materials for the production of high performance carbon fibers.4–8 Generally speaking, the main manufacturing process of PAN-based carbon fibers involves pre-oxidation and carbonization, in which pre-oxidation is a complex and time-consuming process. The typical pre-oxidation procedure of PAN precursor fibers is calcination at 200–300 °C in a tube furnace for 1–2 h.8–10 The pre-oxidation process has important influence on the final properties of carbon fibers. Therefore, understanding and tracking the pre-oxidation reaction pathways has great significance in guaranteeing the quality of the resulting carbon fibers and improving production efficiency.Many researchers11,12 found that a series of chemical reactions occur during the pre-oxidation process of PAN, which primarily include cyclization, dehydrogenation, and oxidation. It was verified that the quality of pre-oxidation strongly depends on the experimental conditions such as the atmosphere, time, temperature, and oxygen diffusion. To date, the pre-oxidation mechanism of PAN has been intensely investigated using various methods such as solid-state nuclear magnetic resonance (ssNMR),1,10,13,14 Fourier transform infrared spectroscopy (FTIR),10,13,15–17 elemental analysis,18 thermal analysis,19 and X-ray diffraction.19 According to the literature, Ngoc Uyen et al.15 investigated the structural evolution of poly(acrylonitrile-co-itaconic acid) (PAI) by FTIR during pre-oxidation, and determined the optimal structural characteristics of the precursors for carbon fibers. Liu et al.5 systematically studied the thermo-chemical reactions and structural conversions of electrospun PAN precursor nanofibers during pre-oxidation. It was revealed that the PAN copolymer predominantly participates in inter-molecular cyclization or crosslinking. They also compared the electrospun PAN nanofibers with the conventional precursor fibers (SAF 3 K) produced by wet spinning. Wang et al.1 analyzed the composition and structure of the residues after the thermal treatment of 13C-labeled PAN samples in an argon atmosphere via one and two-dimensional solid-state 13C nuclear magnetic resonance (ssNMR) experiments. Very recently, Liu et al. systematically investigated different 13C-labeled a-PAN stabilized reaction pathways and structures under nitrogen and air atmosphere using several ss-NMR techniques.19 Despite decades of research, however, the proposed reaction pathway (or mechanism) of this process is still a mystery.1,11,20 Moreover, most of the current investigations based on pre-oxidized PAN fibers are non-online, and strongly depend on environmental factors.21–23 Therefore, the precise online tracking of the reaction pathways of the pre-oxidation process of PAN fibers is urgent and of great importance. Herein, we propose an online approach to track this process using two-dimensional (2D) correlation FTIR spectroscopy.
Generalized two-dimensional (2D) correlation infrared spectroscopy was originally proposed by Noda in 1993.24 This technique is one of the best methods to study polymer transition mechanisms, which can be easily used to track chemical structure information by the sequential order of spectral variables. In 2000, to identify the transition temperature of a thermotropic liquid-crystal sample, the theory of moving-window two-dimensional correlation spectroscopy (MW2D) was reported by Thomas and Richardson.25 Subsequently, a similar technique based on MW2D was proposed by Morita in 2006 called perturbation–correlation moving-window two-dimensional correlation spectroscopy (PCMW2D).26 One of its biggest advantages is that MW2D can be directly used to determine the spectral correlation variation along both perturbation variables (e.g., temperature) and spectral variables (e.g., wavenumber) axes.26–30 Recently, we proposed scaling moving-window two-dimensional correlation spectroscopy (scaling-MW2D), which was specially designed to identify the weak transitions of polymers.31 The reason for establishing scaling-MW2D is that the conventional MW2D has difficulty in distinguishing weak transitions due to its low resolving capacity along the perturbation variable axis (e.g., temperature).31 2D correlation infrared spectroscopy has an inherent advantage in the study of polymer transitions. In recent years, the combination of 2D correlation infrared spectroscopy with moving-widow and generalized 2D correlation analysis has been widely applied to investigate the glass transition, reaction mechanism, crystallization temperature, and other phase-transitions of polymers, which was proven to be very convenient and successful.32–36 Thus, 2D correlation FTIR spectroscopy is also suitable for PAN fibers to online monitor the pre-oxidation process, as well as to study their reaction pathways.
In the present study, in situ FTIR spectroscopy in combination with scaling-MW2D and 2D correlation analysis were employed to investigate the reaction mechanism of the pre-oxidation process. Scaling-MW2D revealed that the pre-oxidation reaction of PAN copolymer fibers has two processes, called process A (69–223 °C) and process B (223–309 °C). Moreover, an accurate and systematic reaction route was obtained. Furthermore, differential scanning calorimetry (DSC) was also used to assist in the determination of the temperature region and solid-state 13C NMR analysis was applied to verify the molecular structure of the pre-oxidized PAN fibers.
2. Experimental
2.1. Materials
Polyacrylonitrile (PAN) copolymer fibers (methyl acrylate as the co-monomer with 1.0 mol% and the average diameter of 5 μm), which were prepared via dry-wet spinning, were provided by Zhejiang Zhongcheng Packing Material Co., Ltd. Their weight average molecular weight (Mw) was 1.34 × 10⁶ g mol−1 as measured by gel permeation chromatography (GPC). The GPC results of the PAN copolymer fibers are listed in Table S1 in the ESI.† PAN samples were used as received without any further treatment.2.2. Differential scanning calorimetry (DSC)
DSC measurement was performed on a NETZSCH 204 F1 with 8 mg of PAN fibers sample in air atmosphere (25 mL min−1). The sample was heated from 50 °C to 320 °C at 5 °C min−1.2.3. Thermal gravimetric analysis (TGA)
Thermogravimetric behavior was measured using a NETZSCHTG 209F1 thermal gravimetric analyzer at a heating rate of 5 °C min−1 in the range of 40–600 °C in air atmosphere (25 mL min−1). The sample weight of the PAN fibers was 5 mg.2.4. In situ FTIR spectroscopy
The PAN fibers were first converted into powder form, and then approximately 5 mg of this powder was ground with 300 mg KBr until the fiber powder was uniformly dispersed. After the powder was desiccated, the mixed powder was pressed into a disk with a diameter of 1.3 cm and thickness of 0.8 mm. Temperature-dependent FTIR spectra between 60 °C and 320 °C were recorded on a Nicolet iS50 Fourier transform spectrometer, which was equipped with a deuterated triglycine sulfate (DTGS) detector. The FTIR spectra of the sample were recorded within the region of 4000–400 cm−1 at a resolution of 4 cm−1 with 32 scans. The temperature-dependent FTIR experiment was conducted in air atmosphere at a heating rate of 5 °C min−1. A total of 122 FTIR spectra were gathered from 60 °C to 320 °C at approximately 2 °C increments.2.5. 2D correlation analysis
The generalized 2D correlation FTIR spectra, MW2D, and scaling-MW2D were processed, calculated, and plotted using the 2DCS software, which was developed by one of the authors. The window size of MW2D and scaling-MW2D was chosen as 11 (2m + 1) to produce high-quality spectra. Linear baseline corrections were applied in the region of 3470–2750 cm−1, 2400–2100 cm−1, and 1780–840 cm−1 before the calculations. The 5% correlation spectra intensity was regarded as noise and was cut off. In the 2D correlation FTIR spectra, the red areas represent the positive correlation intensity, and the blue areas represent the negative correlation intensity. The theory and algorithm of MW2D and generalized 2D correlation spectroscopy can be referenced from the literature.24,25 A brief summarization of the theory of scaling-MW2D based on auto-correlation is described in the ESI.† The detailed algorithm of scaling-MW2D can also be referred to in ref. 31.2.6. Solid-state 13C NMR and 1H NMR
Pre-oxidized PAN copolymer fibers were prepared using an SK-G10123K furnace (Tianjin Central laboratory furnace Ltd.). The PAN fibers were kept straight and heated to programed temperature between 60 °C and 320 °C at 5 °C min−1 with the air flow rate of 1.5 L h−1. Subsequently, both the raw PAN fibers and pre-oxidized PAN fibers were converted into powder form. 13C solid-state NMR (13C ssNMR) spectra of the powders of PAN fibers and pre-oxidized PAN fibers were obtained using a Bruker Avance Ultrashield 500 Plus NMR spectrometer. The 1H and 13C carrier frequencies were 500.1 and 125.8 MHz, respectively. In this study, the parameters of the 13C ssNMR measurements were chosen from the report by Liu et al.19 The as-prepared samples were packed in a 4 mm Zirconia MAS rotor with a Kek-F drive cap and were investigated with a MAS speed of 13 kHz at 25 °C. The CH signal was set as 29.46 ppm as an external reference. In the 13C CP/MAS experiments, the 13C 90° pulse length, CP contact time, and recycle delay were set as 2.5 μs, 5 ms, and 2 s, respectively. 1H NMR of the PAN copolymer fibers was also measured using a Bruker Avance 600 MHz NMR spectrometer, and deuterated dimethyl sulfoxide (DMSO-d6) was used as the solvent. The 1H NMR spectrum of the PAN fibers is shown in Fig. S1 in the ESI.†3. Results and discussion
3.1. Structure evolution of PAN copolymer fibers upon heating
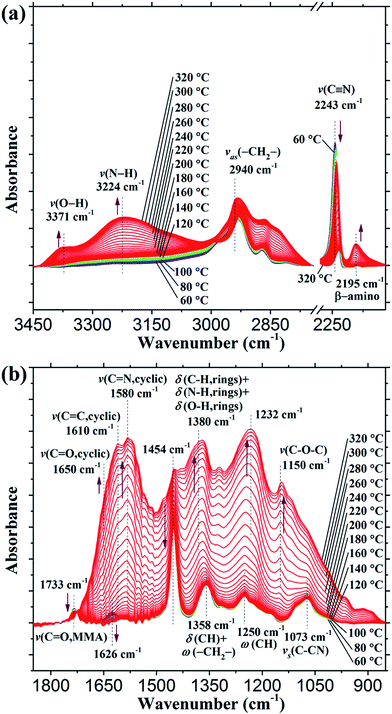
The in situ FTIR spectra of PAN copolymer fibers upon heating from 60 °C to 320 °C in the region of 3450–2740 cm−1, 2280–2120 cm−1, and 1850–850 cm−1 are shown in Fig. 1. According to the literature, the band assignments in this study are summarized in Table S2 in the ESI.† The peak at 1733 cm−1 is assigned to the C![[double bond, length as m-dash]](https://www.rsc.org/images/entities/char_e001.gif) O stretching of methyl methacrylate (MMA).8,15 It can be observed that the intensity of this peak is reduced with the increase in temperature. This indicates the disappearance of the MMA repeating units during the pre-oxidation process. Commonly, the most representative spectral region for PAN fibers is 2280–2120 cm−1, because the peak at 2243 cm−1 is assigned to C
O stretching of methyl methacrylate (MMA).8,15 It can be observed that the intensity of this peak is reduced with the increase in temperature. This indicates the disappearance of the MMA repeating units during the pre-oxidation process. Commonly, the most representative spectral region for PAN fibers is 2280–2120 cm−1, because the peak at 2243 cm−1 is assigned to C![[triple bond, length as m-dash]](https://www.rsc.org/images/entities/char_e002.gif) N stretching.10,13,15,17 As the temperature increases from 60 °C to 320 °C, the band intensity of the nitrile grouping (2243 cm−1) rapidly decreases, and slightly shifts to a lower wavenumber (about 10 cm−1). The decrease in intensity for this band certainly reveals the disappearance of ordinary C
N stretching.10,13,15,17 As the temperature increases from 60 °C to 320 °C, the band intensity of the nitrile grouping (2243 cm−1) rapidly decreases, and slightly shifts to a lower wavenumber (about 10 cm−1). The decrease in intensity for this band certainly reveals the disappearance of ordinary C![[triple bond, length as m-dash]](https://www.rsc.org/images/entities/char_e002.gif) N groups during the pre-oxidation, and the phenomenon of moving to a lower wavenumber was reported to be due to the electron resonance of the nitrile grouping with other groups in the molecular chains.37 It is noted that the peak at around 2243 cm−1 does not completely disappear at 320 °C, which indicates that not all the nitrile groups in PAN fibers can be converted into a ladder-like polymer structure during the pre-oxidation process. Residual isolated nitrile still exists in the molecular chains after the pre-oxidation. In addition, a new peak is observed at around 2195 cm−1, which was also reported by Satish et al.38 They deconvolved the overlapping bands within the 2250–2150 cm−1 region using multi-peak fitting, and two peaks at 2190 cm−1 and 2210 cm−1 were successfully fitted, which are assigned to the C
N groups during the pre-oxidation, and the phenomenon of moving to a lower wavenumber was reported to be due to the electron resonance of the nitrile grouping with other groups in the molecular chains.37 It is noted that the peak at around 2243 cm−1 does not completely disappear at 320 °C, which indicates that not all the nitrile groups in PAN fibers can be converted into a ladder-like polymer structure during the pre-oxidation process. Residual isolated nitrile still exists in the molecular chains after the pre-oxidation. In addition, a new peak is observed at around 2195 cm−1, which was also reported by Satish et al.38 They deconvolved the overlapping bands within the 2250–2150 cm−1 region using multi-peak fitting, and two peaks at 2190 cm−1 and 2210 cm−1 were successfully fitted, which are assigned to the C![[triple bond, length as m-dash]](https://www.rsc.org/images/entities/char_e002.gif) N stretching of the C
N stretching of the C![[triple bond, length as m-dash]](https://www.rsc.org/images/entities/char_e002.gif) N groups in β-amino nitrile and conjugated nitrile,38,39 respectively. The appearance of a peak at 2195 cm−1 reveals the transformation from ordinary C
N groups in β-amino nitrile and conjugated nitrile,38,39 respectively. The appearance of a peak at 2195 cm−1 reveals the transformation from ordinary C![[triple bond, length as m-dash]](https://www.rsc.org/images/entities/char_e002.gif) N groups to β-amino nitrile during the pre-oxidation.
N groups to β-amino nitrile during the pre-oxidation.
 | ||
| Fig. 1 In situ FTIR spectra of the pre-oxidation of PAN copolymer fibers from 60 °C to 320 °C: (a) 3450–2740 cm−1 and 2280–2120 cm−1; and (b) 1850–850 cm−1. | ||
At the same time, it is also observed that the intensities of the peaks at 3371 cm−1 and 3224 cm−1, which are assigned to the O–H stretching of the O–H groups and N–H stretching of the N–H groups, obviously increase from 60 °C to 320 °C,15,40,41 and this indicates the generation of O–H and N–H groups. As shown in Fig. 1(b), most of the peaks in the region of 1850–850 cm−1 suddenly and rapidly widen and heighten with the increase in temperature. Special attention has to be paid to the new bands generated at 1610 cm−1, 1580 cm−1, and 1380 cm−1. The bands at 1610 cm−1 and 1580 cm−1 are attributed to C![[double bond, length as m-dash]](https://www.rsc.org/images/entities/char_e001.gif) C and C
C and C![[double bond, length as m-dash]](https://www.rsc.org/images/entities/char_e001.gif) N stretching, respectively, in the cyclic structure,42,43 and that at 1380 cm−1 is an overlapped band consisting of C–H, N–H, and O–H bending in the rings.15,43 This fully shows that a large number of cyclic structures are generated during pre-oxidation. In addition, the formation of acridone and the C–O–C structure is also detected, because the intensity of the band at 1650 cm−1, which is assigned to the C
N stretching, respectively, in the cyclic structure,42,43 and that at 1380 cm−1 is an overlapped band consisting of C–H, N–H, and O–H bending in the rings.15,43 This fully shows that a large number of cyclic structures are generated during pre-oxidation. In addition, the formation of acridone and the C–O–C structure is also detected, because the intensity of the band at 1650 cm−1, which is assigned to the C![[double bond, length as m-dash]](https://www.rsc.org/images/entities/char_e001.gif) O stretching of carbonyl groups in acridone,42,43 and that of the band at 1150 cm−1, which is assigned to the C–O–C stretching,15,44 both increase rapidly during pre-oxidation. It is noted that the intensity of the band at around 2940 cm−1 rapidly decreases when the temperature is near 320 °C. The peak at around 2940 cm−1 is assigned to the C–H asymmetrical stretching of the –CH2– groups in the PAN backbone, and therefore the reduction of this peak probably reveals the occurrence of dehydrogenation reactions at high temperatures.
O stretching of carbonyl groups in acridone,42,43 and that of the band at 1150 cm−1, which is assigned to the C–O–C stretching,15,44 both increase rapidly during pre-oxidation. It is noted that the intensity of the band at around 2940 cm−1 rapidly decreases when the temperature is near 320 °C. The peak at around 2940 cm−1 is assigned to the C–H asymmetrical stretching of the –CH2– groups in the PAN backbone, and therefore the reduction of this peak probably reveals the occurrence of dehydrogenation reactions at high temperatures.
3.2. 13C ssNMR
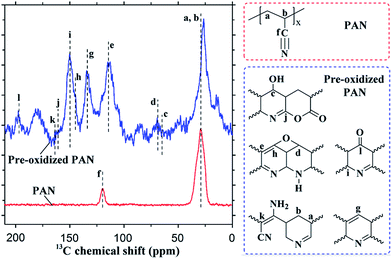
To further reveal the final chemical structure of the pre-oxidized PAN copolymer fibers, typical solid-state 13C NMR spectra of raw PAN copolymer fibers and pre-oxidized PAN copolymer were obtained, which are shown in Fig. 2 and the corresponding chemical structures are summarized in Table 1. The chemical shift at 119.6 ppm (f) is attributed to the C![[triple bond, length as m-dash]](https://www.rsc.org/images/entities/char_e002.gif) N groups, and an obvious reduction of the peak at 119.6 ppm confirms that most of the PAN fibers are involved in the pre-oxidation process.19
N groups, and an obvious reduction of the peak at 119.6 ppm confirms that most of the PAN fibers are involved in the pre-oxidation process.19
 | ||
| Fig. 2 Solid-state 13C NMR spectra of PAN copolymer fibers (red curve) and pre-oxidized copolymer PAN fibers (blue curve). | ||
| 13C chemical shifts (ppm) | Assignments | References | |
|---|---|---|---|
| a | 28.4 | –CH– | 1, 10, 20 and 22 |
| b | 28.4 | –CH2– | 1, 10, 20 and 22 |
| c | 69.7 | –C–OH | 1, 20 and 22 |
| d | 72.6 | C–O–C | 45 and 46 |
| e | 112.8 | –C![[double bond, length as m-dash]](https://www.rsc.org/images/entities/char_e001.gif) C– C– |
13 and 22 |
| f | 119.6 | –C![[triple bond, length as m-dash]](https://www.rsc.org/images/entities/char_e002.gif) N N |
1, 10, 13 and 22 |
| g | 134.3 | –C![[double bond, length as m-dash]](https://www.rsc.org/images/entities/char_e001.gif) C–H C–H |
13 and 22 |
| h | 145.6 | –C![[double bond, length as m-dash]](https://www.rsc.org/images/entities/char_e001.gif) C–O C–O |
47 |
| i | 150.2 | –C![[double bond, length as m-dash]](https://www.rsc.org/images/entities/char_e001.gif) N– N– |
1 and 20 |
| j | 162.4 | O–C![[double bond, length as m-dash]](https://www.rsc.org/images/entities/char_e001.gif) N– N– |
1 and 20 |
| k | 164.0 | C![[double bond, length as m-dash]](https://www.rsc.org/images/entities/char_e001.gif) C–NH2 C–NH2 |
39 |
| l | 196.4 | –C![[double bond, length as m-dash]](https://www.rsc.org/images/entities/char_e001.gif) O O |
20 |
Compared with the raw PAN fiber, a series of new peaks appear in the 13C ssNMR spectra of the pre-oxidized PAN fibers. In particular, the appearance of peaks at 112.8 ppm (e), 134.3 ppm (g), 150.2 ppm (i), 145.6 ppm (h), 72.6 ppm (d), 196.4 ppm (l), 164.0 ppm (k), and 69.7 ppm (c) is observed. The chemical shifts at 112.8 ppm (e) and 134.3 ppm (g) are attributed to the carbon atoms in the –C![[double bond, length as m-dash]](https://www.rsc.org/images/entities/char_e001.gif) C– and –C
C– and –C![[double bond, length as m-dash]](https://www.rsc.org/images/entities/char_e001.gif) C–H structures, and the peak at 150.2 ppm (i) is assigned to the –C
C–H structures, and the peak at 150.2 ppm (i) is assigned to the –C![[double bond, length as m-dash]](https://www.rsc.org/images/entities/char_e001.gif) N– structure. The appearance of peaks at 112.8 ppm (e), 134.3 ppm (g), and 150.2 ppm (i) reveals the occurrence of cyclization and dehydrogenation reactions, which are also detected in the in situ FTIR spectra in Fig. 1. The chemical shift at 196.4 ppm (l) is attributed to –C
N– structure. The appearance of peaks at 112.8 ppm (e), 134.3 ppm (g), and 150.2 ppm (i) reveals the occurrence of cyclization and dehydrogenation reactions, which are also detected in the in situ FTIR spectra in Fig. 1. The chemical shift at 196.4 ppm (l) is attributed to –C![[double bond, length as m-dash]](https://www.rsc.org/images/entities/char_e001.gif) O from the pre-oxidation products, while the peaks at 145.6 ppm (h) and 72.6 ppm (d) are both attributed to C–O–C groups. Moreover, the chemical shifts at 164.0 ppm (k) and 69.7 ppm (c) are assigned to C
O from the pre-oxidation products, while the peaks at 145.6 ppm (h) and 72.6 ppm (d) are both attributed to C–O–C groups. Moreover, the chemical shifts at 164.0 ppm (k) and 69.7 ppm (c) are assigned to C![[double bond, length as m-dash]](https://www.rsc.org/images/entities/char_e001.gif) C–NH2 and –C–OH in the cyclic structures, respectively. Combined with the results of in situ FTIR and 13C ssNMR, the final chemical structure of the pre-oxidized PAN fibers can be clearly determined, as shown in Fig. 2. It also can be concluded that the pre-oxidation of PAN copolymer fibers primarily consist of cyclization, dehydrogenation, and oxidation reactions. However, the specific reaction pathways based upon these results are still unclear. Therefore, the powerful 2D correlation FTIR spectroscopy is necessary to determine the reaction mechanism of the pre-oxidation of PAN copolymer fibers.
C–NH2 and –C–OH in the cyclic structures, respectively. Combined with the results of in situ FTIR and 13C ssNMR, the final chemical structure of the pre-oxidized PAN fibers can be clearly determined, as shown in Fig. 2. It also can be concluded that the pre-oxidation of PAN copolymer fibers primarily consist of cyclization, dehydrogenation, and oxidation reactions. However, the specific reaction pathways based upon these results are still unclear. Therefore, the powerful 2D correlation FTIR spectroscopy is necessary to determine the reaction mechanism of the pre-oxidation of PAN copolymer fibers.
3.3. DSC measurement
The DSC curve of the PAN fibers from 50 °C to 320 °C upon heating in air atmosphere was measured and illustrated in Fig. 3. An exothermic peak at 295 °C is observed, and the temperature range of this peak is within 225–314 °C, which is consistent with the range determined by TGA measurement (Fig. S2 in the ESI†). This indicates that the pre-oxidation reaction of PAN fibers begins at 225 °C and ends at 314 °C, and this reaction reaches the maximum reaction rate at 295 °C. It is noted that no other peaks are observed when the temperature is below 225 °C.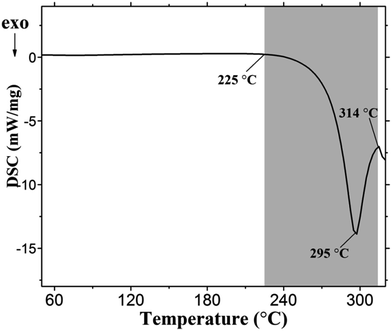 | ||
| Fig. 3 DSC curve of PAN copolymer fibers from 50 °C to 320 °C upon heating at 5 °C min−1 in air atmosphere. | ||
3.4. Two processes of pre-oxidation determined by scaling-MW2D FTIR
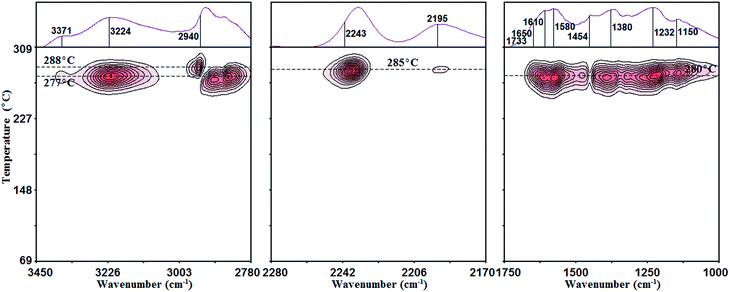
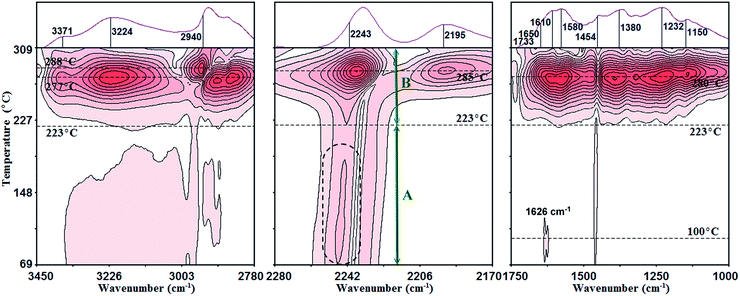
Fig. 4 shows the conventional MW2D FTIR spectra of the pre-oxidation of PAN copolymer fibers is in the region of 3450–2780 cm−1, 2280–2170 cm−1 and 1750–1000 cm−1, which are calculated from the in situ FTIR spectra from 60 °C to 320 °C. A strong transition within the range of 277–288 °C is observed. This temperature range just falls into the temperature region of the pre-oxidation reaction determined by DSC (225–314 °C). Thus, the transition within the range of 277–288 °C observed in the conventional MW2D also reveals the pre-oxidation reaction. In particular, the temperature points at 277 °C, 280 °C, 285 °C, and 288 °C indicate a series of reactions during the PAN fibers pre-oxidation, which include cyclization, dehydrogenation, and oxidation reactions. As mentioned in the Introduction, the conventional MW2D has difficulty in detecting the weak transitions of polymers. Thus, if we neglect the other transitions, which cannot be detected by DSC or conventional MW2D, the wrong conclusion about the reaction pathways will probably be reported, which will be misleading.We want to determine whether there are other transitions during the PAN fibers pre-oxidation. Thus, auto-correlation scaling-MW2D was employed in our study. The scaling-MW2D FTIR spectra of the pre-oxidation of PAN copolymer fibers in the region of 3450–2780 cm−1, 2280–2170 cm−1 and 1750–1000 cm−1 are shown in Fig. 5. As expected, using the scaling-MW2D FTIR spectra, not only the strong transition within 277–288 °C, but also other weak transitions are detected when the temperature is below 223 °C. In particular, a weak correlation peak of 1626 cm−1 at 100 °C is observed, and a correlation peak of 2243 cm−1 within 70–195 °C is detected. The band at 1626 cm−1 is attributed to the O–H bending of absorbed water in the PAN fibers,48 and that at 100 °C is exactly the boiling point of water. Thus, this weak transition is certainly the dehydration of the PAN fibers. The band at 2243 cm−1 is assigned to C![[triple bond, length as m-dash]](https://www.rsc.org/images/entities/char_e002.gif) N stretching.10,13,15,17 The weak transition of C
N stretching.10,13,15,17 The weak transition of C![[triple bond, length as m-dash]](https://www.rsc.org/images/entities/char_e002.gif) N groups within 70–195 °C indicates some weak chemical reactions between C
N groups within 70–195 °C indicates some weak chemical reactions between C![[triple bond, length as m-dash]](https://www.rsc.org/images/entities/char_e002.gif) N groups and other functional groups. In our FTIR experiment, it can also be observed that the spectral intensity of the peak at 2243 cm−1 slowly decreases (not displayed here) with the temperature increase from 69 °C to 223 °C, which also shows the reactions of the C
N groups and other functional groups. In our FTIR experiment, it can also be observed that the spectral intensity of the peak at 2243 cm−1 slowly decreases (not displayed here) with the temperature increase from 69 °C to 223 °C, which also shows the reactions of the C![[triple bond, length as m-dash]](https://www.rsc.org/images/entities/char_e002.gif) N groups.
N groups.
From the scaling-MW2D FTIR spectra, two processes of the PAN fibers pre-oxidation are preliminary determined. Herein, as shown in Fig. 5, the temperature point of 223 °C is used as the dividing line between the two processes. This is because 223 °C is obviously the onset point of the strong transition, judging from the correlation intensity peaks in Fig. 5. In addition, the temperature of 223 °C is very close to the onset point of 225 °C determined from DSC. As labeled in Fig. 5, these two processes are named as A and B, and their temperature regions are 69–223 °C and 223–309 °C, respectively. According to the strength of the correlation peaks, combined with the DSC curve, it can be inferred that process B (223–309 °C) is the main process of the PAN fibers pre-oxidation, and process A (69–223 °C) is the initial process. The cyclization, dehydrogenation, and oxidation of the PAN fibers mainly take place in process B due to the appearance of strong correlation peaks at 1650 cm−1 (C![[double bond, length as m-dash]](https://www.rsc.org/images/entities/char_e001.gif) O, cyclic), 1610 cm−1 (C
O, cyclic), 1610 cm−1 (C![[double bond, length as m-dash]](https://www.rsc.org/images/entities/char_e001.gif) C, cyclic), 1580 cm−1 (C
C, cyclic), 1580 cm−1 (C![[double bond, length as m-dash]](https://www.rsc.org/images/entities/char_e001.gif) N, cyclic), and 2195 cm−1 (C
N, cyclic), and 2195 cm−1 (C![[triple bond, length as m-dash]](https://www.rsc.org/images/entities/char_e002.gif) N, β-amino). Process B is an exothermic reaction, which can also be easily detected by DSC. Process A is composed of the dehydration of PAN fibers and some weak reactions of the C
N, β-amino). Process B is an exothermic reaction, which can also be easily detected by DSC. Process A is composed of the dehydration of PAN fibers and some weak reactions of the C![[triple bond, length as m-dash]](https://www.rsc.org/images/entities/char_e002.gif) N groups. The exothermic and endothermic values of these two sub-processes are probably both very weak, and therefore cannot be detected using DSC. Because the formation of the cyclic structures (1650 cm−1, 1610 cm−1, and 1580 cm−1) and β-amino nitrile (2195 cm−1) are not observed in process B, we think that the weak reactions of the C
N groups. The exothermic and endothermic values of these two sub-processes are probably both very weak, and therefore cannot be detected using DSC. Because the formation of the cyclic structures (1650 cm−1, 1610 cm−1, and 1580 cm−1) and β-amino nitrile (2195 cm−1) are not observed in process B, we think that the weak reactions of the C![[triple bond, length as m-dash]](https://www.rsc.org/images/entities/char_e002.gif) N groups in process B is probably the induced reaction before the ring formation. According to the literature, it is generally accepted that comonomer units (e.g., MMA) can significantly reduce the difficulty of the PAN ring formation reaction due to induction. Thus, it can be inferred that this induced reaction is probably between acrylonitrile (AN) monomer units and MMA. However, in scaling-MW2D, there is no evidence to support our inference about this induced reaction. To solve this problem, the generalized 2D correlation FTIR analysis for processes A and B is necessary.
N groups in process B is probably the induced reaction before the ring formation. According to the literature, it is generally accepted that comonomer units (e.g., MMA) can significantly reduce the difficulty of the PAN ring formation reaction due to induction. Thus, it can be inferred that this induced reaction is probably between acrylonitrile (AN) monomer units and MMA. However, in scaling-MW2D, there is no evidence to support our inference about this induced reaction. To solve this problem, the generalized 2D correlation FTIR analysis for processes A and B is necessary.
3.5. Generalized 2D correlation FTIR analysis
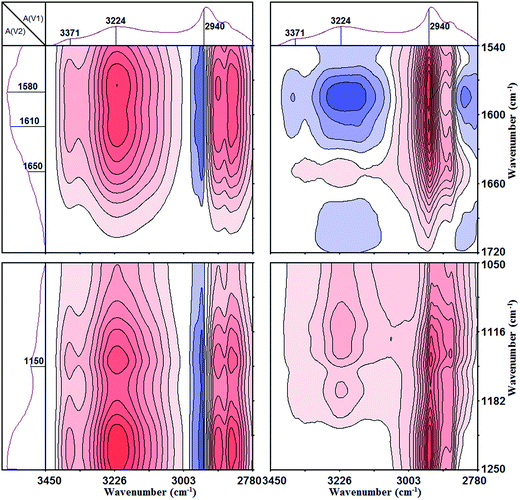
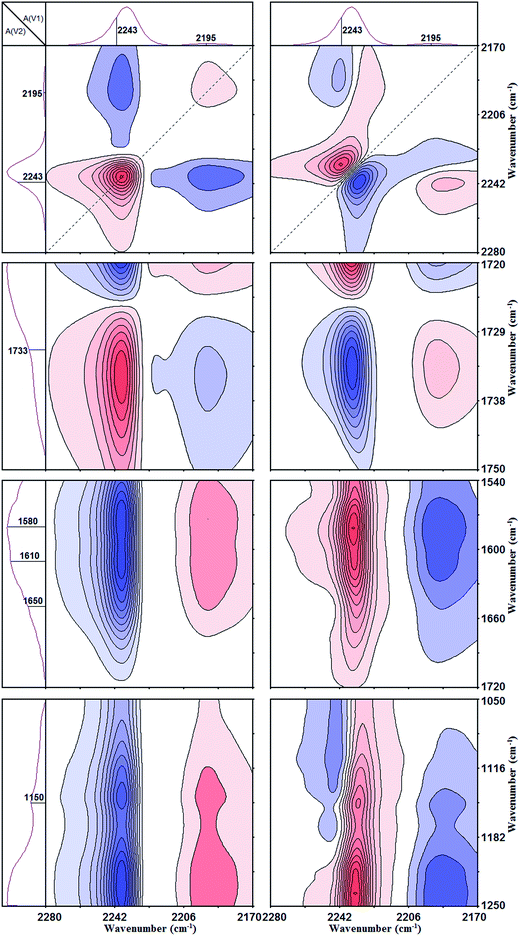
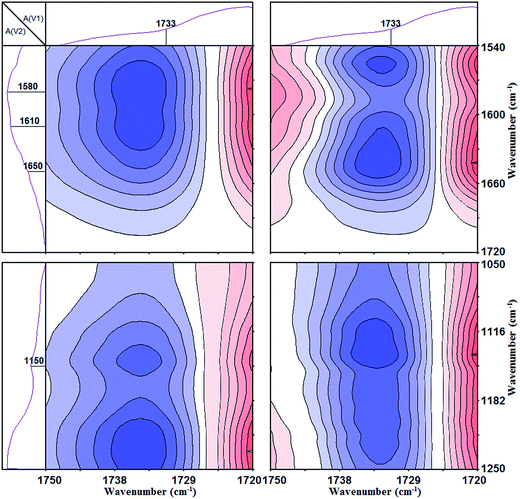
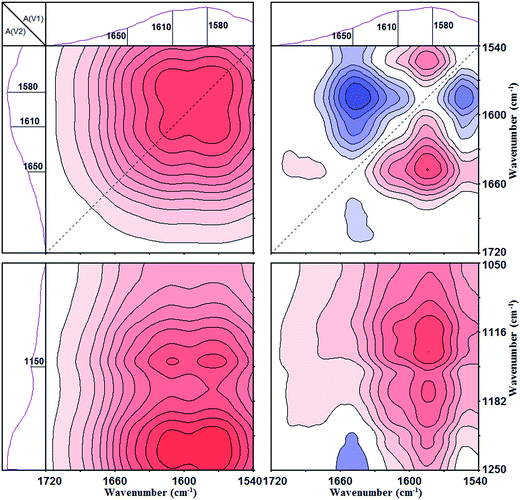
To capture the detailed pathways of the initial process (A) and the main process (B) during the pre-oxidation of PAN fibers, the in situ FTIR spectra within process A (69–223 °C) and process B (223–309 °C) were used to perform the generalized 2D correlation analysis. Generalized 2D correlation FTIR spectra contain synchronous and asynchronous spectra. The sequential order of the spectral intensity change of functional groups can be determined by the sign of the correlation peaks using Noda's rules.24 Simple summarization of Noda's rules is as follows:(1) If Φ(ν1, ν2) > 0, Ψ(ν1, ν2) > 0 or Φ(ν1, ν2) < 0, Ψ(ν1, ν2) < 0, then the movement of ν1 is before that of ν2;
(2) If Φ(ν1, ν2) > 0, Ψ(ν1, ν2) < 0 or Φ(ν1, ν2) < 0, Ψ(ν1, ν2) > 0, then the movement of ν1 is after that of ν2;
(3) If Φ(ν1, ν2) > 0, Ψ(ν1, ν2) = 0 or Φ(ν1, ν2) < 0, Ψ(ν1, ν2) = 0, then the movements of ν1 and ν2 are simultaneous.
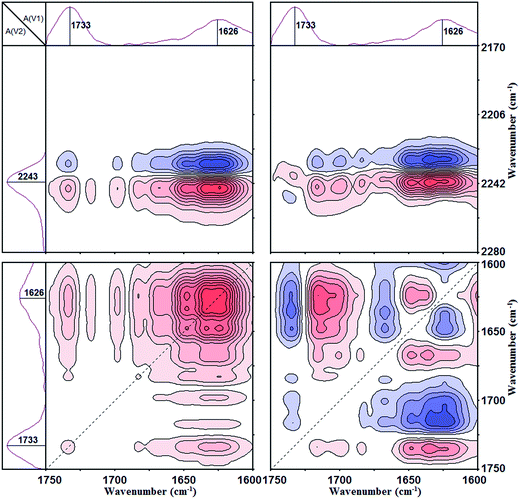
![[triple bond, length as m-dash]](https://www.rsc.org/images/entities/char_e002.gif) N). The generalized 2D correlation FTIR spectra in the region of 1750–1600 cm−1 vs. 2280–2170 cm−1 and 1750–1600 cm−1 are shown in Fig. 6, which are calculated from the in situ spectra of process A (69–223 °C). The signs of the correlation peaks at (1733 cm−1, 1626 cm−1), (1733 cm−1, 2243 cm−1), and (1626 cm−1, 2243 cm−1) are summarized in Table S3 in the ESI.† The sequential order is determined to be 1626 cm−1 → 1733 cm−1 → 2243 cm−1 according to Noda's rules. Herein, the symbol “→” represents “before”, and “←” represents “after”.
N). The generalized 2D correlation FTIR spectra in the region of 1750–1600 cm−1 vs. 2280–2170 cm−1 and 1750–1600 cm−1 are shown in Fig. 6, which are calculated from the in situ spectra of process A (69–223 °C). The signs of the correlation peaks at (1733 cm−1, 1626 cm−1), (1733 cm−1, 2243 cm−1), and (1626 cm−1, 2243 cm−1) are summarized in Table S3 in the ESI.† The sequential order is determined to be 1626 cm−1 → 1733 cm−1 → 2243 cm−1 according to Noda's rules. Herein, the symbol “→” represents “before”, and “←” represents “after”.
The corresponding sequential order of the groups' movement is δ(O–H, absorbed water) → ν(C![[double bond, length as m-dash]](https://www.rsc.org/images/entities/char_e001.gif) O, MMA) → ν(C
O, MMA) → ν(C![[triple bond, length as m-dash]](https://www.rsc.org/images/entities/char_e002.gif) N). That means the dehydration of the absorbed water in PAN copolymer fibers is the first step, followed by the movement of C
N). That means the dehydration of the absorbed water in PAN copolymer fibers is the first step, followed by the movement of C![[double bond, length as m-dash]](https://www.rsc.org/images/entities/char_e001.gif) O groups in the MMA units and the movement of C
O groups in the MMA units and the movement of C![[triple bond, length as m-dash]](https://www.rsc.org/images/entities/char_e002.gif) N groups in the AN units. It is noted that the molecular movement of C
N groups in the AN units. It is noted that the molecular movement of C![[double bond, length as m-dash]](https://www.rsc.org/images/entities/char_e001.gif) O groups in the MMA units is before that of C
O groups in the MMA units is before that of C![[triple bond, length as m-dash]](https://www.rsc.org/images/entities/char_e002.gif) N groups in the AN units. This reveals that the reaction of C
N groups in the AN units. This reveals that the reaction of C![[triple bond, length as m-dash]](https://www.rsc.org/images/entities/char_e002.gif) N groups is initiated by the ester groups of MMA, which validates our inference of the induced reaction between MMA and AN units in process A. This result is also the same as the induction period, as reported in other studies.15,22 However, the difference in our finding is that the induced reaction between MMA and AN units occurs at a relatively low temperature (below 223 °C). Compared with the main process of the PAN fibers pre-oxidation (process B), although process A is very weak, it is very important for the PAN cyclization in process B.
N groups is initiated by the ester groups of MMA, which validates our inference of the induced reaction between MMA and AN units in process A. This result is also the same as the induction period, as reported in other studies.15,22 However, the difference in our finding is that the induced reaction between MMA and AN units occurs at a relatively low temperature (below 223 °C). Compared with the main process of the PAN fibers pre-oxidation (process B), although process A is very weak, it is very important for the PAN cyclization in process B.
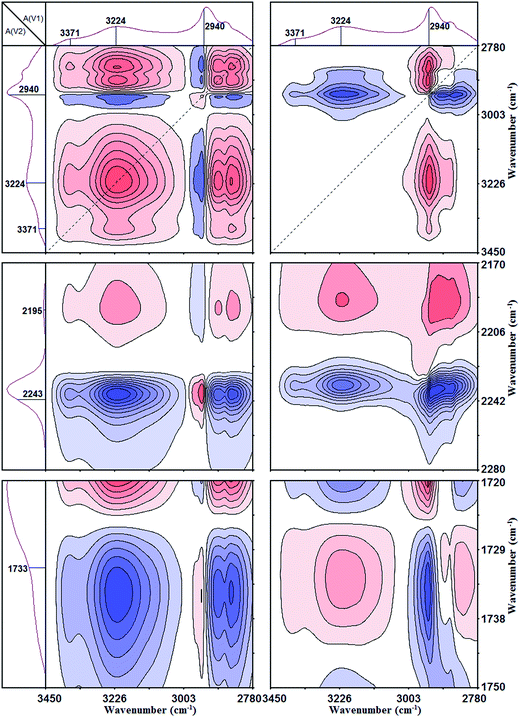
The corresponding sequential order of the groups' movement is ν(C![[double bond, length as m-dash]](https://www.rsc.org/images/entities/char_e001.gif) O, MMA) → ν(C
O, MMA) → ν(C![[double bond, length as m-dash]](https://www.rsc.org/images/entities/char_e001.gif) N, cyclic) → ν(C
N, cyclic) → ν(C![[double bond, length as m-dash]](https://www.rsc.org/images/entities/char_e001.gif) C, cyclic) → ν(O–H) = ν(N–H) → ν(C
C, cyclic) → ν(O–H) = ν(N–H) → ν(C![[double bond, length as m-dash]](https://www.rsc.org/images/entities/char_e001.gif) O, cyclic) → ν(C–O–C) → ν(C
O, cyclic) → ν(C–O–C) → ν(C![[triple bond, length as m-dash]](https://www.rsc.org/images/entities/char_e002.gif) N) → ν(C
N) → ν(C![[triple bond, length as m-dash]](https://www.rsc.org/images/entities/char_e002.gif) N, β-amino) → νas(–CH2–). The molecular movement of C
N, β-amino) → νas(–CH2–). The molecular movement of C![[double bond, length as m-dash]](https://www.rsc.org/images/entities/char_e001.gif) O groups in the MMA units is the first in process B. Then, the movements of C
O groups in the MMA units is the first in process B. Then, the movements of C![[double bond, length as m-dash]](https://www.rsc.org/images/entities/char_e001.gif) N and C
N and C![[double bond, length as m-dash]](https://www.rsc.org/images/entities/char_e001.gif) C in the cyclic structures follow. In addition, the movement of C
C in the cyclic structures follow. In addition, the movement of C![[double bond, length as m-dash]](https://www.rsc.org/images/entities/char_e001.gif) N in the cyclic structures is before that of C
N in the cyclic structures is before that of C![[double bond, length as m-dash]](https://www.rsc.org/images/entities/char_e001.gif) C in the cyclic structures. Many scientists have reported that in the FTIR spectrum, the peaks at 1580 cm−1 (C
C in the cyclic structures. Many scientists have reported that in the FTIR spectrum, the peaks at 1580 cm−1 (C![[double bond, length as m-dash]](https://www.rsc.org/images/entities/char_e001.gif) N, cyclic) and 1610 cm−1 (C
N, cyclic) and 1610 cm−1 (C![[double bond, length as m-dash]](https://www.rsc.org/images/entities/char_e001.gif) C, cyclic) are the most important characteristic bands for monitoring the formation of the PAN cyclic structure.15,42,43 In our opinion, ν(C
C, cyclic) are the most important characteristic bands for monitoring the formation of the PAN cyclic structure.15,42,43 In our opinion, ν(C![[double bond, length as m-dash]](https://www.rsc.org/images/entities/char_e001.gif) O, MMA) → ν(C
O, MMA) → ν(C![[double bond, length as m-dash]](https://www.rsc.org/images/entities/char_e001.gif) N, cyclic) → ν(C
N, cyclic) → ν(C![[double bond, length as m-dash]](https://www.rsc.org/images/entities/char_e001.gif) C, cyclic) actually reveals the generation of some initial cyclic structures in the PAN copolymer fibers. The movement of ν(C
C, cyclic) actually reveals the generation of some initial cyclic structures in the PAN copolymer fibers. The movement of ν(C![[double bond, length as m-dash]](https://www.rsc.org/images/entities/char_e001.gif) O, MMA) is a natural result of process A, which indicates that the initial cyclization starts from the chemical structure formed by the induced reaction between MMA and AN units in process A. For the initial cyclization, it also shows that the C
O, MMA) is a natural result of process A, which indicates that the initial cyclization starts from the chemical structure formed by the induced reaction between MMA and AN units in process A. For the initial cyclization, it also shows that the C![[double bond, length as m-dash]](https://www.rsc.org/images/entities/char_e001.gif) N structure is first generated, and then the C
N structure is first generated, and then the C![[double bond, length as m-dash]](https://www.rsc.org/images/entities/char_e001.gif) C structure. To clearly explain the reaction pathways gained from the 2D correlation FTIR analysis, the chemical structures discussed here are all illustrated in Fig. 12. Subsequently, the oxygen in the air is involved, and the oxidation reaction occurs. The oxygen attacks the carbon atoms from the –C
C structure. To clearly explain the reaction pathways gained from the 2D correlation FTIR analysis, the chemical structures discussed here are all illustrated in Fig. 12. Subsequently, the oxygen in the air is involved, and the oxidation reaction occurs. The oxygen attacks the carbon atoms from the –C![[double bond, length as m-dash]](https://www.rsc.org/images/entities/char_e001.gif) C– structure, and the hydroxyl pyridine structure (–C
C– structure, and the hydroxyl pyridine structure (–C![[double bond, length as m-dash]](https://www.rsc.org/images/entities/char_e001.gif) C–OH) is formed. At the same time, the isomerization of the C
C–OH) is formed. At the same time, the isomerization of the C![[double bond, length as m-dash]](https://www.rsc.org/images/entities/char_e001.gif) N structure is induced. The N–H group is formed due to the electrophilic attack of the active H on the nitrogen atom in C
N structure is induced. The N–H group is formed due to the electrophilic attack of the active H on the nitrogen atom in C![[double bond, length as m-dash]](https://www.rsc.org/images/entities/char_e001.gif) N. As is well known, the –C
N. As is well known, the –C![[double bond, length as m-dash]](https://www.rsc.org/images/entities/char_e001.gif) C–OH structure is unstable, which can be easily transformed into a quasi-pyridone structure with –C
C–OH structure is unstable, which can be easily transformed into a quasi-pyridone structure with –C![[double bond, length as m-dash]](https://www.rsc.org/images/entities/char_e001.gif) O. The assumption of the sub-process of ν(O–H) = ν(N–H) → ν(C
O. The assumption of the sub-process of ν(O–H) = ν(N–H) → ν(C![[double bond, length as m-dash]](https://www.rsc.org/images/entities/char_e001.gif) O, cyclic) has been proposed by other scientists.22,47 In this study, this assumption is supported by the results of 2D correlation FTIR for the first time. The generation of C–O–C is after that of the quasi-pyridone structure. The C–O–C structure (as shown in Fig. 12) was also proposed and reported by Standage and Matkowsky.49 The main reason for the C–O–C formation is probably the dehydration reaction of adjacent hydroxyls on the initial cyclic structure.
O, cyclic) has been proposed by other scientists.22,47 In this study, this assumption is supported by the results of 2D correlation FTIR for the first time. The generation of C–O–C is after that of the quasi-pyridone structure. The C–O–C structure (as shown in Fig. 12) was also proposed and reported by Standage and Matkowsky.49 The main reason for the C–O–C formation is probably the dehydration reaction of adjacent hydroxyls on the initial cyclic structure.
According to the sequential order of the 2D correlation analysis, after the formation of C–O–C, the movement of C![[triple bond, length as m-dash]](https://www.rsc.org/images/entities/char_e002.gif) N groups occurs. In our in situ FTIR experiment, the sudden rapid decrease in the band intensity of the C
N groups occurs. In our in situ FTIR experiment, the sudden rapid decrease in the band intensity of the C![[triple bond, length as m-dash]](https://www.rsc.org/images/entities/char_e002.gif) N groups (2243 cm−1) was observed in process B, which indicated the strong chemical reaction of the C
N groups (2243 cm−1) was observed in process B, which indicated the strong chemical reaction of the C![[triple bond, length as m-dash]](https://www.rsc.org/images/entities/char_e002.gif) N groups. The sub-process of ν(C
N groups. The sub-process of ν(C![[triple bond, length as m-dash]](https://www.rsc.org/images/entities/char_e002.gif) N) → ν(C
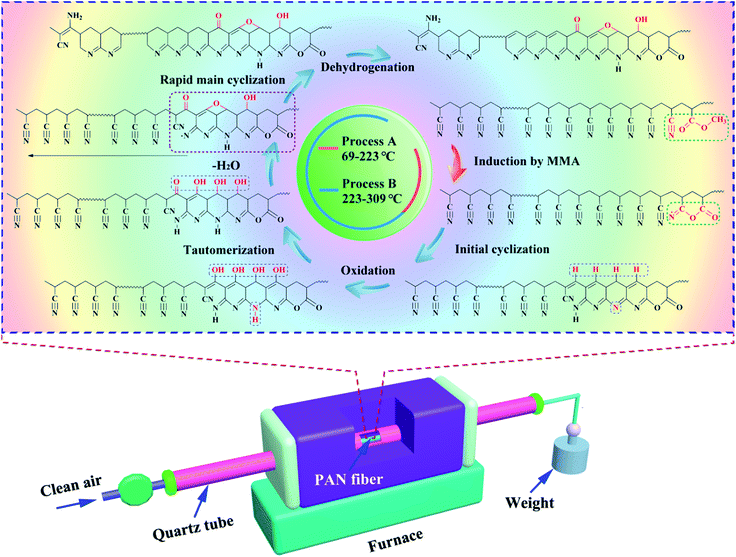
N) → ν(C![[triple bond, length as m-dash]](https://www.rsc.org/images/entities/char_e002.gif) N, β-amino) certainly reveals the main cyclization reaction from a large number of AN units, which then produce some products of β-amino nitriles. In the in situ FTIR experiment, we also observe the gradual increase of the band intensity of β-amino nitrile (2195 cm−1) in process B. Many studies have reported that the co-monomer in PAN copolymer fibers significantly reduces the difficulty of the ring formation reaction due to the induction of the co-monomer units via the nucleophilic attack on the carbon atom of an adjacent nitrile group.4,8,15,43,50 However, from the sequential order of the 2D correlation analysis, more detailed pathways are obtained. As discussed in the previous section, the induced reaction of MMA units on AN units are already been finished in process A (69–223 °C). When the temperature increases to process B (223–309 °C), the initial cyclic structures are formed from the chemical structure formed by the induced reaction in process A. Then, these initial cyclic structures undergo a series of oxidation reactions and subsequent isomerization reaction and the generation reaction of the C–O–C structure. The initial cyclic structures after the oxidation and isomerization are the real induced center and starting point of the main cyclization reaction. This also reveals that the oxygen in the air plays an important role in the PAN cyclization. β-amino nitrile is the product of the main cyclization reaction. The appearance of β-amino nitrile in PAN pre-oxidation was also reported by Bajaj et al.51 and by Gupta et al.52 The most likely location of β-amino nitrile is at the end of the polycyclic structure. The last step of the sequential order is the movement of –CH2– groups. In the in situ FTIR experiment, a rapid reduction of the –CH2– bands intensity (2940 cm−1) was observed in process B, especially at around 288 °C, which was also detected by scaling-MW2D FTIR in Fig. 5. The concentration reduction of –CH2– groups at a high temperature certainly reveals the dehydrogenation reaction on the polycyclic structures.
N, β-amino) certainly reveals the main cyclization reaction from a large number of AN units, which then produce some products of β-amino nitriles. In the in situ FTIR experiment, we also observe the gradual increase of the band intensity of β-amino nitrile (2195 cm−1) in process B. Many studies have reported that the co-monomer in PAN copolymer fibers significantly reduces the difficulty of the ring formation reaction due to the induction of the co-monomer units via the nucleophilic attack on the carbon atom of an adjacent nitrile group.4,8,15,43,50 However, from the sequential order of the 2D correlation analysis, more detailed pathways are obtained. As discussed in the previous section, the induced reaction of MMA units on AN units are already been finished in process A (69–223 °C). When the temperature increases to process B (223–309 °C), the initial cyclic structures are formed from the chemical structure formed by the induced reaction in process A. Then, these initial cyclic structures undergo a series of oxidation reactions and subsequent isomerization reaction and the generation reaction of the C–O–C structure. The initial cyclic structures after the oxidation and isomerization are the real induced center and starting point of the main cyclization reaction. This also reveals that the oxygen in the air plays an important role in the PAN cyclization. β-amino nitrile is the product of the main cyclization reaction. The appearance of β-amino nitrile in PAN pre-oxidation was also reported by Bajaj et al.51 and by Gupta et al.52 The most likely location of β-amino nitrile is at the end of the polycyclic structure. The last step of the sequential order is the movement of –CH2– groups. In the in situ FTIR experiment, a rapid reduction of the –CH2– bands intensity (2940 cm−1) was observed in process B, especially at around 288 °C, which was also detected by scaling-MW2D FTIR in Fig. 5. The concentration reduction of –CH2– groups at a high temperature certainly reveals the dehydrogenation reaction on the polycyclic structures.
4. Conclusions
In this study, in situ FTIR spectroscopy in combination with scaling-MW2D and 2D correlation analysis was used to study the reaction pathways of the PAN copolymer fibers pre-oxidation process. Scaling-MW2D revealed that the PAN copolymer fibers pre-oxidation was composed of an initial process (process A, 69–223 °C) and main process (process B, 223–309 °C). From the sequential order of the 2D correlation analysis, more detailed pathways of PAN fibers pre-oxidation were obtained (Fig. 12):(1) The induced reaction of MMA units on AN units was completed in process A (69–223 °C).
(2) In process B (223–309 °C), the initial cyclic structures were first generated from the chemical structure formed by the induced reaction in process A.
(3) Then, these initial cyclic structures underwent a series of oxidations and subsequent isomerization.
(4) Subsequently, a large number of AN units are immediately involved in the main cyclization reaction, and some β-amino nitriles are produced. The initial cyclic structures after the oxidation and isomerization are the real induced center of the main cyclization reaction, and therefore the oxygen in the air plays a key role in the PAN main cyclization.
(5) The last step is the dehydrogenation reaction on the polycyclic structures at a high temperature.
Acknowledgements
This study was supported by the National Natural Science Foundation of China (Grant No. 51473104, 51003066) and State Key Laboratory of Polymer Materials Engineering (Grant No. sklpme2014-3-06, sklpme2014-2-10).Notes and references
- Y. Wang, L. Xu, M. Wang, W. Pang and X. Ge, Macromolecules, 2014, 47, 3901–3908 CrossRef.
- K. Pingkarawat, T. Bhat, D. Craze, C. Wang, R. Varley and A. Mouritz, Polym. Chem., 2013, 4, 5007–5015 RSC.
- Z. Yang, T. Chen, R. He, H. Li, H. Lin, L. Li, G. Zou, Q. Jia and H. Peng, Polym. Chem., 2013, 4, 1680–1684 RSC.
- H. Wang, Q. Guo, J. Yang, Z. Liu, Y. Zhao, J. Li, Z. Feng and L. Liu, Carbon, 2013, 56, 296–308 CrossRef CAS.
- J. Liu, Z. Yue and H. Fong, Small, 2009, 5, 536–542 CrossRef CAS PubMed.
- M. S. A. Rahaman, A. F. Ismail and A. Mustafa, Polym. Degrad. Stab., 2007, 92, 1421–1432 CrossRef CAS.
- Y. Zhang, N. Tajaddod, K. Song and M. L. Minus, Carbon, 2015, 91, 479–493 CrossRef CAS.
- W. X. Zhang, J. Liu and G. Wu, Carbon, 2003, 41, 2805–2812 CrossRef CAS.
- S.-Y. Kim, S. Lee, S. Park, S. M. Jo, H.-S. Lee and H.-I. Joh, Carbon, 2015, 94, 412–416 CrossRef CAS.
- T. Usami, T. Itoh, H. Ohtani and S. Tsuge, Macromolecules, 1990, 23, 2460–2465 CrossRef CAS.
- S. Dalton, F. Heatley and P. M. Budd, Polymer, 1999, 40, 5531–5543 CrossRef CAS.
- S. H. Bahrami, P. Bajaj and K. Sen, J. Appl. Polym. Sci., 2003, 88, 685–698 CrossRef CAS.
- S. C. Martin, J. J. Liggat and C. E. Snape, Polym. Degrad. Stab., 2001, 74, 407–412 CrossRef CAS.
- C. Dick, E. Dominguez-Rosado, B. Eling, J. J. Liggat, C. I. Lindsay, S. C. Martin, M. H. Mohammed, G. Seeley and C. E. Snape, Polymer, 2001, 42, 913–923 CrossRef CAS.
- N.-T. Ngoc Uyen and H. Sung Chul, Macromolecules, 2013, 46, 5882–5889 CrossRef.
- H. Yang, P. F. Gao, W. B. Wu, X. X. Yang, Q. L. Zeng, C. Li and C. Z. Huang, Polym. Chem., 2014, 5, 1965–1975 RSC.
- A. Ju, Z. Liu, M. Luo, H. Xu and M. Ge, J. Polym. Res., 2013, 20, 1–17 CAS.
- Y. Xue, J. Liu, F. Lian and J. Liang, Polym. Degrad. Stab., 2013, 98, 2259–2267 CrossRef CAS.
- X. Liu, W. Chen, Y.-L. Hong, S. Yuan, S. Kuroki and T. Miyoshi, Macromolecules, 2015, 48, 5300–5309 CrossRef CAS.
- S. Soulis and J. Simitzis, Polym. Int., 2005, 54, 1474–1483 CrossRef CAS.
- A. F. Thunemann, Macromolecules, 2000, 33, 1790–1795 CrossRef.
- Y. Xue, J. Liu and J. Liang, Polym. Degrad. Stab., 2013, 98, 219–229 CrossRef CAS.
- J. Liu, P. H. Wang and R. Y. Li, J. Appl. Polym. Sci., 1994, 52, 945–950 CrossRef CAS.
- I. Noda, Appl. Spectrosc., 1993, 47, 1329–1336 CrossRef CAS.
- M. Thomas and H. H. Richardson, Vib. Spectrosc., 2000, 24, 137–146 CrossRef CAS.
- S. Morita, H. Shinzawa, I. Noda and Y. Ozaki, Appl. Spectrosc., 2006, 60, 398–406 CrossRef CAS PubMed.
- S. Morita, K. Kitagawa, I. Noda and Y. Ozaki, J. Mol. Struct., 2008, 883, 181–186 CrossRef.
- W. Li and P. Wu, Polym. Chem., 2014, 5, 5578–5590 RSC.
- W. Li and P. Wu, Polym. Chem., 2014, 5, 761–770 RSC.
- L. Hou and P. Wu, RSC Adv., 2014, 4, 39231–39241 RSC.
- T. Zhou, Y. Liu, L. Peng, Y. Zhan, F. Liu, A. Zhang and L. Li, Anal. Bioanal. Chem., 2014, 406, 4157–4172 CrossRef CAS PubMed.
- Q. Yuan, T. Zhou, L. Li, J. Zhang, X. Liu, X. Ke and A. Zhang, RSC Adv., 2015, 5, 31153–31165 RSC.
- Y. Liu, W. Li, L. Hou and P. Wu, RSC Adv., 2014, 4, 24263–24271 RSC.
- T. Zhou, A. Zhang, C. Zhao, H. Liang, Z. Wu and J. Xia, Macromolecules, 2007, 40, 9009–9017 CrossRef CAS.
- H. Lai and P. Wu, Polymer, 2010, 51, 1404–1412 CrossRef CAS.
- X. Liu, T. Zhou, Y. Liu, A. Zhang, C. Yuan and W. Zhang, RSC Adv., 2015, 5, 10231–10242 RSC.
- H. G. Chae, M. L. Minus, A. Rasheed and S. Kumar, Polymer, 2007, 48, 3781–3789 CrossRef CAS.
- L. Yaodong, C. Han Gi and S. Kumar, Carbon, 2011, 49, 4466–4476 CrossRef.
- K. L. Gallaher, D. Lukco and J. G. Grasselli, Can. J. Chem., 1985, 63, 1960–1966 CrossRef CAS.
- N. Grassie and R. McGuchan, Eur. Polym. J., 1971, 7, 1357–1371 CrossRef CAS.
- S. Deki, H. Nabika, K. Akamatsu, M. Mizuhata, A. Kajinami, S. Tomita, M. Fujii and S. Hayashi, Thin Solid Films, 2002, 408, 59–63 CrossRef CAS.
- N. Grassie and R. McGuchan, Eur. Polym. J., 1972, 8, 257–269 CrossRef CAS.
- H. Kakida, K. Tashiro and M. Kobayashi, Polym. J., 1996, 28, 30–34 CrossRef CAS.
- J. Mittal, O. P. Bahl, R. B. Mathur and N. K. Sandle, Carbon, 1994, 32, 1133–1136 CrossRef CAS.
- H. Kono, S. Yunoki, T. Shikano, M. Fujiwara, T. Erata and M. Takai, J. Am. Chem. Soc., 2002, 124, 7506–7511 CrossRef CAS PubMed.
- E. Pretsch, P. Bühlmann, C. Affolter, E. Pretsch, P. Bhuhlmann and C. Affolter, Structure determination of organic compounds, Springer, 2009 Search PubMed.
- Z. Fu, Y. Gui, C. Cao, B. Liu, C. Zhou and H. Zhang, J. Mater. Sci., 2014, 49, 2864–2874 CrossRef CAS.
- M. Liu, P. Wu, Y. Ding, G. Chen and S. Li, Macromolecules, 2002, 35, 5500–5507 CrossRef CAS.
- A. Standage and R. Matkowsky, Eur. Polym. J., 1971, 7, 775–783 CrossRef CAS.
- I. Karacan and G. Erdogan, Fibers Polym., 2012, 13, 329–338 CrossRef CAS.
- P. Bajaj, D. Paliwal and A. Gupta, J. Appl. Polym. Sci., 1993, 49, 823–833 CrossRef CAS.
- A. Gupta, D. Paliwal and P. Bajaj, J. Macromol. Sci., Polym. Rev., 1991, 31, 1–89 Search PubMed.
Footnote |
| † Electronic supplementary information (ESI) available. See DOI: 10.1039/c5ra24320c |
| This journal is © The Royal Society of Chemistry 2016 |

