DOI:
10.1039/C5RA24482J
(Paper)
RSC Adv., 2016,
6, 9106-9111
Band modification of graphene by using slow Cs+ ions†
Received
19th November 2015
, Accepted 28th December 2015
First published on 6th January 2016
Abstract
We report new wide band gap engineering for graphene using slow Cs+ ions, which allows both fine-tuning and on–off switching capability of the band gap in a range suitable for most applications without modifying or deteriorating the relativistic nature of the Dirac fermions. The doping of Cs+ ions opens the band gap up to Eg = 0.68 eV, which can be closed completely by adding neutral Cs atoms, as observed in angle-resolved photoemission spectroscopy. The operating mechanism of this band gap engineering is understood by a simple capacitor model, which is fully supported by the density-functional theory calculations.
1. Introduction
Graphene, a single atomic layer of graphite, is a tantalizing candidate that is utilized in electronic applications mainly due to its linear gapless band spectrum.1–4 This gapless semi-metallic nature of graphene, however, needs to be converted into a semiconducting phase with a finite band gap (Eg) to control the conductivity in most electronic applications.5–9 Because the massless Dirac fermions in graphene showing ballistic charge transport, even at room temperature, are ideal charge carriers for fast circuit devices, research efforts have been continued to open a tunable band gap in graphene. To this end, there have been continuous efforts to realize the band gap in graphene using several different schemes, for example, using graphene nanoribbons,10,11 bilayer graphene,12,13 and the functionalized graphene.14,15 As described in earlier studies, each method has its own merits, but none so far appears to offer a stable and tunable band gap with on/off switching capability for device applications. Because of its diversity and feasibility, the functionalized graphene has been extensively adopted to open a band gap at the K-point (k‖ = 1.7 Å−1) of the Brillouin zone, essentially by lifting the symmetry between the two sublattices (A and B) of graphene with external adatoms15,16 or admolecules.17,18 One of the crucial drawbacks of this method, however, is the adsorbate-induced degradation of the exotic properties of graphene, such as the severe lattice distortions predicted for the hydrogenated graphene,19 and the reduced mobility of the charge carriers.20 With slow alkali metal ions, however, graphene may be functionalized with no such drawbacks by avoiding the strong covalent hybridization with the sp2 orbitals of graphene.21,22
Herein, we report an efficient route to functionalize graphene to create a tunable band gap in graphene using a low-energy beam of Cs+ ions. Without causing any detectable adverse effects on the intrinsic properties of graphene, we find a rather easy and reproducible means to not only form a band gap in graphene, but also accurately control its size up to Eg = 0.68 eV by varying the dose of Cs+ ions. We further demonstrate that one may establish the on/off switching capability of the band gap by mixing Cs+ ions with neutral Cs atoms in a proper sequential order. We observed evidence of these features both in the linear π-band of graphene and the C 1s and Cs 4d core levels from a single layer graphene (SLG) formed on a SiC(0001) surface by angle-resolved photoemission spectroscopy (ARPES) and high-resolution core level spectroscopy (HRCLS) using synchrotron photons.
Scanning tunneling microscopy (STM) of Cs+-doped SLG show a preferred direction in the charge density, which is indicative of symmetry breaking for the two sublattices. By devising a parallel-plate capacitor model to simulate the Cs+-doped graphene, we carried out our density functional theory (DFT) calculations, which account for most of our experimental observations associated with the band gap.
2. Results and discussion
2.1. Cs+ ion-induced band gap in the π-band of graphene
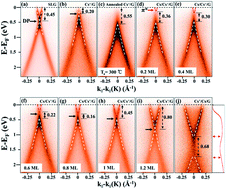
Fig. 1 shows the changes in the linear π-band of SLG upon surface treatments with Cs+ ions or neutral Cs atoms obtained from (a) SLG, (b) 1.0 monolayer (ML) Cs+ ions doped graphene (Cs+/G), (c) Cs+/G annealed at 300 °C, (d)–(i) Cs added Cs+/G (Cs/Cs+/G) with increasing Cs coverage θCs, and (j) Cs+ ion deposited on Cs pre-adsorbed graphene (Cs+/Cs/G). These bands were obtained along the direction perpendicular to the Γ → K direction with the center at the K-point. The best fit bands to locate the top (bottom) of the π-(π*-) band are depicted as white dashed lines in Fig. 1, drawn by determining the slopes of the bands from the neighboring momentum distribution curves (MDCs) obtained at two different energies near the Dirac point (DP).
 |
| | Fig. 1 Opening and fine-tuning a band gap in the π-band of graphene. The changes in the π-band of graphene upon different surface treatments with Cs+ ions and neutral Cs atoms: (a) SLG, (b) Cs+ ions doped (1.0 ML) graphene (Cs+/G), (c) Cs+/G annealed at 300 °C, (d)–(i) Cs added Cs+/G (Cs/Cs+/G) with increasing θCs, and (j) Cs+ ion deposited on Cs pre-adsorbed graphene (Cs+/Cs/G). These bands were measured using synchrotron photons of energy hν = 34 eV with the samples maintained at 85 K. A band gap of Eg = 0.55 eV is found in (c) when the Cs+/G is annealed, and the size of Eg decreases gradually with increasing θCs until it completely vanishes at θCs = 1.0 ML, demonstrating the on/off switching feature of the band gap. In (j), additional Cs induces n-doping for the DP, and opens a band gap up to Eg = 0.68 eV when Cs+ ions are doped again. The energy distribution curve (EDC; red curve) shows reduced intensity within the gap. | |
The π-band from a clean SLG in Fig. 1a shows the DP at 0.45 eV below the Fermi level by the n-doping effect from the substrate.23 The DP then shifts up by about 0.2 eV when Cs+ ions of 1 ML, with an energy of 100 eV, are deposited on the SLG (see Fig. 1b) by a p-doping effect, which is also seen from the Ar+ ions deposited graphene24 due to the reduced charge transfer near the Cs+-induced defects. Interestingly, we can easily control the position of DP by adjusting the number of Cs+ ions on graphene. The DP changes drastically when this Cs+/G sample is annealed at Ta = 300 °C (Fig. 1c), where the top of the π-band is shifted down by 0.35 eV with no visible conduction (π*-) band, apparently signifying the opening of a band gap, Eg ≥ 0.55 eV. As we add neutral Cs atoms (θCs = 0.2 ML) to the annealed sample to form a Cs/Cs+/G sample, the minimum of the π*-band (red dashed lines) begins to appear, as shown in Fig. 1d, showing a reduced Eg = 0.36 eV. The size of the band gap decreases gradually with increasing θCs, and eventually vanishes at θCs = 1.0 ML when the tips of π- and π*-band meet at the DP (Fig. 1h). The DP continues to shift down with θCs > 1.0 ML reaching, for example, 0.80 eV, away from the Fermi level for θCs = 1.2 ML (Fig. 1i).
2.2. Persistent Dirac nature and switching capability of the band gap
We further demonstrate that not only the size of the band gap but also the position of the DP can be controlled artificially by adjusting θCs of neutral Cs atoms prior to the deposition Cs+ ions on graphene. In Fig. 1j, we deposited Cs+ ions (1.0 ML) on the Cs pre-adsorbed graphene (θCs = 1.2 ML), where Eg = 0.68 eV when the sample is annealed at Ta = 300 °C. The Cs pre-adsorbed SLG shows the DP at 1.4 eV below the Fermi energy with some intensity near the DP probably due to in-gap states or due to many-body interactions as debated earlier.25–29 It is important to note that the opening of such a band gap has little effect on the intrinsic nature of the π-band, as seen by the estimated Fermi velocity vF = 0.94 ± 0.05 × 10⁶ m s−1, which is reduced slightly from 1.07 ± 0.02 × 10⁶ m s−1 of the SLG in Fig. 1a while maintaining the linear dispersion. Thus, the coverage of pre-adsorbed Cs on graphene determines the position of DP, the mid-gap or Dirac energy of the band gap, while the number of Cs+ ions deposited determines the size of the band gap itself. We thus demonstrate the opening and closing of the band gap in graphene, which is thermodynamically stable up to temperatures as high as 300 °C, by controlling the sequential order and the amounts of neutral Cs atoms and Cs+ ions deposited on graphene. However, no such gap-opening was found in graphene by us when Cs+ ions of energy <100 eV were doped on SLG, where the π-band becomes gradually weaker and more diffused with increasing dose of Cs+ ions.
2.3. Theoretical DFT band calculations based on a capacitor model
Our DFT calculations for the changes in the π-band provide a plausible clue for the Cs+-induced band gap opening. Fig. 2a shows the optimized atomic structure of the SLG grown on a SiC(0001) surface used in our DFT calculations. We find the graphene-buffer interlayer distance d = 3.4 Å, which agrees well with the measured value.30 The binding site for neutral Cs atoms on graphene is found to be the hollow site with a binding energy of Eb = 1.18 eV, which is much favored energetically over the top (1.09 eV) or bridge (1.04 eV) site. Because of the limitation of handling bare Cs+ ions in the DFT calculations, we devise a simple capacitor model for the Cs+-doped SLG system as schematically drawn in Fig. 2b, where the distance d and the interlayer electric field (EGB) vary with the dose of Cs+ ions. The doped Cs+ ions on SLG form a positively charged layer with a surface charge density, ρCs. As Bader analysis suggests,31 electrons are transferred from the SiC substrate to the graphene and buffer layer to make the surface charge density of −ρG and −ρB, respectively, while SiC is positively charged with ρG + ρB. The electric field EGB between graphene and the buffer layer is then given by| |
 | (1) |
where ε0 is the vacuum permittivity. The whole system depicted in Fig. 2b is then equivalent to a parallel-plate capacitor with a surface charge density of (ρCs − 2ρG)/2. The key idea in our capacitor model is that the change in the interlayer distance Δd represents the modified sublattice asymmetry by the dosed either Cs+ ions or neutral Cs atoms,32 as confirmed by our calculations (not shown). One notices the asymmetry already existed even from the beginning when Δd = 0, and increases with increasing Δd. The equilibrium distance, d, may be found when the energy loss ΔU from the reduced d (red curve in Fig. 2c) is balanced by the gain from the electrostatic energy,| |
 | (2) |
where A is the surface area of a supercell used in the DFT calculations. Our results presented in Fig. 2c show that d is indeed reduced by Δd = 0.55 (green arrow) and 0.17 Å (blue arrow) upon the dose of one Cs+ ion per 2 × 2 and 3 × 3 supercells, or equivalently 1.0 ML and 0.44 ML, respectively. Fig. 2d–f reveal the calculated band structures of graphene on the SiC(0001) surface for some values of Δd. The DP of SLG (Δd = 0) is found at 0.45 eV. As seen in the measured π-bands in Fig. 1, we find that the π-band shifts down away from the Fermi level and opens a band gap, of which the size increases gradually with increasing Δd, producing Eg = 0.112 eV for Δd = 0.5 Å. Although the absolute size of the band gap is quite different from the one observed, our calculation reveals a driving force of the band gap upon increasing Δd, the sublattice asymmetry in graphene.32
 |
| | Fig. 2 DFT band calculations based on the capacitor model. (a) The optimized atomic structure of graphene grown on the SiC(0001) surface. Gray balls (Si), yellow balls (C), and brown balls (H). (b) A parallel plate capacitor model, representing the Cs+-doped graphene (G) on SiC(0001), where d is the graphene-buffer layer (B) distance and EGB is the electric field between them. The charge density of Cs+ ions, graphene, buffer layer, and SiC surface is represented by ρCs, −ρG, −ρB, and ρG + ρB, respectively. (c) Changes in the energy loss (red squares) and gain (green and blue) as Δd increases, where one finds the energy-balanced distance change of Δd = 0.55 (green arrow) and 0.17 Å (blue arrow) by one Cs+ ion per 2 × 2 and 3 × 3 supercells, respectively. (d)–(f) Changes in the band structures with increasing Δd, showing the gradual increase in the band gap up to 112 meV for Δd = 0.5 Å. | |
We also find that the charge density ρCs (>20ρG) from the Cs+ ions is significantly greater than ρG, the negative charge density of graphene transferred from SiC. This explains why no detectable band gap opens when neutral Cs atoms alone are adsorbed on SLG because ΔU becomes negligibly small for −ρG of graphene as the only charge for EGB. When neutral Cs atoms are added to the Cs+ pre-added graphene, a new charge density ρG* begins to form in graphene transferred from the SiC substrate in addition to ρG to achieve a new Bader's condition, ∇ρ = 0, along the surface normal because of the added Cs atoms.31 Our core level data show the signature for the presence of ρG*, as discussed later. The gradual decrease in the band gap in Fig. 1d–h appears because EGB decreases gradually as the net charge density ρCs − 2(ρG* + ρG) in graphene decreases with increasing ρG* as θCs increases. The band gap eventually disappears when EGB vanishes for a certain θCs, which makes ρCs − 2(ρG* + ρG) = 0. Experimentally, this occurs when θCs = 1.0 ML, as shown in Fig. 1h.
The characteristic changes in the C 1s and Cs 4d core levels presented in Fig. 3 for the four different phases of graphene; SLG, Cs+/G, annealed Cs+/G, and Cs/Cs+/G, also suggest that the Cs+-induced lattice asymmetry drives the band gap opening as discussed below. The C 1s from the SLG formed on SiC(0001) in Fig. 3a has four subcomponents; G from the carbons of graphene, S1 and S2 from the carbons of the buffer layer bonded with and without Si atoms, and SiC from the substrate. The red solid curves are the fit-curves of the data points (empty circles). To estimate the relative abundance of graphene, we have used a conventional layer-attenuation model for core-level intensities.33
 |
| | Fig. 3 Cs-induced changes in the core levels. (a) C 1s and (b) Cs 4d core-level spectra collected with synchrotron photons of energy 510 eV from the four different phases of graphene, as shown in Fig. 1. The annealing temperature Ta = 300 °C, and the Cs coverage θCs = 1.2 ML for the Cs/Cs+/G phase. The red curves are the fit curves of the data points (empty circles), and the vertical dashed line indicates the G-subcomponent of SLG to guide eyes. The changes in binding energy ΔEb and normalized spectral intensity (I) of C 1s are presented in (c) and (d), respectively. Three different components, Cs1, Cs2, and Cs3, of Cs 4d in (b) are schematically drawn in (e) with Cs (large circles) bonded with carbons (small circles) at three distinct binding sites. | |
The dose of Cs+ ions for the Cs+/G phase immediately produces a new subcomponent, C–Cs (Eb = 285.7 eV) in the C 1s, arising from Cs-bonded carbon at the expense of the reduced G component.28 In addition, the entire spectrum is uniformly shifted by about −0.20 eV toward the lower binding energy side, as also seen in the valence band (Fig. 1b), arising from the reduced charge transfer from the substrate, as mentioned earlier.24 The Cs 4d core levels in Fig. 3b are best fitted with three subcomponents, Cs1, Cs2, and Cs3, suggesting three distinct bonding configurations, as depicted in Fig. 3e. A spin–orbit splitting of 2.2 eV and a branching ratio of 0.77 between the Cs 4d3/2 and Cs 4d5/2 have been used to fit the Cs 4d spectra.34 Because most alkali metals favour occupying the hollow sites,35,36 we ascribe the Cs1 to the most abundant Cs atoms at the sites slightly off from the hollow sites, and Cs3 to the Cs atoms also at the off-hollow sites well isolated from its neighboring Cs atoms.37 The Cs atoms sitting at the off-symmetric hollow sites are favored to understand the five-fold higher band gap (0.55 eV) observed than the calculated value of 0.11 eV (Fig. 2f), where no enhanced sublattice asymmetry due to the local bonding configuration is considered.
As shown in Fig. 1c, a band gap opens when the Cs+/G is annealed at Ta = 300 °C. Similar changes in the core levels also appear in Fig. 3. One first notices that all the subcomponents in the core levels shift toward the higher binding energy side, most remarkably by 0.27 eV for the G-subcomponent of the C 1s. We also observe a kind of ‘healing effect’ from the Cs 4d in Fig. 3b, where the weak Cs2 disappears completely upon annealing, while the Cs1 and Cs3 are correspondingly increased. The Cs2 subcomponent represents the Cs atoms sitting at the unstable sites, such as defects or the edges, where more dangling bonds are available to make the Cs–C bonding stronger. Thus, annealing brings the system into an equilibrium configuration with more Cs1 and Cs3 atoms, which naturally increases EGB (or reduces d) to open a band gap. This explanation is consistent with the increased intensity of the SiC subcomponent of C 1s in Fig. 3a upon annealing because of the reduced d.38
In fact, the ratio, I(SiC)/I(G), in Fig. 3c was found to increase with further annealing. Therefore, the equilibrium configuration with no Cs2 atoms for the annealed Cs+/G system has a minimum value for d, or a maximum asymmetry for the A and B sublattices of graphene, which reveals a maximum band gap Eg ≥ 0.55 eV (Fig. 1c).
As described, the band gap decreases gradually upon adding neutral Cs atoms to form the Cs/Cs+/G system (Fig. 1d–g), and disappears completely at θCs = 1.0 ML (Fig. 1h). The corresponding changes in the core levels shown in Fig. 3a reveal a prominent shift of the subcomponent C–Cs by ΔEb = +0.71 eV, while that of G by ΔEb = +0.25 eV is much greater than the shifts (≤0.07 eV) of the other subcomponents. Such remarkable shifts toward the higher energy side strongly indicate a significant change in charge distribution near the carbon atoms induced not only by neutral Cs atoms but also by the extra charge ρG* from the SiC substrate. Therefore, the addition of neutral Cs atoms on the Cs+/G sample reduces EGB, and the charge asymmetry. This explains why the band gap decreases with increasing θCs, and disappears completely at θCs = 1.0 ML when EGB = 0. The G-subcomponent of C 1s also restores its value of the SLG with increasing θCs as observed (Fig. 3b). We further notice that any excess Cs atoms beyond θCs = 1.0 ML causes a shift in the DP further away from the Fermi energy revealing an n-doping effect, as shown in Fig. 1i.
Subsequently, we find evidence for the Cs-induced sublattice asymmetry in our STM images presented in Fig. 4 for the four different phases of graphene SLG, Cs+/G, annealed Cs+/G, and Cs/Cs+/G. The well-known 6 × 6 pattern (green hexagon) is seen from the SLG (Fig. 4a), reflecting the underlying 6√3 × 6√3 reconstruction of the buffer layer with unsaturated C atoms.39 The Cs+ ions are found to sit rather randomly at the rim regions of the Moiré pattern, appearing as disordered bright protrusions in Fig. 4b. Interestingly, no superstructure of either 1 × 1 or √3 × √3 reported for the neutral Cs-adsorbed graphene is seen, indicating the distinct C–Cs bonding configurations from the one reported earlier.29,40 One, however, notices some interference pattern near Cs+ ions as for the Ar+ ions on graphene,24,41 suggesting the formation of some defects by Cs+ ions, such as the Cs2 atoms, to cause a uniform shift in the π-band (Fig. 1b) and in the core levels (Fig. 3a). From the STM images in Fig. 4c for the annealed Cs+/G sample, one notices some stripes along a preferred direction (green arrow), an indication of a certain charge asymmetry from the Cs atoms sitting at the off-symmetric hollow sites, which may cause the opening of a band gap. Interestingly, this asymmetry in the STM images begins to disappear locally as neutral Cs atoms are added to the Cs+/G, as shown in Fig. 4d, which is consistent with the reducing band gap in the π-band. This confirms that the Cs+-induced charge asymmetry among carbon atoms drives the opening of a band gap and the corresponding changes in the core levels. Details of sample preparation and spectroscopic data together with DFT calculations can be found in a separate ESI.†
42–47
 |
| | Fig. 4 Asymmetry in the charge distribution. STM images from (a) SLG (30 nm × 30 nm, Vt = −0.8 V, It = 0.7 nA), (b) Cs+/G (50 nm × 50 nm, Vt = −0.1 V, It = 0.4 nA), (c) annealed Cs+/G (50 nm × 50 nm, Vt = −0.1 V, It = 0.3 nA), and (d) Cs/Cs+/G (30 nm × 30 nm, Vt = −0.045 V, It = 0.4 nA). Inset in (a)–(c) show the magnified images of the region marked by the dashed boxes. One notices a preferred direction (green arrow) in (c) and (d), which is indicative of charge asymmetry, for the samples where a band gap is observed. | |
3. Conclusions
In summary, using slow Cs+ ions, we demonstrate the gap engineering for the SLG formed on the SiC(0001) surface. Our ARPES data for the linear π-band of graphene reveals the opening of a band gap of which the size can be fine-tuned artificially up to Eg = 0.68 eV by adjusting the number of doped Cs+ ions. We also show that the Cs+-induced band gap can also be closed gradually by adding neutral Cs atoms, and be opened again by additional Cs+ ions in the proper sequential order, thus illustrating a reproducible on/off switching capability of the band gap of graphene. Our core level data (C 1s and Cs 4d) combined with STM images consistently show that the charge asymmetry among carbon atoms induced by Cs+ ions drives the band gap opening in graphene. Our DFT calculations adopting a capacitor model to simulate the Cs+-doped graphene indeed show that the reduced interlayer distance, d, between graphene and the buffer layer, which is equivalent to the increased sublattice asymmetry, opens a band gap at the K-point up to Eg = 0.112 eV for Δd = 0.5 Å. Therefore, this simple capacitor model explains most of the prominent changes in the π-band as well as in the core levels induced by the doped Cs+ ions and neutral Cs atoms, including the opening and fine-tuning the size of a band gap in graphene. We thus present a reliable and practical means of engineering the band gap of graphene, which should play a pivotal role in advancing graphene-based nano-electronic technology.
Acknowledgements
This study was supported by the National Research Foundation of Korea (NRF) grant funded by the Korea Government (NRF-2015R1A5A1009962), by the Ministry of Science, ICT and Future Planning (NRF-2013R1A1A2005598), and also by the Ministry of Education (2014R1A1A2054592). Jhi acknowledges support of the SRC Center for Topological Matter (2011-0030789) and the LG Yonam Culture Foundation.
References
- K. S. Novoselov, A. K. Geim, S. V. Morozov, D. Jiang, Y. Zhang, S. V. Dubonos, I. V. Grigorieva and A. A. Firsov, Science, 2004, 306, 666 CrossRef CAS PubMed.
- K. S. Novoselov, A. K. Geim, S. V. Morozov, D. Jiang, M. I. Katsnelson, I. V. Grigorieva, S. V. Dubonos and A. A. Firsov, Nature, 2005, 438, 197 CrossRef CAS PubMed.
- Y. Zhang, Y. W. Tan, H. L. Stormer and P. Kim, Nature, 2005, 438, 201 CrossRef CAS PubMed.
- A. K. Geim and K. S. Novoselov, Nat. Mater., 2007, 6, 183 CrossRef CAS PubMed.
- E. J. Duplock, M. Scheffler and P. J. D. Lindan, Phys. Rev. Lett., 2004, 92, 225502 CrossRef PubMed.
- Y. W. Son, M. L. Cohen and S. G. Louie, Phys. Rev. Lett., 2006, 97, 216803 CrossRef PubMed.
- X. Liang, Z. Fu and S. Y. Chou, Nano Lett., 2007, 7, 3840 CrossRef CAS.
- Y.-M. Lin, C. Dimitrakopoulos, K. A. Jenkins, D. B. Farmer, H.-Y. Chiu, A. Grill and P. Avouris, Science, 2010, 327, 662 CrossRef CAS PubMed.
- F. Xia, D. B. Farmer, Y.-M. Lin and P. Avouris, Nano Lett., 2010, 10, 715 CrossRef CAS PubMed.
- C. Berger, Z. Song, X. Li, X. Wu, N. Brown, C. Naud, D. Mayou, T. Li, J. Hass, A. N. Marchenkov, E. H. Conrad, P. N. First and W. A. de Heer, Science, 2006, 312, 1191 CrossRef CAS PubMed.
- M. Y. Han, B. Özyilmaz, Y. Zhang and P. Kim, Phys. Rev. Lett., 2007, 98, 206805 CrossRef PubMed.
- T. Ohta, A. Bostwick, T. Seyller, K. Horn and E. Rotenberg, Science, 2006, 313, 951 CrossRef CAS PubMed.
- Y. Zhang, T. Tang, C. Girit, Z. Hao, M. Martin, A. Zettle, M. F. Crommie, Y. Shen and F. Wang, Nature, 2009, 459, 820 CrossRef CAS PubMed.
- S. Niyogi, E. Bekyarova, M. E. Itkis, H. Zhang, K. Shepperd, J. Hicks, M. Sprinkle, C. Berger, C. N. Lau, W. A. de Heer, E. H. Conrad and R. C. Haddon, Nano Lett., 2010, 10, 4061–4066 CrossRef CAS PubMed.
- A. J. Grüneis, J. Phys.: Condens. Matter, 2013, 25, 043001 CrossRef PubMed.
- R. Balog, B. Jørgensen, L. Nilsson, M. Andersen, E. Rienks, M. Bianchi, M. Fanetti, E. Lægsgaard, A. Baraldi, S. Lizzit, Z. Sljivancanin, F. Besenbacher, B. Hammer, T. Pedersen, P. Hofmann and L. Hornekær, Nat. Mater., 2010, 9, 315 CrossRef CAS PubMed.
- J. Berashevich and T. Chakraborty, Phys. Rev. B: Condens. Matter Mater. Phys., 2009, 80, 033404 CrossRef.
- C. Coletti, C. Riedl, D. S. Lee, B. Krauss, L. Patthey, K. von Klitzing, J. H. Smet and U. Starke, Phys. Rev. B: Condens. Matter Mater. Phys., 2010, 81, 235401 CrossRef.
- D. C. Elias, R. R. Nair, T. M. G. Mohiuddin, S. V. Morozov, P. Blake, M. P. Halsall, A. C. Ferrari, D. W. Boukhvalov, M. I. Katsnelson, A. K. Geim and K. S. Novoselov, Science, 2009, 323, 610 CrossRef CAS PubMed.
- M. Jaiswal, C. H. Y. X. Lim, Q. Bao, C. T. Toh, K. P. Loh and B. Özyilmaz, ACS Nano, 2011, 5, 888 CrossRef CAS PubMed.
- S. J. Sung, P. R. Lee, J. G. Kim, M. T. Ryu, H. M. Park and J. W. Chung, Appl. Phys. Lett., 2014, 105, 081605 CrossRef.
- N. Li, G. Lee, J. W. Yang, H. Kim, M. S. Yeom, R. H. Scheicher, J.-S. Kim and K.-S. Kim, J. Phys. Chem. C, 2013, 117, 4309 CAS.
- S. Y. Zhou, G.-H. Gweon, A. V. Fedorov, P. N. First, W. A. de Heer, D.-H. Lee, F. Guinea, A. H. Castro Neto and A. Lanzara, Nat. Mater., 2007, 6, 770 CrossRef CAS PubMed.
- H. Jee, K. H. Jin, J. H. Han, H. N. Hwang, S. H. Jhi, Y. D. Kim and C. C. Hwang, Phys. Rev. B: Condens. Matter Mater. Phys., 2011, 84, 075457 CrossRef.
- M. Papagno, S. Rusponi, P. M. Sheverdyaeva, S. Vlaic, M. Etzkorn, D. Pacilé, P. Moras, C. Carbone and H. Brune, ACS Nano, 2012, 6, 199 CrossRef CAS PubMed.
- C. Jeon, H. Shin, I. Song, M. Kim, J. Park, J. Nam, D. Oh, S. Woo, C. C. Hwang, C.-Y. Park and J. R. Ahn, Sci. Rep., 2013, 3, 2725 Search PubMed.
- A. Bostwick, F. Speck, T. Seyller, K. Horn, M. Polini, R. Asgari, A. H. MacDonald and E. Rotenberg, Science, 2010, 328, 999 CrossRef CAS PubMed.
- S. Watcharinyanon, C. Virojanadara and L. I. Johansson, Surf. Sci., 2011, 605, 1918 CrossRef CAS.
- M. Petrović, I. Šrut Rakić, S. Runte, C. Busse, J. T. Sadowski, P. Lazić, I. Pletikosić, Z.-H. Pan, M. Milun, P. Pervan, N. Atodiresei, R. Brako, D. Šokčević, T. Valla, T. Michely and M. Kralj, Nat. Commun., 2013, 4, 2772 Search PubMed.
- F. Varchon, R. Feng, J. Hass, X. Li, B. Ngoc Nguyen, C. Naud, P. Mallet, J.-Y. Veuillen, C. Berger, E. H. Conrad and L. Magaud, Phys. Rev. Lett., 2007, 99, 126805 CrossRef CAS PubMed.
- G. Henkelman, A. Arnaldsson and H. Jónsson, Comput. Mater. Sci., 2006, 36, 354 CrossRef.
- S. Kim, J. Ihm, H. J. Choi and Y. W. Son, Phys. Rev. Lett., 2008, 100, 176802 CrossRef PubMed.
- K. V. Emtsev, F. Speck, T. Seyller, L. Ley and J. D. Riley, Phys. Rev. B: Condens. Matter Mater. Phys., 2008, 77, 155303 CrossRef.
- D. S. Lin, T. Miller and T.-C. Chiang, Phys. Rev. B: Condens. Matter Mater. Phys., 1991, 44, 10719 CrossRef CAS.
- K. T. Chan, J. B. Neaton and M. L. Cohen, Phys. Rev. B: Condens. Matter Mater. Phys., 2008, 77, 235430 CrossRef.
- G. Profeta, M. Calandra and F. Mauri, Nat. Phys., 2012, 8, 131 CrossRef CAS.
- K. H. Jin, S. M. Choi and S. H. Jhi, Phys. Rev. B: Condens. Matter Mater. Phys., 2010, 82, 033414 CrossRef.
- J. Chen, T. Shi, T. Cai, T. Xu, L. Sun, X. Wu and D. Yu, Appl. Phys. Lett., 2013, 102, 103107 CrossRef.
- J.-Y. Veuillen, F. Hiebel, L. Magaud, P. Mallet and F. J. Varchon, J. Phys. D: Appl. Phys., 2010, 43, 374008 CrossRef.
- C.-L. Song, B. Sun, Y. Wang, Y. Jiang, L. Wang, K. He, X. Chen, P. Zhang, X. C. Ma and Q. K. Xue, Phys. Rev. Lett., 2012, 108, 156803 CrossRef PubMed.
- G. M. Rutter, J. N. Crain, N. P. Guisinger, T. Li, P. N. First and J. A. Stroscio, Science, 2007, 317, 219 CrossRef CAS PubMed.
- S. Y. Shin, C. G. Hwang, S. J. Sung, N. Kim, H. S. Kim and J. W. Chung, Phys. Rev. B: Condens. Matter Mater. Phys., 2011, 83, 161403 CrossRef.
- S. J. Sung, J. W. Yang, P. R. Lee, J. G. Kim, M. T. Ryu, H. M. Park, G. Lee, C. C. Hwang, K.-S. Kim, J.-S. Kim and J. W. Chung, Nanoscale, 2014, 6, 3824 RSC.
- G. Kresse and J. Furthmüller, Phys. Rev. B: Condens. Matter Mater. Phys., 1996, 54, 11169 CrossRef CAS.
- G. Kresse and D. Joubert, Phys. Rev. B: Condens. Matter Mater. Phys., 1999, 59, 11 Search PubMed.
- J. P. Perdew, K. Burke and M. Ernzerhof, Phys. Rev. Lett., 1996, 77, 3865 CrossRef CAS PubMed.
- A. Tkatchenko and M. Scheffler, Phys. Rev. Lett., 2009, 102, 073005 CrossRef PubMed.
Footnote |
| † Electronic supplementary information (ESI) available. See DOI: 10.1039/c5ra24482j |
|
| This journal is © The Royal Society of Chemistry 2016 |
Click here to see how this site uses Cookies. View our privacy policy here.