Magnetic and magnetocaloric properties of iron substituted holmium chromite and dysprosium chromite

Shiqi Yina, Vinit Sharmab, Austin McDannaldc, Fernando A. Reboredob and Menka Jain*ad
aDepartment of Physics, University of Connecticut, Storrs, CT 06269, USA. E-mail: menka.jain@uconn.edu
bMaterials Theory Group, Materials Science & Technology Division, Oak Ridge National Laboratory, Oak Ridge, TN 37831, USA
cMaterials Science and Engineering Department, University of Connecticut, Storrs, CT 06269, USA
dInstitute of Materials Science, University of Connecticut, Storrs, CT 06269, USA

Received 17th November 2015 , Accepted 7th January 2016

First published on 11th January 2016


Abstract

In this work, HoCrO3 and Fe substituted HoCrO3 and DyCrO3 (i.e. HoCr0.7Fe0.3O3 and DyCr0.7Fe0.3O3) powder samples were synthesized via a solution route. The structural properties of the samples were examined by Raman spectroscopy and X-ray diffraction techniques, which were further confirmed using the first-principle calculations. The dc magnetic measurements indicate that the Cr3+ ordering temperatures for the HoCrO3, HoCr0.7Fe0.3O3, and DyCr0.7Fe0.3O3 samples were 140 K, 174 K, and 160 K, respectively. The ac magnetic measurements not only confirmed the Cr3+ ordering transitions in these samples (obtained using dc magnetic measurements), but also clearly showed the Ho3+ ordering at ∼10 K in the present HoCrO3 and HoCr0.7Fe0.3O3 samples, which to our knowledge, is the first ac magnetic evidence of Ho3+ ordering in this system. The effective magnetic moments were determined to be 11.67μB, 11.30μB, and 11.27μB for the HoCrO3, HoCr0.7Fe0.3O3, and DyCr0.7Fe0.3O3 samples, respectively. For the first time, the magnetocaloric properties of HoCrO3 and HoCr0.7Fe0.3O3 were studied here, showing their potential for applications in magnetic refrigeration. In an applied dc magnetic field of 7 T, the maximum values of magnetic entropy change were determined to be 7.2 (at 20 K), 6.83 (at 20 K), and 13.08 J kg−1 K−1 (at 5 K) and the relative cooling power were 408, 387, and 500 J kg−1 for the HoCrO3, HoCr0.7Fe0.3O3, and DyCr0.7Fe0.3O3 samples, respectively.

1. Introduction

Magnetocaloric effect (MCE) is a magneto-thermal phenomenon in which the temperature of a material changes when it is exposed to a changing magnetic field adiabatically.1–5 MCE is the basis of magnetic refrigeration (MR), a technology promising to replace traditional gas compression refrigeration, because it is safer, more efficient, compact, and environmentally friendly.2,6,7 A candidate for magnetic refrigerant should have large magnetic entropy change ΔSM(T, H) and large relative cooling power (RCP).8 It should be noted that the MCE values of a material are related to the magnetic moment of metal ions in the material and large MCE value is usually obtained around the magnetic ordering temperature of the metal ion.8 Rare-earths, such as Gd, Ho, Tb, and Dy have large magnetic moments.9 For the above mentioned reasons, MCE has been widely studied in Gd alloys for room temperature applications and MR technology based on those are becoming commercially available.8 Additionally, the ordering temperature of rare-earth ions in oxides based on rare-earths is low (below 20 K),10–13 and therefore they have been widely studied for MR at low temperature (below 80 K),10,14–17 which is an promising alternative approach for current low temperature cooling technology dominated by the expensive and nonrenewable liquid helium refrigeration.15,18 Among the oxide materials, the magnetoelectric multiferroic (ME MF) rare-earth manganites RMnO3 (R stands for rare-earth ions) have recently been investigated for their MCE properties. For example, at the magnetic field of 5 T, TbMnO3 bulk powder was reported to have large RCP ∼103 J kg−1 and MCE values ∼6.75 J kg−1 K−1 at 16 K.14 From the report of Shao et al., HoMnO3 bulk powder showed large RCP ∼312 J kg−1 and MCE values ∼12.5 J kg−1 K−1 at 16 K and a magnetic field of 7 T.19

Recently, another ME MF oxide system based on rare-earths, rare-earth chromite (RCrO3), has been explored for its MCE properties and suitability for MR. For example, in DyCrO3 (DCO), large MCE value of 8.4 J kg−1 K−1 and relative cooling power of 217 J kg−1 at 15 K and 4 T was first reported, which was attributed to the low-temperature ordering of Dy3+ at ∼2.16 K.15,20 This renders DCO useful for MR in the temperature range from 5 K to 30 K. These RCrO3 materials stabilize in orthorhombically distorted perovskite structure in which the exchange coupling between the Cr3+ nearest neighbors is predominantly antiferromagnetic (G-type) and these ions order magnetically at a Néel temperature (TCrN) from 113 to 140 K depending upon the R-ion.21 Additionally, RCrO3 systems are of great interest as these exhibit spin-reorientation, rare-earth ordering,22 metamagnetic transition, or temperature induced magnetization reversal in some cases at low temperatures (<50 K).23,24 In a similar system – rare-earth ferrite, for example, DyFeO3, the Dy3+ ordering has been reported to occur at 4.5 K17,25 and a giant entropy change at 5 K (around Dy3+ ordering) was reported to be 16.62 J kg−1 K−1 under field change of 2 T.10 Among the rare-earth ions, Ho3+ has the second highest magnetic moment after Dy3+ (10.4μB for Ho3+ as compared to 10.6μB for Dy3+).9 In HoFeO3 bulk powder, Ho3+ ordering has been reported to occur at 3.3 K or at 6.5 K,12,26 while in HoFeO3 single crystal, Ho3+ ordering was reported at 4.1 K and a spin reorientation was reported ∼50–60 K; so, large MCE value of 19.2 J kg−1 K−1 was obtained at the Ho3+ ordering temperature.27 Yin et al. reported Dy3+ ordering temperature at 14 K in DyCr0.5Fe0.5O3 and the maximum MCE value was improved to 10.5 J kg−1 K−1 at 5 K and 4 T.16 From above discussion, it is clear that HoCrO3 (HCO) is likely to show large MCE values in slightly higher temperature range than DCO due to slightly higher Ho3+ ordering temperature. Further, by Fe3+ substitution at the Cr-site, the ordering temperature of Ho3+ is expected to increase and correspondingly its MCE value may maximize at a higher temperature compared to that in pure HCO, rendering it applicable for magnetic refrigeration in slightly higher temperature range than those for DCO. As in RMnO3 system, Cr–O–Cr bond angle in RCrO3 system would play an important role in its magnetic properties (and hence MCE properties) that would be modified with either R-site or Cr-site substitutions.28,29 Therefore, in order to understand the structure–property correlations, it is of great importance to utilize first-principle to calculate the lattice parameters of the stable structure and density of states (DOS) complementary to the experimental work.

In the present work, the structural, magnetic (ac and dc), and MCE properties of the HCO, HoCr0.7Fe0.3O3, and DyCr0.7Fe0.3O3 bulk powder samples have been examined. In addition, the lattice distortions and density of states are studied using the first principle calculations based on density functional theory (DFT), which can provide crucial information that can lead to the design of materials with enhanced MCE properties. To our knowledge, this is the first work on the exploration of ac magnetic properties and MCE properties of HCO and Fe-substituted HCO system. Also, RCP value of Fe substituted DCO is reported for the first time in addition to the density of state calculations in the RCrO3 system. Given that experimental study of such complex systems is not only time consuming and costly but also require sophisticated experimental techniques. A combined experimental and first-principles computational methods based study is capable to provide crucial insights about the physicochemical properties resultant form defects/impurities that complements experiments. To our knowledge, this is the first combined experimental and computational attempt to explore ac magnetic properties, MCE properties and electronic structure of HCO and Fe-substituted HCO, which can potentially enhance the efforts towards synthesis and design of new ME MF materials.

2. Experimental and computational details

The HoCrO3 (HCO), HoCr0.7Fe0.3O3 (HCFO), and DyCr0.7Fe0.3O3 (DCFO) bulk powder samples were synthesized via citrate solution route. High-purity Dy(NO3)3, Ho(NO3)3, Cr(NO3)3, and Fe(NO3)3 precursors were first dissolved in water in stoichiometric ratio and then mixed together. After addition of citric acid, the solutions were heated and dried. The powder thus obtained was ground in a mortar and then annealed at 900 °C in oxygen for 2 hours. To determine the structure of the samples, the room-temperature X-ray diffraction (XRD) patterns were measured by Bruker D8 X-ray diffractometer using Cu-Kα radiation (λ = 1.5402 Å). The scan speed was 2° per minute with a step of 0.02° in the range of 20° < 2θ < 90°. Rietveld refinement was carried out with Fullprof Suite software. The purity of the samples was further confirmed by room temperature Raman scattering measurements using an Ar-ion laser (Renishaw System 2000) with a wavelength of 514 nm. The surface morphology of the powder samples were detected by the field-emission scanning electron microscope (FESEM). The dc magnetic property was measured using the Vibrating Sample Magnetometer attached to the Evercool physical property measurement system (PPMS, from Quantum Design). For the magnetization vs. field (M vs. H) measurements, the samples were first zero field cooled to 5 K. The M vs. H data was measured with the field from 0 to 7 T and back to 0 T. The magnetic field was then set to 2 T and oscillated to back to zero field followed by increment of temperature by 5 K for the next M vs. H measurements. This procedure was repeated until the sample temperature was above the Néel temperature of the material. The frequency dependence (100, 500, and 1000 Hz) of ac susceptibility were measured in the temperature range of 5–300 K using the ac susceptibility option attached to the PPMS.

In order to further understand the crystal and magnetic structure, DFT based spin-polarized first-principles calculations are performed using the projector augmented wave method as implemented in the Vienna ab initio simulation package.30–32 In present calculations, the exchange correlation interaction is treated within the generalized gradient approximation (GGA) using the Perdew–Burke–Ernzerhof (PBE) functional.33 The electronic wave functions were expanded in a plane wave basis with a cut off energy of 500 eV. It is noteworthy that due to the errors associated with the on-site Coulomb and exchange interactions,34 DFT based methods are known to fail to reproduce an accurate description of the electronic structure for strongly correlated systems such as transition metal oxides35–37 and rare-earth compounds.28 In such cases, the accuracy of DFT can be improved by incorporating a Hubbard-model-type correction (U), which accounts for localized d and f orbitals. Hence, in the present work to describe the localized nature of the f states, in all the calculations U values ∼3.7 eV and 3.9 eV are used for Ho and Dy, respectively.28,38,39 A Monkhorst–Pack k-point mesh of 5 × 5 × 4 is employed to produce converged results within 0.1 meV per formula unit. In doped cases, one Cr atom was substituted with dopants Fe. It should be mentioned that 25 at% was chosen for Fe concentration in DFT calculations not only to be close to experimental results but also to keep a reasonable super cell size. We expect the trend in physical properties of 25 at% doped samples to be similar as for 30 at% doped samples.

3. Results and discussion

Fig. 1(a), (c), and (d) show the XRD patterns and corresponding Rietveld refinements of the HCO, HCFO, and DCFO samples, respectively. The difference between the refinement model and experimental data (also plotted in figure) is minimal, indicating that the samples are phase-pure and stabilize in a distorted orthorhombic perovskite structure with the space group Pbnm, as shown schematically in Fig. 1(b). The Fig. 1(b) shows the corner shared CrO6 octahedra and the Cr ions in the center of the octahedral. The DFT obtained XRD data is also plotted in the figure. The a, b, and c lattice parameters obtained from the Rietveld refinement model and the DFT (PBE+U) calculations are close to the ones reported for pure HCO and DCO22,40,41 and are in good agreement with each other, as summarized in Table 1. The lattice parameters for HCFO were found to be larger than those of HCO, which can be explained by the difference in the ionic size of Fe3+ and Cr3+ (Table 2). In Fe doped samples, both Fe3+ and Cr3+ have a coordination number of 6. The magnetic moment (μ), ionic radii (r, from Shannon's ionic radii database),42 and atomic mass (u) of Ho3+, Dy3+, Fe3+ and Cr3+ are summarized in Table 2. The ionic radii of Fe3+ is slightly larger (0.645 Å, for high spin state) than that of Cr3+ (0.615 Å). Thus, substitution of slightly bigger ion (Fe3+) in the lattice would account for the increased lattice parameters of HCFO as compared to HCO. Further, the lattice parameter of DCFO was slightly larger than that of HCFO because of the larger ionic radii of Dy3+ (1.083 Å) as compared to that of Ho3+ (1.072 Å).
image file: c5ra24323h-f1.tif
Fig. 1 The θ–2θ X-ray diffraction data (experimental and that obtained by DFT) and the Rietveld refinement of (a) holmium chromite (HCO), (c) 30% iron substituted holmium chromite (HCFO), and (d) 30% iron substituted dysprosium chromite (DCFO) samples. (b) Schematic of the crystal structure of perovskite RCrO3 consists of CrO6 octahedra where the Cr ions are in the center. Blue, pink, and cyan spheres stand for the Fe, Ho/Dy, and Cr atoms, respectively. The oxygen atoms are at the edge of octahedra and not shown here.
Table 1 Lattice parameters obtained from DFT (PBE+U) and Rietveld refinement of the experimental XRD data (EXP) along with the crystallite size/strain calculated using Williamson–Hall analysis for HoCrO3 (HCO), HoCr0.7Fe0.3O3 (HCFO), and DyCr0.7Fe0.3O3 (DCFO) samples
Parameter HCO HCFO DCFO
a (Å) DFT (PBE+U) 5.269 5.247 5.229
EXP 5.248 5.259 5.280
b (Å) DFT (PBE+U) 5.543 5.600 5.5808
EXP 5.525 5.540 5.536
c (Å) DFT (PBE+U) 7.585 7.567 7.555
EXP 7.545 7.564 7.577
V3) DFT (PBE+U) 221.52 222.37 220.50
EXP 218.79 220.40 221.48
Crystallite size (nm) 104.1 ± 13.3 142.9 ± 26.1 119.1 ± 14.7
Strain (6.8 ± 3.5) × 10−4 (17.0 ± 3.6) × 10−4 (10.3 ± 3.3) × 10−4


Table 2 The values of magnetic moment (μ), ionic radii (r), and atomic mass (m) of the Ho3+, Dy3+, Fe3+, and Cr3+ ions
  Ho3+ Dy3+ Fe3+ Cr3+ (spin only) Ref.
μ (μB) 10.4 10.6 5.9 3.8 9
r (Å) 1.072 1.083 0.645 0.615 42
m (u) 164.9 162.5 55.85 52.00 43


The crystallite size and strain of the present powder samples were estimated using Williamson–Hall (W–H) analysis, expressed by the formula:44

 
image file: c5ra24323h-t1.tif(1)
where β is full width at half maximum (FWHM) of the diffraction peak, θ is the Bragg angle, Cε is the strain, K ≈ 0.89 is a constant, λ is the wavelength of the X-ray beam, and L is the crystallite size. From the XRD data, β was obtained by Pearson 7 peak fit using the Fityk software. The values of L and Cε were then calculated and summarized in Table 1. The crystallite sizes of the present powder samples are around 90–170 nm, which are slightly bigger than those reported for GdCrO3 nano particles (∼50 nm) synthesized by hydrothermal method45,46 and DCO nano-platelets (∼50–90 nm) synthesized by hydrolytic sol–gel method.41 It should be noted that the strain in the samples are <1%, indicating that distribution of defects from the present synthesis route is minimal.47 The uncertainty here is obtained from mean-squared-error (MSE) between the experimental data and model. The microstructures of the samples as examined by the FESEM are shown in Fig. 2. The images do not show any obvious presence of impurity and the particles appear to be of uniform sizes for all the present samples. It is clear from the figure that the average particle size of HCFO (Fig. 2(a)) is slightly larger than those of HCO and DCFO (Fig. 2(b) and (c)). This is in agreement with the result presented in Table 1 obtained from W–H analysis.


image file: c5ra24323h-f2.tif
Fig. 2 Scanning electron microscopy images of the (a) holmium chromite (HCO), (b) 30% iron substituted holmium chromite (HCFO), and (c) 30% iron substituted dysprosium chromite (DCFO) samples.

Complementary to XRD, Raman spectra provides useful data of the phonon spectra and structural distortion of RCrO3.48 The room temperature Raman spectra of the three samples are shown in Fig. 3. RCrO3 with orthorhombic Pbnm structure possess 24 Raman active modes (7Ag + 5B1g + 7B2g + 5B3g).16,48 In Fig. 3, the mode assignments were done following the work by McDannald et al. and Yin et al.15,16 It should be noted that all the observed peaks in Raman spectra of the present samples could be assigned for the RCrO3 system. Strong peaks at ∼693 cm−1, 676 cm−1, and 676 cm−1 were observed for HCO, HCFO, and DCFO, respectively and were not reported in most cases for RCrO3, which are attributed to the antisymmetric stretching of FeO6 or CrO6 octahedra in RCrO3.16 Raman peaks are sensitive to impurities and structure of the material. In the present samples, no extra peaks of impurities (such as Fe2O3, Cr2O3, or Fe3O4, etc.) were observed in the Raman spectra. Thus, it is concluded that the present samples are phase pure, further corroborating the XRD results.


image file: c5ra24323h-f3.tif
Fig. 3 Room temperature Raman spectra of (a) holmium chromite (HCO), (b) 30% iron substituted holmium chromite (HCFO), and (c) 30% iron substituted dysprosium chromite (DCFO) samples. There is a break from 584 to 590 cm−1, because for (b), (c) the B2g(4) B3g(4) peak is much stronger than other peaks and the curve in the range of 100–584 cm−1 was amplified by nine times for clarity.

In order to investigate the interaction of orbital and magnetic ordering, we examine the electronic structure of the present samples by analyzing the density of states (DOS). Computed total and atom projected DOS of the pure and doped HCO (or DCO) samples are plotted in Fig. 4, where Fermi level is aligned to zero for convenience. As it can be seen in Fig. 4(a) and (b), both pure HCO and pure DCO are found to be insulator with energy gap of about 3.1 eV and 2.7 eV, respectively. It should be noted that the DFT calculated band gap here is close to the recently reported experimentally obtained energy-gap values for HCO (3.26 eV)49 and DCO (2.8 eV).50 The small difference between experimental and computed band-gap values is due to the well-known deficiency of conventional DFT methods in predicting band-gaps. Fig. 4 also clearly suggests that: (i) the valence band of the total DOS has contributions from both rare-earth and transition metal elements and (ii) in the valence band, the majority of the DOS in the vicinity of the Fermi-level arises from the d-states of the Cr/Fe atoms. The notable point is that the in valence band, highest occupied level shows O 2p character, while in conduction band the lowest unoccupied level has Cr 3d character. While the DOS in the conduction band can be explained in terms of optical conductivity spectra where the first peak mainly an attribute of the first optical transition as observed in the earlier optical conductivity spectra measurements.50 Furthermore, in the conduction band the DOS have contributions from both Cr and O atoms but mainly dominated by Cr (3d) orbitals. On the other hand in Fe doped HCO/DCO, the DOS in the vicinity of the Fermi-level are largely contributed by Fe, which result into a shift in valence band maximum. This shift can be explained on the basis of the hybridization of d-orbitals of Fe and Cr with p-orbitals of oxygen in the valance band.28 The O (2p) states and Cr/Fe (3d) states further enhance the strong hybridization between the orbital and spin order resulting in the magnetic and structural modulations, consistent with the Jahn–Teller mechanism.28


image file: c5ra24323h-f4.tif
Fig. 4 Calculated total and atom projected DOS of (a) holmium chromite (HCO), (b) dysprosium chromite (DCO), (c) 30% iron substituted holmium chromite (HCFO), and (d) 30% iron substituted dysprosium chromite (DCFO) samples. In each case, both up and down arrows represents the up and down spin contributions to the DOS, respectively. The Fermi level is aligned to zero here.

The temperature dependence of the dc magnetization (mass) with an applied magnetic field (H) of 50 Oe measured in both zero-field cooled (ZFC) and field cooled (FC) mode are exhibited in Fig. 5. The Néel temperature (Cr3+ ordering temperature, TCrN) was observed at 140 K, 174 K, and 160 K for HCO, HCFO and DCFO samples, respectively. As it can be seen that the TCrN of HCFO and DCFO were higher than those of pure HCO and DCO, respectively,15 which is attributed to the effect of Fe substitution. It is worth noting that the present DCFO sample shows a lower TCrN than 261 K reported recently for DyCr0.5Fe0.5O3.16 This indicates that the TCrN is tunable in DyCr1−xFexO3 (similarly for HoCr1−xFexO3) solid-solution by controlling the Cr3+/Fe3+ ratio. In addition to the Néel temperature, another transition at 10 K was observed for DCFO, which can be attributed to the ordering of Dy3+.16 However, HCO or HCFO samples did not show the Ho3+ ordering in the temperature dependent dc magnetic data. The magnetization (M) for the present HCO sample (max ∼ 30 emu g−1) is consistent with that reported by Tiwari et al.,40 but higher than the present HCFO sample (max ∼ 21 emu g−1). It should be noted that Shao et al. reported that in HoFeO3 single crystal, the maximum magnetization value was ∼4.5 emu g−1 at 100 Oe, which is much lower than that of HCO.27 Thus, the reduction in magnetization of the present HCFO samples could be due to the iron substitution. The magnetization value of DCFO was in good agreement with the report of 50% Fe substituted DCO and the magnetic susceptibility of both are ∼0.02 emu (g Oe)−1 {calculated using χ = M/H, where M is the magnetization (mass) and H is the applied magnetic field}.16 However, the maximum magnetization of the present DCFO is much smaller than those of HCFO or HCO samples because of the ordering of Dy3+ ions (see Fig. 5(c)).


image file: c5ra24323h-f5.tif
Fig. 5 The temperature dependent zero-field cooled (open symbols) and field cooled (closed symbols) dc magnetization (M) data of (a) holmium chromite (HCO), (b) 30% iron substituted holmium chromite (HCFO), and (c) 30% iron substituted dysprosium chromite (DCFO) samples measured at an applied field of 50 Oe.

The dc susceptibility data in the FC mode of the samples was fitted by the Curie–Weiss law (χ = C/(Tθ)) in the paramagnetic region (above TCrN), as shown in Fig. 6(a–c). Curie constant (C) and Weiss temperature (θ) were obtained for each sample and presented in Table 3. The effective magnetic moment (μeff) was then calculated from C values using:9

 
image file: c5ra24323h-t2.tif(2)
where kB is Boltzmann constant, N is Avogadro constant. The magnetic moment can also be calculated theoretically by using the free ionic moments:
 
image file: c5ra24323h-t3.tif(3)
where μR, μCr, and μFe are the free ionic moments of Ho3+/Dy3+, Cr3+, and Fe3+ respectively, and x is the Fe substitution fraction. These results for all the present samples were also summarized in Table 3. The effective magnetic moment obtained from the Curie–Weiss fit and the values of μeff as calculated above were found to be in good agreement with each other.


image file: c5ra24323h-f6.tif
Fig. 6 The open circles show the inverse of the field-cooled dc susceptibility data as a function of temperature and the solid line shows the Curie–Weiss fit to the paramagnetic data of (a) holmium chromite (HCO), (b) 30% iron substituted holmium chromite (HCFO), and (c) 30% iron substituted dysprosium chromite (DCFO) samples.
Table 3 The Néel temperature {TCrN (K)}, the Weiss temperature θ (K), Curie constant C (emu K (Oe−1 mol−1)), and effective magnetic moment μeff (μB), obtained by Curie–Weiss fit of the dc susceptibility data. The value of μeff is calculated by using free ionic moments (see Table 2 and eqn (3))
Sample HCO HCFO DCFO
TCrN (K) 140 174 160
θ (K) −36.47 ± 0.60 −15.31 ± 3.03 −25.71 ± 2.12
C (emu K (Oe−1 mol−1)) 17.01 ± 0.04 15.96 ± 0.19 15.88 ± 0.14
μeff (μB) 11.66 ± 0.01 11.30 ± 0.07 11.27 ± 0.05
μeff (μB) 11.23 11.35 11.44


The temperature dependent ac susceptibility data (real part χ′, imaginary part χ′′ in Fig. 7) was measured with an applied ac magnetic field of 10 Oe and frequencies between 100 and 1000 Hz. Both the χ′(T) and χ′′(T) data revealed Cr3+ ordering temperatures at 140 K, 174 K, and 160 K for HCO, HCFO, and DCFO, respectively corroborating the dc magnetic results presented above. In addition, an ordering temperature at ∼10 K was observed for DCFO sample, indicative of the Dy3+ ordering as observed in the dc magnetic data. It should be noted that χ(T) data for HCFO (Fig. 7(a) and (b)) revealed anomaly ∼10 K, which was not observed in dc magnetic data or χ′′(T) data of the sample. This anomaly is indicative of Ho3+ ordering in the samples. To the best of our knowledge, the present data is the first ac magnetic data in literature showing ordering of the Ho3+ moments in pure or doped HCO.


image file: c5ra24323h-f7.tif
Fig. 7 The temperature dependent ac magnetic susceptibility data: real part χ′ (closed symbols and left y-axis) and imaginary part χ′′ (open symbols and right y-axis) of (a) holmium chromite (HCO), (b) 30% iron substituted holmium chromite (HCFO), and (c) 30% iron substituted dysprosium chromite (DCFO) samples measured at the 100 Hz, 500 Hz, and 1000 Hz. Inset of (c) shows the data in smaller temperature range for clarity.

In order to investigate the dependence of magnetic property on magnetic field, isothermal magnetization vs. magnetic field (M vs. H) curves were measured up to 4 T and 160 K, and representative data at 5 K, 50 K, 100 K, and 160 K are shown in Fig. 8. The magnetic behavior of all the samples changes from canted antiferromagnetic (AFM) at low temperature to paramagnetic at high temperature (above their respective TCrN), which can be interpreted as the superposition of three types of magnetic contributions: (i) the weak ferromagnetic contribution that can be attributed to the canting of the AFM order of the transition metals (Fe or Cr), (ii) the strong paramagnetic contribution from the rare-earth sublattice, and (iii) pure AFM contribution from the transition metal (Dy or Ho) sublattice. From the isothermal MH data of all the samples, the temperature dependence of the coercive magnetic field (Hc) and remnant magnetization (MR) values were obtained and plotted in Fig. 9. As the temperature increases, the coercive field increases initially and maintains at some level. Then it decreases slowly and becomes zero at ∼140 K, 160 K, and 170 K for HCO, HCFO, and DCFO near their TCrN, respectively. The Hc value of DCFO sample is much smaller than those of HCO and HCFO samples, indicating that DCFO has much smaller magnetic hysteresis. Comparatively, the MR (Fig. 9(b)) decreases monotonically with increasing temperature and reaches zero at ∼145 K for all the present samples. All of these features can be interpreted by the competition between the three aforementioned magnetic contributions. When the temperature is near TCrN, the strong paramagnetic signal plays the dominant role in the magnetic behavior, so the samples show no magnetic hysteresis and both Hc and MR are zero.


image file: c5ra24323h-f8.tif
Fig. 8 Isothermal magnetization vs. magnetic field data at 5 K, 50 K, 100 K, and 160 K for (a) holmium chromite (HCO), (b) 30% iron substituted holmium chromite (HCFO), and (c) 30% iron substituted dysprosium chromite (DCFO) samples.

image file: c5ra24323h-f9.tif
Fig. 9 The temperature dependent (a) coercive field (Hc) and (b) remnant magnetization (MR) of holmium chromite (HCO), 30% iron substituted holmium chromite (HCFO), and 30% iron substituted dysprosium chromite (DCFO) samples.

In order to further examine the figure of merit of these materials for the evaluation of their applications in MR, the present samples were also evaluated for their MCE behavior, which can be extracted from the isothermal MH curves exhibited in Fig. 10 (measured up to 7 T field and only in first quadrant as mentioned in Experimental section). The MCE properties can be characterized mainly by two factors: magnetic entropy change ΔSM(T, H) given by:8

 
image file: c5ra24323h-t4.tif(4)
and relative cooling power (RCP) usually calculated by:8
 
RCP = |ΔSmax| × ΔTFWHM, (5)
where ΔTFWHM is the full width at half maximum of the temperature dependent ΔSM data. Here we use the more accurate integration method to calculate RCP:20
 
RCP = −∫SM,H|dT (6)


image file: c5ra24323h-f10.tif
Fig. 10 Isothermal magnetization curves (in first quadrant) at many temperatures (5–155 K) for (a) holmium chromite (HCO), (b) 30% iron substituted holmium chromite (HCFO), and (c) 30% iron substituted dysprosium chromite (DCFO) samples.

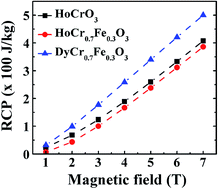
In Fig. 11, the MCE values (ΔSM(T, H)) were calculated and determined to be 7.2 J kg−1 K−1 at 20 K for HCO, 6.83 J kg−1 K−1 at 20 K for HCFO, and 13.08 J kg−1 K−1 at 5 K for DCFO at maximum under the magnetic field of 7 T. The MCE values of HCO and HCFO are reported for the first time here and the maximum values were smaller than those of DCO and DCFO.13,36 It is partly because larger magnetic hysteresis exists in HCO or HCFO than in DCO or DCFO (see Fig. 9) and thus more energy is lost in the thermal process, resulting in smaller MCE values. This is supported by the report of Phan et al., in which they propose nearly zero magnetic hysteresis as a criteria to select material for magnetic refrigerant because of energy efficiency.8 Also, the MCE value of HCFO (6.83 J kg−1 K−1) is slightly smaller than that of HCO (7.2 J kg−1 K−1), which indicates that Fe substitution decrease the MCE values in HCO. Conversely, the MCE value of DCFO (10.3 J kg−1 K−1), which is close to the report of DyCr0.5Fe0.5O3 (10.5 J kg−1 K−1),16 was larger than that of pure DCO (8.4 J kg−1 K−1) under the magnetic field of 4 T.15 Therefore, it was inferred that Fe substitution in DCO improves the MCE values. In Table 4, the MCE values, temperature (Tmax) and magnetic field (Hmax) where the maximum MCE values were obtained were summarized and compared to those reported in other references. Tmax is ∼20 K for both HCO and HCFO samples and ∼5 K for DCFO sample. Such difference in the temperature of maximum ΔSM value can be explained by the slightly higher ordering temperature of Ho3+ than that of Dy3+, as presented in Fig. 7. For HCO, another peak in ΔSM value, though much weaker, was observed at 140 K. It was attributed to the ordering of Cr3+, which has much smaller magnetic moment than Ho3+ (seen in Table 2). In Table 4, the MCE properties of the bulk samples were much smaller than HoFeO3 and DyFeO3 single crystals (19.2 and 16.62 J kg−1 K−1). Because the MCE properties of the single crystals were shown to be direction dependent (as measured in other cases),27 the bulk samples show only the average effect and smaller MCE values.


image file: c5ra24323h-f11.tif
Fig. 11 The temperature dependent entropy change (ΔS) in (a) holmium chromite (HCO), (b) 30% iron substituted holmium chromite (HCFO), and (c) 30% iron substituted dysprosium chromite (DCFO) samples. The field dependent relative cooling power (RCP) values of the three samples are also presented in (d).
Table 4 A comparison of the temperature (Tmax) and magnetic field (Hmax) where the maximum entropy change (ΔSM,max) and the relative cooling power (RCP) were obtained for some pure and Fe substituted rare-earth chromites, manganites, and single crystal ferrites
Material ΔSM,max (J kg−1 K−1) Tmax (K) Hmax (T) RCP (J kg−1) Reference
DyCrO3 8.4 15 4 217 15
DyCr0.5Fe0.5O3 10.5 5 4 16
DyCr0.7Fe0.3O3 13.08 5 7 500 This work
10.3 5 4 258
HoCrO3 7.2 20 7 408
4.2 20 4 189
HoCr0.7Fe0.3O3 6.83 20 7 387
3.74 15 4 167
HoMnO3 12.5 10 7 312 19
DyFeO3 (single crystal) 16.62 5 2 150 10
18.5 5 7 586
HoFeO3 (single crystal) 19.2 4.5 7 220 27


RCP values of the present samples were calculated and plotted in Fig. 11(d), and also are compared with references at two different fields (4 T and 7 T) in Table 4. At 7 T, the RCP value of HCO sample (408 J kg−1) is larger than those of the present HCFO (387 J kg−1) and previously reported HoMnO3 (312 J kg−1),19 but smaller than the present DCFO (500 J kg−1). Further, at the lower magnetic field of 4 T, DCFO sample shows larger RCP value (258 J kg−1) than that of previously reported DCO sample (217 J kg−1).15 It is worth noting that the RCP values of HCO, HCFO, and DCFO generally follow the same trend as their ΔSM (see Table 4), because RCP value is obtained by the integration of the ΔSM over temperature (see eqn (6)), and larger ΔSM is more likely to result in larger RCP value. However, RCP also depends on the width of the ΔSM versus temperature data and larger value of full width at half maximum is also more likely to result in larger RCP value. That explains why HCO bulk sample shows smaller entropy change than HoMnO3 bulk sample and HoFeO3 single crystal, but still larger RCP value (Table 4).

Interestingly, HCFO showed smaller MCE and RCP values than HCO, while DCFO showed larger MCE and RCP values than DCO, so the effect of Fe substitution on the MCE property of rare-earth chromites varies for different rare-earth ions. From Table 4, it is clear that HCO and HCFO samples show decent MCE and RCP values at slightly higher temperature (20 K) than that in DCO and HoMnO3 (<10 K). Thus, the HCO and HCFO samples are considered suitable for MR application in slightly higher temperature range (∼20 K).

4. Conclusions

In summary, HoCrO3, HoCr0.7Fe0.3O3 and DyCr0.7Fe0.3O3 powder samples were prepared by a solution route. From X-ray diffraction data, the crystal structure were determined to be orthorhombically distorted perovskite structure (space group Pbnm) and the experimentally obtained lattice parameters were confirmed with those calculated using density function theory. The density of state calculations show that band gap of DCO or HCO decreases with Fe substitution. The dc magnetic measurements show that the Cr3+ ordering temperature are at 140 K, 174 K, and 160 K for HoCrO3, HoCr0.7Fe0.3O3, and DyCr0.7Fe0.3O3 samples, respectively, which shows that Fe substitution increases the Cr3+ ordering temperature. The ac magnetic measurements for the first time reveal ordering temperature of Ho3+ moments at 10 K in HoCrO3 and HoCr0.7Fe0.3O3 samples. The isothermal magnetization data shows the change of magnetic behavior from canted antiferromagnetic at low temperature to paramagnetic at high temperature. These features were interpreted by the temperature dependent coercive field and remnant magnetization. For the first time, the magnetocaloric properties of HoCrO3 and HoCr0.7Fe0.3O3 were studied, showing their potential application for magnetic refrigeration. At 7 T field, the maximum change in entropy (ΔSM) values were determined to be 7.2, 6.83, and 13.08 J kg−1 K−1 for the HoCrO3, HoCr0.7Fe0.3O3, and DyCr0.7Fe0.3O3 samples, respectively. The relative cooling power were found to be 408, 387, and 500 J kg−1 for the HoCrO3, HoCr0.7Fe0.3O3, and DyCr0.7Fe0.3O3 samples, respectively.

Acknowledgements

This work was funded by the National Science Foundation grant DMR-1310149. Authors VS and FAR are supported by the Materials Sciences and Engineering Division of the Office of Basic Energy Sciences, U.S. Department of Energy.

References

  1. V. K. Pecharsky, A. P. Holm, K. A. Gschneidner and R. Rink, Phys. Rev. Lett., 2003, 91, 197204 CrossRef CAS PubMed.
  2. K. A. Gschneidner Jr, V. K. Pecharsky and A. O. Tsokol, Rep. Prog. Phys., 2005, 68, 1479–1539 CrossRef.
  3. N. S. Bingham, H. Wang, F. Qin, H. X. Peng, J. F. Sun, V. Franco, H. Srikanth and M. H. Phan, Appl. Phys. Lett., 2012, 101, 102407 CrossRef.
  4. V. Franco, Determination of the Magnetic Entropy Change from Magnetic Measurements: the Importance of the Measurement Protocol, Sevilla, Spain, 2014 Search PubMed.
  5. V. Basso, C. P. Sasso, K. P. Skokov, O. Gutfleisch and V. V. Khovaylo, Phys. Rev. B: Condens. Matter Mater. Phys., 2012, 85, 014430 CrossRef.
  6. T. Krenke, E. Duman, M. Acet, E. F. Wassermann, X. Moya, L. Mañosa and A. Planes, Nat. Mater., 2005, 4, 450–454 CrossRef CAS PubMed.
  7. S. Gama, A. Coelho, A. de Campos, A. Carvalho, F. Gandra, P. von Ranke and N. de Oliveira, Phys. Rev. Lett., 2004, 93, 237202 CrossRef PubMed.
  8. M. H. Phan and S. C. Yu, J. Magn. Magn. Mater., 2007, 308, 325–340 CrossRef CAS.
  9. J. M. D. Coey, Magnetism and Magnetic Materials, Cambridge University Press, Cambridge, 2009 Search PubMed.
  10. Y.-J. Ke, X.-Q. Zhang, H. Ge, Y. Ma and Z.-H. Cheng, Chin. Phys. B, 2015, 24, 037501 CrossRef.
  11. T. Yamaguchi and K. Tsushima, Phys. Rev. B: Condens. Matter Mater. Phys., 1973, 8, 5187–5198 CrossRef CAS.
  12. W. Koehler, E. Wollan and M. Wilkinson, Phys. Rev., 1960, 118, 58–70 CrossRef CAS.
  13. S. Rao Gv and R. Cnr, Appl. Spectrosc., 1970, 24, 436–444 CrossRef.
  14. M. Staruch, L. Kuna, A. McDannald and M. Jain, J. Magn. Magn. Mater., 2015, 377, 117–120 CrossRef CAS.
  15. A. McDannald, L. Kuna and M. Jain, J. Appl. Phys., 2013, 114, 113904 CrossRef.
  16. L. H. Yin, J. Yang, R. R. Zhang, J. M. Dai, W. H. Song and Y. P. Sun, Appl. Phys. Lett., 2014, 104, 032904 CrossRef.
  17. R. L. White, J. Appl. Phys., 1969, 40, 1061 CrossRef CAS.
  18. D. W. Hoch, Design and test of a 1.8 K liquid helium refrigerator, University Of Wisconsin-Madison, 2004 Search PubMed.
  19. M. Shao, S. Cao, S. Yuan, J. Shang, B. Kang, B. Lu and J. Zhang, Appl. Phys. Lett., 2012, 100, 222404 CrossRef.
  20. A. McDannald and M. Jain, J. Appl. Phys., 2015, 118, 043904 CrossRef.
  21. J. R. Sahu, C. R. Serrao, N. Ray, U. V. Waghmare and C. N. R. Rao, J. Mater. Chem., 2007, 17, 42 RSC.
  22. A. McDannald, L. Kuna, M. S. Seehra and M. Jain, Phys. Rev. B: Condens. Matter Mater. Phys., 2015, 91, 224415 CrossRef.
  23. K. Yoshii, J. Solid State Chem., 2001, 159, 204–208 CrossRef CAS.
  24. Y. Su, J. Zhang, Z. Feng, L. Li, B. Li, Y. Zhou, Z. Chen and S. Cao, J. Appl. Phys., 2010, 108, 013905 CrossRef.
  25. E. F. Bertaut and J. Mareschal, J. Phys., 1968, 29, 67–73 CAS.
  26. A. Bhattacharjee, K. Saito and M. Sorai, J. Phys. Chem. Solids, 2002, 63, 569–574 CrossRef CAS.
  27. M. Shao, S. Cao, Y. Wang, S. Yuan, B. Kang and J. Zhang, Solid State Commun., 2012, 152, 947–950 CrossRef CAS.
  28. V. Sharma, A. McDannald, M. Staruch, R. Ramprasad and M. Jain, Appl. Phys. Lett., 2015, 107, 012901 CrossRef.
  29. T. Goto, T. Kimura, G. Lawes, A. P. Ramirez and Y. Tokura, Phys. Rev. Lett., 2004, 92, 257201 CrossRef CAS PubMed.
  30. G. Kresse and J. Furthmüller, Comput. Mater. Sci., 1996, 6, 15–50 CrossRef CAS.
  31. G. Kresse and J. Hafner, Phys. Rev. B: Condens. Matter Mater. Phys., 1994, 49, 14251–14269 CrossRef CAS.
  32. G. Kresse and J. Furthmüller, Phys. Rev. B: Condens. Matter Mater. Phys., 1996, 54, 11169–11186 CrossRef CAS.
  33. J. P. Perdew, K. Burke and M. Ernzerhof, D. of Physics and N. O. L. 70118 J. Quantum Theory Group Tulane University, Phys. Rev. Lett., 1996, 77, 3865–3868 CrossRef CAS PubMed.
  34. V. I. Anisimov, F. Aryasetiawan and A. I. Lichtenstein, J. Phys.: Condens. Matter, 1997, 9, 767–808 CrossRef CAS.
  35. A. Jain, G. Hautier, S. P. Ong, C. J. Moore, C. C. Fischer, K. A. Persson and G. Ceder, Phys. Rev. B: Condens. Matter Mater. Phys., 2011, 84, 045115 CrossRef.
  36. M. Staruch, V. Sharma, C. Dela Cruz, R. Ramprasad and M. Jain, J. Appl. Phys., 2014, 116, 9–14 CrossRef.
  37. C.-H. Kuo, I. M. Mosa, S. Thanneeru, V. Sharma, L. Zhang, S. Biswas, M. Aindow, S. Pamir Alpay, J. F. Rusling, S. L. Suib and J. He, Chem. Commun., 2015, 51, 5951–5954 RSC.
  38. A. Jain, S. P. Ong, G. Hautier, W. Chen, W. D. Richards, S. Dacek, S. Cholia, D. Gunter, D. Skinner, G. Ceder and K. A. Persson, APL Mater., 2013, 1, 011002 CrossRef.
  39. G. Hautier, C. C. Fischer, A. Jain, T. Mueller and G. Ceder, Chem. Mater., 2010, 22, 3762–3767 CrossRef CAS.
  40. B. Tiwari, M. K. Surendra and M. S. R. Rao, J. Phys.: Condens. Matter, 2013, 25, 216004 CrossRef PubMed.
  41. P. Gupta, R. Bhargava, R. Das and P. Poddar, RSC Adv., 2013, 3, 26427 RSC.
  42. R. D. Shannon, Acta Crystallogr., Sect. A, 1976, 32, 751 CrossRef.
  43. M. E. Wieser, J. Phys. Chem. Ref. Data, 2007, 36, 485–496 CrossRef CAS.
  44. P. Dutta, M. S. Seehra, S. Thota and J. Kumar, J. Phys.: Condens. Matter, 2008, 20, 015218 CrossRef.
  45. A. Jaiswal, R. Das, K. Vivekanand, T. Maity, P. M. Abraham, S. Adyanthaya and P. Poddar, J. Appl. Phys., 2010, 107, 013912 CrossRef.
  46. A. Jaiswal, R. Das, S. Adyanthaya and P. Poddar, J. Nanopart. Res., 2010, 13, 1019–1027 CrossRef.
  47. A. Khorsand Zak, W. H. A. Majid, M. E. Abrishami and R. Yousefi, Solid State Sci., 2011, 13, 251–256 CrossRef CAS.
  48. M. C. Weber, J. Kreisel, P. A. Thomas, M. Newton, K. Sardar and R. I. Walton, Phys. Rev. B: Condens. Matter Mater. Phys., 2012, 85, 054303 CrossRef.
  49. G. Kotnana and S. N. Jammalamadaka, J. Appl. Phys., 2015, 118, 1–7 CrossRef.
  50. P. Gupta and P. Poddar, RSC Adv., 2015, 5, 10094–10101 RSC.

This journal is © The Royal Society of Chemistry 2016