Development of an optimized HPLC method for the simultaneous determination of six compounds containing β-lactam ring in human plasma and urine using experimental design methodology

Eman A. Abdel Hameed, Randa A. Abdel Salam* and Ghada M. Hadad
Pharmaceutical Analytical Chemistry Department, Faculty of Pharmacy, Suez Canal University, Ismailia 41522, Egypt. E-mail: dr_rasalam@yahoo.com; Fax: +20-64-3561877; Tel: +20-01229446465

Received 5th November 2015 , Accepted 12th January 2016

First published on 15th January 2016


Abstract

β-Lactam antibiotics are commonly prescribed with β-lactamase inhibitors to patients, for that it is necessary to develop an optimized chromatographic method which determine them simultaneously in biological fluids. In the present study a gradient HPLC method was demonstrated for the simultaneous separation and quantification of four commonly used β-lactam antibiotics and two β-lactamase inhibitors in human plasma and urine using statistical experimental design. A fractional factorial design was used in order to screen four independent factors: percentage of acetonitrile in the gradient program, pH of the aqueous phase, column temperature and percentage of trifluoroacetic acid (TFA) in aqueous phase. Examined factors were identified as significant using ANOVA analysis except column temperature and percentage of TFA in aqueous phase. The optimum condition of separation was determined with aid of central composite design. Chromatographic separation was achieved on Discovery® C18 column 5 μm (25 cm × 4.6 mm) with UV detection at 225 nm. In this method, the analytes were extracted from plasma and urine using solid phase extraction. The method was found to be linear, specific, precise and accurate. Tinidazole (TZ) was used as an internal standard (I.S.).

1. Introduction

β-Lactam antibiotics have been the most widely used antimicrobial drugs for more than 80 years and are still considered one of the most important groups of antibiotics. They are used to treat respiratory tract infections that often result from the encroachment of sensitive bacteria. They are clinically used against Gram-positive and Gram-negative bacteria. Amoxicillin (AX), ampicillin (AP), cloxacillin (CX), and flucloxacillin (FX), are the most commonly used antibiotics because of their broad spectrum and low cost. Clavulanate potassium (CL), is a powerful inhibitor of β-lactamase enzyme and is most often formulated in combination with antibiotics such as amoxicillin for treatment of infections caused by β-lactamase producing bacteria that are resistant to amoxicillin alone. Sulbactam (SB), is also an inhibitor of the β-lactamase enzyme and it has a similar spectrum of beta-lactamase inhibition to clavulanic acid. It is given with ampicillin in the treatment of infections where beta-lactamase production is suspected. The pharmacokinetics of these drugs were studied and it was found that all these drugs are bound to plasma proteins and excreted unchanged in urine with different ratios.1

Several methods in the literature describe the determination of these drugs in dosage forms, biological fluids and other matrices. These methods include: (a) liquid chromatography (LC), in which AX and CL were determined in human plasma,2 AX and CL were determined in injections,3 AX and SB were determined in human plasma,4 AP and FX were determined in human plasma,5 AX and FX were determined in injections,6 AX and FX were determined in capsules,7–9 AP and CX were determined in dosage forms,10 AP, AX and CX were determined in pharmaceutical formulations,11 AP, cefoperazone, and SB were determined in pharmaceutical formulations with beta-cyclodextrin stationary phase,12 AX and CL were determined in human plasma by HPLC-ESI mass spectrometry,13 and a comparative study of RP-HPLC and UV spectrophotometric techniques was made for determination of AX and CX in capsules,14 (b) LC using solid phase extraction for sample treatment, in which β-lactams including AP and AX and sulfonamides were determined in animal feed,15 multi-residue analysis of quinolones, penicillins and cephalosporins in cow milk was made,16 six penicillins including AX and CX and three amphenicol antibiotics were determined in gilthead seabream,17 eleven antibiotics including AX and AP and their main metabolites were determined in human urine18 and trace determination of ten β-lactam antibiotics including AX, AP, CX and CL in environmental and food samples was achieved,19 (c) spectrophotometry, in which cefpodoxime and CL were determined,20 FX was determined and validated,21,22 AX and FX were determined in capsules,23 FX and CX were determined in pure and dosage form,24 and (d) capillary electrophoresis, in which bromhexine and AX were determined in pharmaceutical formulations,25 AX and CL were determined and AP and SB were determined in pharmaceutical formulations for injections using capillary electrophoresis and the method was compared with HPLC,26 AX was determined in capsules27 and six antibiotics including AX, AP and CX were determined in spiked milk samples.28

There is no reported method for the simultaneous quantification of these mentioned drugs in human plasma and urine. The present work describes a fully validated, optimized and reliable gradient RP-HPLC method with UV detection for simultaneous quantification of CL, AX, SB, AP, CX and FX in human plasma and urine. The sensitivity of the proposed method was checked by comparison of the detection limits for the proposed and the published methods.2,4,5,13 The comparison revealed that the proposed method was more sensitive than the other published methods. Confirmation of the applicability of the developed method was performed on four healthy volunteers after single oral administration of commercially available Augmentin® tablets, Unictam® tablets, Ampiclox® capsules, Flumox® capsules.

2. Results and discussion

2.1. Experimental designs

Analysis of variance (ANOVA) is a statistical analysis tool that separates the total variability found within a data set into two components: random and systematic factors. The random factors do not have any statistical influence on the given data set, while the systematic factors do. The ANOVA test is used to determine the impact independent variables have on the dependent variable in a regression analysis. ANOVA was applied to evaluate selected factors and their effects and to determine if the multiple regression fit is significant for each model. An independent factor had significant effect on a given response when it had a p-value < 0.05.

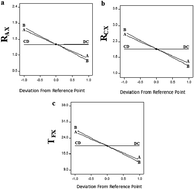
The results given in Table 1 for the screening fractional factorial design made indicated that percentage of acetonitrile and pH of the aqueous phase had the most significant effects on the resolution RAX and the resolution RCX and the retention time of the last eluted peak TFX, where p-values of these two factors is lower than 0.05 for all selected responses. Column temperature and percentage of TFA in aqueous phase had no significant effect on all the selected responses (p-values > 0.05). R2adj was greater than 0.85 in all cases, revealing good fit of experimental data.29 In Fig. 1, perturbation plots are presented, this type of plots shows the effect of an independent factor on a specific response, with all factors held constant at a reference point, a steepest slope indicates sensitiveness to a specific factor.30

Table 1 ANOVA results for fractional factorial design. A 5% level of significance was desired
Factors RAX RCX TFX min
F pa F pa F pa
a p-Value should be less than 0.05 to be statistically significant.
Model 14.78 0.0115 8.93 0.0284 8.90 0.0286
A – ACN% 24.80 0.0076 14.78 0.0184 15.02 0.0179
B – pH 34.30 0.0042 20.95 0.0102 20.57 0.0105
C – Temp 2.13 × 10⁻⁴ 0.9890 0.000 1.0000 4.34 × 10⁻⁵ 0.9951
D – TFA% 0.01 0.9235 2.65 × 10⁻⁴ 0.9878 4.34 × 10⁻⁴ 0.9841
R2adj 0.9359 0.8999 0.8999


image file: c5ra23350j-f1.tif
Fig. 1 Perturbation plots showing the effect of the examined factors on the responses (a) resolution of critical pair RAX, (b) resolution of critical pair RCX and (c) retention time TFX, where A is acetonitrile concentration (%), B is pH of the aqueous phase, C is column temperature and D is TFA%.

Central composite design was then applied on the percentage of acetonitrile and pH of the aqueous phase factors keeping column temperature constant at 25 °C and TFA% was 0.1% in aqueous phase and the statistical parameters obtained from ANOVA were given in Table 2 where the two main factors had the most significant effects and also quadratic terms and factor interactions created important effects (though less significant than the main effect). The adequate precision (depicts the value of signal to noise ratio; ratio greater than 4 is preferred), the coefficient of variation (C.V.) (measures the reproducibility of the model; a value less than 10% is desirable limit (Table S1)).30 The derived regression models are also shown in Table S1. A positive sign in the models showed a synergistic effect while a negative sign indicated antagonistic effect. Response surfaces are shown in Fig. 2 where the interaction effects of percentage of acetonitrile and pH of the aqueous phase are illustrated on the selected responses.

Table 2 ANOVA results for CCD. A 5% level of significance was desired. Insignificant interaction effects were excluded
Factors RAX RCX TFX min
F pa F pa F pa
a p-Value should be less than 0.05 to be statistically significant.
Model 118.53 <0.0001 304.86 <0.0001 178.74 <0.0001
A – ACN 44.40 0.0003 103.74 <0.0001 57.45 0.0001
B – pH 506.67 <0.0001 1295.96 <0.0001 799.48 <0.0001
AB 11.29 0.0121 70.69 <0.0001 17.68 0.0040
A2 2.12 0.1883 0.01 0.9361 0.28 0.6104
B2 25.73 0.0014 53.15 0.0002 19.11 0.0033
R2adj 0.9799 0.9921 0.9384


image file: c5ra23350j-f2.tif
Fig. 2 Response surfaces related to acetonitrile concentration (%) and pH of the aqueous phase: (a) resolution of critical pair RAX, (b) resolution of critical pair RFX and (c) retention time TFX. Column temperature constant at 25 °C and TFA% was 0.1% in aqueous phase.

Obtaining an optimal procedure required different dependent and independent variables to be simultaneously set. Derringer's desirability function D was used to estimate the optimum conditions of separation.30

 
D = [d1p1 × d2p2 × …… × dnpn]1/n (1)
where pi is the weight of the response, n is the number of responses and di is the individual desirability function of each response. The scale of the individual desirability function ranges between di = 0 for a completely undesired response and di = 1 for a fully desired response. Derringer's desirability function D can take values from 0 to 1. For a value of D close to 1, response values are near the target value. The constraints in this study that were imposed on the responses included maximizing a resolution greater than 1.5 and a retention time of FX peak less than 20 min. Optimization was performed with the aid of Design Expert Version 7.1. The response surface obtained for the desirability function is presented in Fig. 3.


image file: c5ra23350j-f3.tif
Fig. 3 The response surface obtained for the desirability function.

Therefore, the following conditions can be identified as optimal: acetonitrile (mobile phase A) and 25 mM phosphate buffer containing 0.1% TFA (mobile phase B), pH was 3.4. The gradient program consisted of 0–1 min 14% mobile phase A; 1–8 min gradient up to 19% mobile phase A; 8–9 min gradient up to 29% mobile phase A; 9–10 min gradient up to 34% mobile phase A; and 10–20 min gradient up to 49% mobile phase A. After 20 min, the gradient was returned to the initial condition and the analytical column was reconditioned for 10 min.

Chromatograms of blank plasma and urine (Fig. 4a and 5a; respectively) showed no interfering peaks at the retention times of the analytes and I.S. Fig. 4b and 5b show typical chromatograms for the spiked samples prepared from plasma and urine; respectively, containing analytes and I.S. where the drugs were well separated. The average retention time ± SD for CL, AX, SB, TZ, AP, CX and FX were found to be 3.9 ± 0.06, 4.8 ± 0.08, 6.0 ± 0.09, 8.1 ± 0.05, 9.3 ± 0.07, 19.1 ± 0.10 and 19.8 ± 0.08 min, respectively, for seven replicates. The peaks obtained were sharp and have clear baseline separation. The system suitability results are given in Table S2.


image file: c5ra23350j-f4.tif
Fig. 4 Typical HPLC chromatograms obtained from analysis of (a) blank plasma sample (b) plasma sample spiked with 0.5 μg mL−1 CL, 1 μg mL−1 AX, 1 μg mL−1 SB, 2 μg mL−1 AP, 3 μg mL−1 CX, 3 μg mL−1 FX and 10 μg mL−1 TZ (c) real plasma sample taken after 1.5 h of oral Augmentin® dose administration, CL and AX were found to be 2.2 μg mL−1 and 4.2 μg mL−1 respectively (d) real plasma sample taken after 1 h of oral Unictam® dose administration, SB and AP were found to be 1.1 μg mL−1 and 3.2 μg mL−1 respectively (e) real plasma sample taken after 1 h of oral Ampiclox® dose administration, AP and CX were found to be 2.7 μg mL−1 and 4.5 μg mL−1 respectively (f) real plasma sample taken after 1 h of oral Flumox® dose administration, AX and FX were found to be 3.9 μg mL−1 and 5.5 μg mL−1 respectively.

image file: c5ra23350j-f5.tif
Fig. 5 Typical HPLC chromatograms obtained from analysis of (a) blank urine sample (b) urine sample spiked with 2 μg mL−1 CL, 1 μg mL−1 AX, 1.5 μg mL−1 SB, 5 μg mL−1 AP, 4 μg mL−1 CX, 4 μg mL−1 FX and 10 μg mL−1 TZ (c) real urine sample taken after 3 h of oral Augmentin® dose administration, CL and AX were found to be 7.5 μg mL−1 and 18 μg mL−1 respectively (d) real urine sample taken after 7 h of oral Unictam® dose administration, SB and AP were found to be 4.3 μg mL−1 and 10 μg mL−1 respectively (e) real urine sample taken after 2.5 h of oral Ampiclox® dose administration, AP and CX were found to be 13 μg mL−1 and 8.5 μg mL−1 respectively (f) real urine sample taken after 3 h of oral Flumox® dose administration, AX and FX were found to be 16.8 μg mL−1 and 12 μg mL−1 respectively.

The performance of the proposed method on real samples was demonstrated by its application to plasma and urine samples taken from four healthy volunteers who received single dose from Augmentin® tablets, Unictam® tablets, Ampiclox® capsules and Flumox® capsules. Fig. 4c shows a typical HPLC chromatogram of real plasma sample taken after 1.5 h from receiving Augmentin® tablet, the concentrations of CL and AX in plasma were determined and found to be 2.2 μg mL−1 and 4.2 μg mL−1 respectively after 1.5 h. Fig. 5c shows a typical HPLC chromatogram of real urine sample taken after 3 hours from receiving the drug. The concentrations of CL and AX in urine were determined and found to be 7.5 μg mL−1 and 18 μg mL−1 respectively after 3 h. Fig. 4d shows a typical HPLC chromatogram of real plasma sample taken after 1 h from receiving Unictam® tablet, the concentrations of SB and AP in plasma were determined and found to be 1.1 μg mL−1 and 3.2 μg mL−1 respectively after 1 h. Fig. 5d shows a typical HPLC chromatogram of real urine sample taken after 7 h from receiving the drug. The concentrations of SB and AP in urine were determined and found to be 4.3 μg mL−1 and 10 μg mL−1 respectively after 7 h. Fig. 4e shows a typical HPLC chromatogram of real plasma sample taken after 1 h from receiving Ampiclox® capsule, the concentrations of AP and CX in plasma were determined and found to be 2.7 μg mL−1 and 4.5 μg mL−1 respectively after 1 h. Fig. 5e shows a typical HPLC chromatogram of real urine sample taken after 2.5 h from receiving the drug. The concentrations of AP and CX in urine were determined and found to be 13 μg mL−1 and 8.5 μg mL−1 respectively after 2.5 h. Fig. 4f shows a typical HPLC chromatogram of real plasma sample taken after 1 h from receiving Flumox® capsule, the concentrations of AX and FX in plasma were determined and found to be 3.9 μg mL−1 and 5.5 μg mL−1 respectively after 1 h. Fig. 5f shows a typical HPLC chromatogram of real urine sample taken after 3 hours from receiving the drug. The concentrations of AX and FX in urine were determined and found to be 16.8 μg mL−1 and 12 μg mL−1 respectively after 3 hours.

2.2. Solid phase extraction optimization

The effect of pH was studied by adjusting the pH value of the plasma or urine sample at a pH 2.5, 5 and 7. At pH 2.5, all the analytes had high percentage recoveries (>80%) for both plasma and urine samples while at pH 5, CL, AX, SB and AP had a low percentage recovery (35.6%, 29.5%, 32.4% and 15.5% for plasma samples and 30.1%, 23.5%, 32.7% and 21.2% for urine samples, respectively) and at pH 7, CL, AX and AP had a low percentage recovery (20.2%, 25.0% and 22.4% for plasma samples and 27.1%, 34.2% and 24.6% for urine samples, respectively) while SB was not detected. Three washing systems were examined, the first one was water, the second was 2 mL of 1% formic acid, 2 mL of H2O and 2 mL of 2% methanol aqueous solution and the third was 2 mL of 1% NH3, 2 mL of 1% formic acid and 2 mL of 2% methanol aqueous solution. The third washing system was found to be the most efficient and led to cleaner extracts. Different elution systems were studied as shown in Table 3. The elution system 1 mL of methanol, 1 mL of acetonitrile and 0.5 mL of dichloromethane was found to have the most satisfactory results for plasma and urine samples. Atenolol, hydrochlorothiazide and tinidazole were examined for the most proper internal standard, atenolol was not well separated from CL by the proposed HPLC method, hydrochlorothiazide was well separated from the studied compounds but showed a low percentage recovery by the SPE method (30.3% for plasma sample and 42.1% for urine sample), tinidazole (TZ) was the most proper internal standard that it was well separated from the studied compounds and it showed satisfactory percentage recovery by the SPE method (Table 3). All these previous studies were performed on 60 mg/3 cm3 Oasis® HLB extraction cartridges.
Table 3 Different elution systems for solid phase extraction optimization for plasma and urine
Elution system % Recovery
CL AX SB TZ AP CX FX
Plasma Urine Plasma Urine Plasma Urine Plasma Urine Plasma Urine Plasma Urine Plasma Urine
2.5 mL of methanol 25.8 40.3 30.1 20.5 12.1 24.7 50.3 70.3 34.3 32.8 50.9 40.1 60.1 20.1
2.5 mL of acetonitrile 65.2 70.2 27.3 30.5 30.1 70.5 60.2 30.3 30.5 40.3 25.1 27.3 26.3 33.3
2.5 mL of (methanol[thin space (1/6-em)]:[thin space (1/6-em)]acetonitrile (50[thin space (1/6-em)]:[thin space (1/6-em)]50)) 60.6 80.6 69.9 62.9 58.1 30.4 70.6 79.3 70.9 65.6 111 92.9 89.3 83.0
1 mL of methanol + 1.5 mL of acetonitrile 80.1 86.0 85.3 88.2 70.2 50.7 66.3 60.7 82.2 80.1 70.2 85.3 79.7 75.2
1 mL of methanol + 1 mL of acetonitrile + 0.5 mL of dichloromethane 93.5 94.8 94.6 96.9 91.3 90.0 97.8 95.8 95.9 93.1 98.1 94.6 98.8 97.4


2.3. Validation of the method

2.3.1. Linearity. The linearity of the calibration graphs was validated by the high value of the correlation coefficient and the intercept value, which was not statistically (p = 0.05) different from zero (Table S3). Characteristic parameters for regression equations of the HPLC method obtained by least squares treatment of the results are given in Table S3. Upon AMC (Analytical Methods Committee), a value of regression coefficient close to unity is not necessarily the outcome of a linear relationship and in consequence the test for the lack of fit should be checked31 (Table S4). This test evaluates the variance of the residual values.32 The calculated values were lower than the tabulated ones (α = 0.05), linearity thus being demonstrated.
2.3.2. Accuracy, precision and lower limit of quantitation (LLOQ). The intra-day and inter-day precision values (relative standard deviation (RSD%)) and the accuracies (relative error (RE%)) of the analytes were within ±15%. They met the requirements for determination of biological sample concentration.33 The results obtained were shown in Table S5. The LLOQ was defined as the lowest concentration of each analyte which can be quantified with acceptable accuracy and precision.34 The LLOQ of CL, AX, SB, AP, CX and FX were 0.3 μg mL−1, 0.6 μg mL−1, 0.7 μg mL−1, 0.6 μg mL−1, 0.1 μg mL−1 and 0.1 μg mL−1, respectively.
2.3.3. Robustness. Robustness was tested using experimental design methodology. Statistical experimental design methodology has proved to be a useful tool for robustness tests, as it simplifies the investigation of simultaneously changing factors parameters.35 When a factor is not robust, one can decide whether to change the proposed method or to control the factor in question. In robustness testing, factors interactions are usually considered negligible.36 For robustness a two-level fractional factorial design was used in order to identify possible significant effects from the following factors: percentage of acetonitrile (A), pH (B), mobile phase flow rate (C) and wavelength of detection (D). The method settings and the range investigated in robustness are shown in Table S6. Peak areas of 10 μg mL−1 of CL, AX, SB, TZ, AP, CX and FX were selected as responses. A linear relationship (eqn (2)) with no interaction effects was selected as a proper model, since interaction and quadratic effects were excluded. The effects of the examined factors were estimated by ANOVA.
 
y = b0 + b1A + b2B + b3C + b4D (2)
where y is the response measured, A, B, C, D are the factors investigated and b0, b1, b2, b3, b4 are weight coefficients.

The results are shown in Table S7. All measurements were conducted in triplicate. Significant effects had a p-value < 0.05. From results it was concluded that the mobile phase flow rate affects only the peak area responses of CX and FX (p-value < 0.05), and the rest of examined factors had no significant effect on the selected responses having p-values > 0.05. Thus, the influence of mobile phase flow rate was examined separately at a narrower range (0.9–1.1 mL min−1). Changes in the peak areas were within acceptable limits (less than 4% (ref. 30)).

2.3.4. Stability. With regard to the stock solution stability, AX, AP, CX, FX and TZ were stable at room temperature 25 °C for 5 h and at 4 °C for 10 days, CL and SB were stable at room temperature 25 °C for 3 h and at 4 °C for 7 days.

The stability studies confirmed that plasma and urine samples of AX, AP, CX, FX were stable at room temperature 25 °C for 5 h (short-term storage), at −20 °C for 20 days (long-term storage) and through three freeze–thaw cycles and the post-preparative samples were stable at 25 °C for 3 h. While, plasma and urine samples of CL and SB were stable at room temperature 25 °C for 3 h (short-term storage), at −20 °C for 10 days (long-term storage) and through two freeze–thaw cycles and the post-preparative samples were stable at 25 °C for 2 h (Table S8).

3. Experimental

3.1. Instrumentation

The HPLC (Shimadzu, Kyoto, Japan) instrument was equipped with a model series LC-10 ADVP pump, SCL-10 AVP system controller, DGU-12 A Degasser, Rheodyne 7725i injector with a 20 μL loop and a SPD-10AVP UV-VIS detector. Separation and quantitation were made on Discovery® C18 column 5 μm (25 cm × 4.6 mm). An HPLC column oven was used, DALIAN REPLETE®, Hong Kong. The detector was set at λ 225 nm. Data acquisition was performed on Class-VP software.

3.2. Materials and reagents

Pharmaceutical grades of CL, AX, SB, AP, CX, FX and TZ as the internal standard (I.S.) were kindly supplied by Medical Union Pharmaceuticals and certified to contain 99.4, 99.6, 99.2, 99.7, 99.5, 99.5 and 99.7% respectively. Acetonitrile and methanol used were HPLC grade (POCH, Poland). Trifluoroacetic acid (TFA), sodium dihydrogen phosphate, formic acid, 33% ammonia solution and sodium hydroxide (NaOH) used were analytical grade. Oasis® HLB 60 mg/3 cm3 solid phase extraction (SPE) cartridges were obtained from Waters (Milford, Mass, USA). Commercial Augmentin® tablets (Batch no. 121063) used were manufactured by Medical Union Pharmaceuticals, Egypt, labeled to contain 250 mg AX and 125 mg CL per tablet, Unictam® tablets (Batch no. 122573) used were manufactured by Medical Union Pharmaceuticals, Egypt, labeled to contain 250 mg AP and 125 mg SB (375 mg sultamicillin) per tablet, Ampiclox® capsules (Batch no. 120817) used were manufactured by Medical Union Pharmaceuticals, Egypt, labeled to contain 250 mg AP and 250 mg CX (375 mg sultamicillin) per capsule and Flumox® capsules (Batch no. 1210253) used were manufactured by Egyptian international pharmaceutical industries company EIPICO, Egypt, labeled to contain 250 mg AX and 250 mg FX per capsule. The applicability of HPLC-UV method for the determination of CL, AX, SB, AP, CX and FX was verified using an internal standard I.S. for quantification tinidazole (TZ), (1-[2-(ethylsulphonyl)ethyl]-2-methyl-5-nitroimidazole).

3.3. Chromatographic conditions

The HPLC separation and quantitation were made on a 250 × 4.6 mm (i.d.) Discovery (5 μm particle size) reversed-phase C18 analytical column. The mobile phase was acetonitrile (mobile phase A) and 25 mM phosphate buffer containing 0.1% TFA (mobile phase B), pH was adjusted to 3.4 by NaOH. The gradient program consisted of 0–1 min 14% mobile phase A; 1–8 min gradient up to 19% mobile phase A; 8–9 min gradient up to 29% mobile phase A; 9–10 min gradient up to 34% mobile phase A; and 10–20 min gradient up to 49% mobile phase A. After 20 min the gradient was returned to the initial condition and the analytical column was reconditioned for 10 min. The flow rate was 1 mL min−1. All determinations were performed at 25 °C temperature. The injection volume was 20 μL. The detector was set at λ 225 nm. Data acquisition was performed on Class-VP software.

3.4. Experimental designs

Before starting an optimization procedure, it is important to identify the critical factors affecting the HPLC method. In the present study the significance of four independent factors on the quality of the separation was investigated using a two-level fractional factorial design.37 Fractional factorial designs are the most widely used in the step of selection of factors (screening step) because they are economic and efficient. The matrix for fractional factorial design is shown in Table S9. The four factors (Table S9) examined were, namely percentage of acetonitrile (which means the linear change of percentage of acetonitrile in each time interval in the gradient program), pH of the aqueous phase, column temperature and percentage of TFA in aqueous phase. All experiments were conducted in a randomized order and in triplicate. The response factors chosen were the resolution of critically separated peaks RAX (AX and SB peaks) and the resolution of critically separated peaks RCX (CX and FX peaks) and the retention time of the last eluted peak TFX. From the results of the fractional factorial design, optimization of the HPLC method was made using a central composite design CCD.29 In this design, the effects of percentage of acetonitrile and pH of aqueous phase on the former response factors were studied while the temperature was kept constant at 25 °C and percentage of TFA was 0.1%. A total of 10 experiments (22 points of the factorial design, 2 × 2 for the star points plus 2 repetitions of the central point to consider the experimental errors) were carried out in a randomized run order. Table S10 summarizes the conducted experiments and responses.

3.5. Statistical tools

Work on experimental design, data analysis, response surfaces and graphs were performed by Design Expert Version 7.1 (Stat-Ease Inc., Minneapolis, MN, USA).

3.6. Preparation of stock and working solutions

Stock solutions of CL, SB and AP were prepared separately by dissolving CL, SB and AP in acetonitrile[thin space (1/6-em)]:[thin space (1/6-em)]water (1[thin space (1/6-em)]:[thin space (1/6-em)]1) to obtain a concentration of 0.5 mg mL−1. Stock solution of AX was prepared by dissolving AX in methanol[thin space (1/6-em)]:[thin space (1/6-em)]water (1[thin space (1/6-em)]:[thin space (1/6-em)]1) to obtain a concentration of 0.5 mg mL−1. Stock solutions of CX and FX were prepared separately by dissolving CX and FX in acetonitrile to obtain a concentration of 0.5 mg mL−1. Stock standard solution of TZ was prepared by dissolving TZ in methanol to obtain a concentration of 0.5 mg mL−1. The working solutions used for spiking blank human plasma were prepared by dilution of stock solutions with methanol to reach the concentration range 1.5–100 μg mL−1 for CL, 3–75 μg mL−1 for AX and AP, 3.5–75 μg mL−1 for SB, 0.5–75 μg mL−1 for CX and FX and 50 μg mL−1 for I.S.

The working solutions used for spiking blank human urine were prepared by dilution of stock solutions with methanol to reach the concentration range 7.5–500 μg mL−1 for CL, 15–500 μg mL−1 for AX and AP, 17.5–375 μg mL−1 for SB, 2.5–375 μg mL−1 for CX and FX and 250 μg mL−1 for I.S. All solutions were stored at −20 °C until determination.

3.7. Calibration standards and quality control samples

Calibration standards and quality control (QC) samples were prepared by transferring 100 μL aliquots of the above mentioned working solutions to glass vials and completing to 500 μL by blank human plasma or urine. After solid phase extraction procedure which is thoroughly described in Section 3.9, samples contained 0.3–20 μg mL−1 of CL, 0.6–15 μg mL−1 of AX and AP, 0.7–15 μg mL−1 of SB, 0.1–15 μg mL−1 of CX and FX in plasma samples and 0.3–20 μg mL−1 of CL, 0.6–20 μg mL−1 of AX and AP, 0.7–15 μg mL−1 of SB, 0.1–15 μg mL−1 of CX and FX in urine samples. All samples finally contained 10 μg mL−1 of I.S.

3.8. Samples

This investigation conforms to the Egyptian Community guidelines for the use of humans in experiments. The Human Ethics Committee of Faculty of pharmacy, Suez Canal University, approved the study. Four healthy (normal liver, kidney functions and electrocardiogram) male, informed, adult volunteers were instructed to abstain from all medications for 2 weeks before single oral administration of Augmentin® tablet, Unictam® tablet, Ampiclox® capsule and Flumox® capsule.
3.8.1. Plasma sample. Blood samples were collected into tubes containing disodium EDTA. Samples were centrifuged at 4500 × g for 10 min and stored at −20 °C until determination.
3.8.2. Urine sample. Urine samples were collected at intervals for up to 24 h. The volume of urine specimen was measured and recorded after each collection; 20 mL aliquots were stored at −20 °C until determination.

3.9. Sample preparation

The pH of plasma or urine samples was adjusted to 2.5 using formic acid. 500 μL of plasma or urine samples were extracted through 60 mg/3 cm3 Oasis® HLB extraction cartridges. The cartridges were preconditioned with 2 mL of methanol followed by 2 mL of water. The samples were then passed through the cartridges at a flow rate of approximately 1 mL min−1 and then rinsed with 2 mL of 1% NH3 solution, 2 mL of 1% formic acid and 2 mL of 2% methanol aqueous solution. The analytes were eluted by 1 mL of methanol, 1 mL of acetonitrile and 0.5 mL of dichloromethane. The eluate was evaporated to dryness using nitrogen stream and for plasma samples the eluate was reconstituted again with 0.5 mL of methanol, while for urine samples, the eluate was reconstituted with 2.5 mL of methanol. The dilution was necessary because of much higher concentrations of investigated substances in urine.

3.10. Validation of the method

3.10.1. Specificity. Specificity of the method was evaluated by comparing the chromatograms of six different batches of blank human plasma and urine as well as the corresponding spiked samples.
3.10.2. Linearity. Calibration curves were made by analyzing seven concentration levels ranging from 0.3–20 μg mL−1 for CL, 0.6–15 μg mL−1 for AX, 0.7–15 μg mL−1 for SB, 0.6–15 μg mL−1 for AP, 0.1–15 μg mL−1 for CX and 0.1–15 μg mL−1 for FX in plasma and 0.3–20 μg mL−1 for CL, 0.6–20 μg mL−1 for AX, 0.7–15 μg mL−1 for SB, 0.6–20 μg mL−1 for AP, 0.1–15 μg mL−1 for CX and 0.1–15 μg mL−1 for FX in urine. Each concentration was repeated three times. Calibration curves were constructed from the peak area ratios of each analyte to I.S. versus concentrations in plasma or urine using linear least-squares regression model.
3.10.3. Accuracy and precision. The intra-day precision and accuracy were evaluated by analyzing five replicates at three QC concentration levels for samples on the same day. Inter-day precision and accuracy were evaluated by analyzing of the three QC concentration levels for samples on five consecutive days. The criteria of acceptability of the data included accuracy expressed as relative error (RE%) and precision expressed as relative standard deviation (RSD%), both should be within ±15% except for LLOQ which should not exceed ±20%.34
3.10.4. Stability. The stock solution stabilities of analytes and I.S. were examined at room temperature 25 °C for 5 h and at 4 °C for 10 days. Stability experiments were performed under different conditions to evaluate the analytes stability in plasma and urine samples. The analytes in blank plasma or urine were processed on short-term storage conditions at room temperature 25 °C for 5 h (short-term storage), at −20 °C for 20 days (long-term storage), three freeze–thaw cycles and the post-preparative stability was tested by injecting samples immediately after preparation and re-injected 3 h later at room temperature. All stability studies were conducted at two QC concentration levels with three determinations for each. The concentrations stabilities are compared to the nominal concentrations. The deviation should be within ±15%. CL and SB were not stable under these conditions, for that they were examined under lighter conditions which were: at room temperature 25 °C for 3 h and at 4 °C for 7 days for stock solutions and in case of plasma and urine samples: at room temperature 25 °C for 3 h (short-term storage), at −20 °C for 10 days (long-term storage), two freeze–thaw cycles and the post-preparative stability was tested by injecting samples immediately after preparation and re-injected 2 h later at room temperature.

4. Conclusion

An efficient gradient HPLC method was developed, optimized and validated for the analysis of CL, AX, SB, AP, CX and FX simultaneously in human plasma and urine for the first time using statistical experimental design with solid phase extraction for the samples treatment. Resolution and time of analysis was simultaneously optimized using experimental design which confirms that experimental design and response surface methodology is a flexible procedure, able to reduce the number of experiments needed. The method showed good precision and accuracy, high extraction recovery, wide linear range and low consumption of sample. The method has been successfully applied in plasma and urine after a single oral administration of each of Augmentin® tablet, Unictam® tablet, Ampiclox® capsule and Flumox® capsule. The method could successfully determine any future expected commercial combinations of these mentioned drugs in plasma and urine.

References

  1. S. C. Sweetman, Martindale – The complete drug reference, Pharmaceutical Press, London, 2007 Search PubMed.
  2. S. M. Foroutan, A. Zarghi and A. Shafaati, J. Pharm. Biomed. Anal., 2007, 45, 531–534 CrossRef CAS PubMed.
  3. D. Tippa and N. Singh, J. Anal. Chem., 2010, 1, 95–101 CAS.
  4. Q. Peia, G. Yanga and Z. Li, J. Chromatogr. B: Anal. Technol. Biomed. Life Sci., 2011, 879, 2000–2004 CrossRef PubMed.
  5. C. Huang, J. Gao and L. Miao, J. Pharm. Biomed. Anal., 2012, 59, 157–161 CrossRef CAS PubMed.
  6. H. Liu, H. Wang and V. B. Sunderland, J. Pharm. Biomed. Anal., 2005, 37, 395–398 CrossRef CAS PubMed.
  7. D. S. Nikam, C. G. Bonde and S. J. Surana, Int. J. PharmTech Res., 2009, 1, 935–939 CAS.
  8. P. Shanmugasundaram, R. K. Raj and J. Mohanrangan, Rasayan J. Chem., 2009, 2, 57–60 CAS.
  9. A. El-Gindy, S. Emara and G. M. Hadad, II Farmaco, 2004, 59, 703–712 CrossRef CAS PubMed.
  10. V. Kumar, H. Bhutani and S. Singh, J. Pharm. Biomed. Anal., 2007, 43, 769–773 CrossRef CAS PubMed.
  11. A. Ashnagar and N. G. Naseri, Eur. J. Chem., 2007, 4, 536–545 CAS.
  12. T. L. Tsou, Y. C. Huang and C. W. Lee, J. Sep. Sci., 2007, 30, 2407–2413 CrossRef CAS PubMed.
  13. K. H. Yoon, S. Y. Lee, W. Kim and J. S. Park, J. Chromatogr. B: Anal. Technol. Biomed. Life Sci., 2004, 813, 121–127 CrossRef CAS PubMed.
  14. D. T. Giang and V. D. Hoang, J. Young Pharm., 2010, 2, 190–195 CrossRef CAS PubMed.
  15. L. Kantiani, M. Farré and J. Manuel Grases, J. Chromatogr. A, 2010, 1217, 4247–4254 CrossRef CAS PubMed.
  16. A. Junza, R. Amatya and D. Barron, J. Chromatogr. B: Anal. Technol. Biomed. Life Sci., 2011, 879, 2601–2610 CrossRef CAS PubMed.
  17. E. N. Evaggelopoulou and V. F. Samanidou, Food Chem., 2013, 136, 1322–1329 CrossRef CAS PubMed.
  18. R. Fernandez-Torres, M. Consentino and M. A. Bello Lopez, Talanta, 2010, 81, 871–880 CrossRef CAS PubMed.
  19. M. I. Bailn-Pérez, A. M. Garca-Campana and M. O. Iruela, J. Chromatogr. A, 2009, 1216, 8355–8361 CrossRef PubMed.
  20. S. V. Gandhi, U. P. Patil and N. G. Patil, Hind. Antibiot. Bull., 2009, 51, 24–28 Search PubMed.
  21. V. Prakash, S. Niroush Konari and G. Suresh, Int. J. Pharm. Sci. Res., 2012, 3, 1806–1808 CAS.
  22. R. S. Gujral, S. M. Haque and P. Shanker, Eur. J. Chem., 2009, 6, 397–405 Search PubMed.
  23. H. M. Aly and A. S. Amin, Int. J. Pharm., 2007, 338, 225–230 CrossRef CAS PubMed.
  24. S. M. Al-Ghannam, Microchim. Acta, 2002, 138, 29–32 CrossRef CAS.
  25. D. C. Oliva, K. T. V. élez and A. L. Revilla Vázquez, J. Mex. Chem. Soc., 2011, 55, 79–83 CAS.
  26. G. Pajchel, K. Pawłowski and S. Tyski, J. Pharm. Biomed. Anal., 2002, 29, 75–81 CrossRef CAS PubMed.
  27. D. El-Sabawia, I. I. Hamdana and D. Haj-Ali, J. Liq. Chromatogr. Relat. Technol., 2012, 35, 573–589 CrossRef.
  28. S. M. Santos, M. Henriques and A. C. Duarte, Talanta, 2007, 15, 731–737 CrossRef PubMed.
  29. L. V. Candioti, M. M. De Zan and M. S. Camara, Talanta, 2014, 124, 123–138 CrossRef PubMed.
  30. T. Sivakumar, R. Manavalan and C. Muralidharan, J. Pharm. Biomed. Anal., 2007, 43, 1842–1848 CrossRef CAS PubMed.
  31. J. B. N. Juan, G. C. Carmen, J. V. L. Maria and R. R. Virginia, J. Chromatogr. A, 2005, 1072, 249–257 CrossRef.
  32. N. R. Draper and H. Smith, Fitting a straight line by least squares, in Applied regression analysis, Wiley, New York, 1981, pp. 22–40 Search PubMed.
  33. V. P. Shah, K. K. Midha and J. W. A. Findlay, Pharm. Res., 2000, 17, 1551–1557 CrossRef CAS.
  34. The European Medicines Agency, Guideline on bioanalytical method validation, Committee for Medicinal Products for Human Use, EMEA/CHMP/EWP/192217/2009, 2011 Search PubMed.
  35. R. Ficarra, P. Ficarra, S. Tommasinni and S. Melaridi, J. Pharm. Biomed. Anal., 2000, 23, 169–174 CrossRef CAS PubMed.
  36. B. Dejaegher and Y. V. Heyden, J. Chromatogr. A, 2007, 1158, 138–157 CrossRef CAS PubMed.
  37. T. Lundstedt, E. Seifert and L. Abramo, Chemom. Intell. Lab. Syst., 1998, 42, 3–40 CrossRef CAS.

Footnote

Electronic supplementary information (ESI) available. See DOI: 10.1039/c5ra23350j

This journal is © The Royal Society of Chemistry 2016