Electrodeposition of crystalline silicon directly from silicon tetrachloride in ionic liquid at low temperature†
Junling Zhang,
Shimou Chen,
Haitao Zhang,
Suojiang Zhang*,
Xue Yao and
Zhaohui Shi
Beijing Key Laboratory of Ionic Liquids Clean Process, Key Laboratory of Green Process and Engineering, State Key Laboratory of Multiphase Complex Systems, Institute of Process Engineering, Chinese Academy of Sciences, Beijing 100190, China. E-mail: sjzhang@ipe.ac.cn
First published on 20th January 2016
Abstract
Crystalline silicon (Si) is widely used in modern electronics. Si is commonly produced through a series of energy-intensive reactions (>700 °C). It is thus urgent and significant to explore more economically and environmentally-benign synthetic strategies for crystalline Si at low temperature. In this contribution, we report an efficient method to prepare crystalline Si from silicon tetrachloride at the low temperature of 100 °C with an ionic liquid (IL) as electrolyte. Physicochemical characterization revealed that as-deposited crystalline Si with a diamond cubic crystal structure exhibited a dominant (111)-orientation. Moreover, in-depth insights into the growth mechanism of crystalline Si was shed light upon herein. Furthermore, the smart electrodepositing platform of crystalline Si from ILs would open up a new avenue for low-temperature metallurgy of Si.
1. Introduction
Si is the most important semiconductor in optoelectronic technologies because of its abundant existence, chemical stability, and excellent optical and electronic properties.1–3 Therefore, it has been the objective of many research groups to obtain a simple and economic production process for Si. The current crystalline Si production process such as Siemens method often involves a series of energy-intensive, highly polluting carbothermal reduction reactions. In recent years, the continuously increasing desire for lower-cost Si-based solar photovoltaic devices has motivated researchers to explore an alternative cheaper and greener technique for Si extraction.Electrodeposition has been identified as a potential alternative route for the preparation of metals and semiconductors since it can be easily controlled, and is relatively clean and cheap.4,5 Electrodeposition of Si has been studied in various solution media such as high-temperature molten salts (fluoride molten salt, calcium chloride, etc.),6,7 organic solvents,8,9 and room-temperature ionic liquids (ILs).10–13 Si can be well electrodeposited as crystalline products from molten salts at high temperatures (>700 °C), and that often results in difficult operations and high energy consumption. Si can also be electrodeposited in organic solvents and ILs at low temperature. However, the as-prepared Si from low temperature electrodeposition is always amorphous and requiring additional high temperature thermal annealing.14 Therefore, the incompatibility of low temperatures and a crystalline product have thus severely limited the developing of Si-electrodeposition technology. Recently, it was reported by Maldonado et al. that crystalline Si can be electrodeposited by using a liquid-metal working electrode at 80–100 °C.15 Liquid-metal electrode can act as both the electron source for reducing dissolved species in solution and the solvent for re-crystallization. This method for Si electrodeposition overcomes the long standing challenge and have substantial technological impact. Organic solvent propylene carbonate (PC) was employed as electrolyte in the research before.15 There are many advantages in the use of conventional organic solvents such as being cost-effective and easy to control. However, the system suffers from high volatility which results in quick evaporation in higher temperatures. From the practical application point of view, it is still needed to develop novel electrolytes with improved physicochemical features such as low volatility and good thermal stability.
ILs behave very differently to traditional molecular liquids when they are used as solvents. ILs are usually non-volatile and have high thermal stability in most cases, which make them can be used over a wide temperature range.16–22 Everything has two sides, ILs also have some main drawbacks such as high viscosity and cost of production. The high viscosity often causes some difficulties in their handling. Bis(trifluoromethylsulfonyl)imide anion (TFSI−) is one of the most popular anions in ILs chemistry which is widely used because it is known to produce ILs with a low melting point and low viscosity (Table S1, ESI†). By comparing cyclic voltammetry (CV) performance of SiCl4 in three different ILs (Fig. S1, ESI†), tri-1-butylmethylammonium bis((trifluoromethyl)sulfonyl)amide ([N4441][TFSI]) IL was adopted in this study. Viscosity–temperature dependency of [N4441][TFSI] was shown in Table S2, ESI.† The viscosity of [N4441][TFSI] decreases to 30.6 mPa s with the temperature increasing to 80 °C. Many pioneering works have been shown that ILs are suited well for the electrodeposition of Si. Endres et al. obtained semiconducting Si films on highly oriented pyrolytic graphite (HOPG) and Au (111) solid electrodes in ILs such as 1-butyl-1-methylpyrrolidinium bis(trifluorom ethylsulfonyl)amide ([Py14] TFSI).10,13,23 By using EQCM measurements, Komadina et al. also studied the electrodeposition of Si from trimethyl-n-hexyl ammonium bis-(trifluoromethylsulfonyl)amide([TMHA][TFSI]) ionic liquid, and they found that the deposition of Si occurs via a four-electron reduction step.24 It was also reported by Katayama and co-workers that a thin Si layer can be electrodeposited in 1-ethyl-3-methylimidazolium hexafluorosilicate([EMIM][SiF6]). However, upon exposure to air the deposits reacted completely to SiO2, which makes it difficult to make sure whether the deposit was semiconducting or not.25 To the best of our knowledge, there is still no report on crystalline Si directly electrodeposited from ILs at low temperature. Herein, we reported data demonstrating the use of hydrophobic [N4441][TFSI] IL and Ga liquid metal electrode as a platform for direct electrodeposition of crystalline Si from the dissolved SiCl4 precursor under benign conditions.
2. Experimental
2.1. Materials and chemicals
Lithium bis(trifluoromethylsulfonyl)imide was purchased from SCM Industrial Chemical Co. Ltd. Butyltrimethylammonium chloride was purchased from Anhui benma apex technology Co. Ltd. Silicon tetrachloride (SiCl4, 99.998%) was purchased from Alfa Aesar. Gallium (Ga, 99.99%) was purchased from Aladdin. All the chemicals used in this work were purchased commercially with analytic grade and used as received.2.2. Preparation and characterization of [N4441][TFSI]
[N4441][TFSI] was prepared by mixing the aqueous solutions of butyltrimethylammonium chloride (1 mol) and lithium bis(trifluoromethylsulfonyl)imide (1.05 mol) at room temperature (RT) under magnetic stirring for 3 h. The colorless IL phase at the lower layers was separated with a separatory funnel. The separated IL was washed with ultrapure water for several times to remove the reactants. The [N4441][TFSI] was dried under vacuum for 24 h at 100 °C to remove the volatiles and reduce water contents to under 10 ppm (by Karl-Fischer titration). The processed [N4441][TFSI] IL was stored in a sealed bottle in an argon-filled glove box (MIKROUNA Universal, O2 below 1 ppm, H2O below 1 ppm). The viscosity of [N4441][TFSI] was measured with an automated microviscometer (Anton Paar AMVn, Anton Paar Co., Austria) with relative expanded uncertainty Ur(η) = 0.005 (0.95 level of confidence). Calibration was performed using viscosity standard oils (No. H117, Anton Paar Co.). The temperature of the sample was maintained to ±0.1 K via a built-in precise Peltierthermostat.2.3. Electrodeposition of Si
A single compartment electrochemical cell with three electrodes (Fig. S2, ESI†) was used to probe the electrochemical window and electrodepositing behavior of Si. A quartz beaker of 50 ml was used as the electrochemical cell. 400 μL Ga (l) pool was employed as the working electrode (ca. 0.785 cm2 active area). Pt wire (99.99%, 0.5 mm in diameter) coated by a heat shrink tube was dipped into the liquid gallium for electrical connection. A Pt plate (99.99%, 10 mm × 20 mm × 0.1 mm) was used as counter electrode. Ag electrode (silver wire with 99.99% in purity and 0.5 mm in diameter) was used as quasi-reference electrode in CV studies. The counter electrode (Pt plate) was mechanically polished with 0.05 μm alumina to a mirror finish and ultrasonically washed in ultrapure water for 3 min, rinsed out with ethanol and finally dried with cold N2 flow. Electrochemical measurements were performed using a CHI660 Electrochemical workstation (Shanghai Chenhua, China). All the electrochemical experiments were carried out in the argon-atmosphere glove box.2.4. Material characterizations
X-ray photoelectron spectra (XPS) were recorded with an X-ray photoelectron spectrometer (Thermo Fisher Scientific, Escalab 250Xi), utilizing a monochromatic Al-Kα X-ray source, hybrid optics and a multi-channel plate and delay line detector coupled to a hemispherical analyzer. All the spectra were recorded using an aperture slot of 300 μm × 700 μm, and high resolution spectra were collected with pass energy of 20 eV. The pressure in the analysis chamber was typically 2 × 10⁻⁹ Torr during data acquisition. All binding energies were referenced to C 1s (284.5 eV) binding energy for data analysis. Raman spectra were obtained on a LabRAM HR800 (514 nm wavelength, 4 mW power, Horiba JobinYVon, France). Raman spectroscopy was simultaneously performed in the ambient atmosphere at RT. Bulk powder X-ray diffractograms (XRD) were collected with Empyrean, PANalytical B. V. equipped with a Cu Kα source (λ = 1.5406 Å). Scanning electron micrographs (SEM) were taken at 5 kV with a Hitachi SU8020 SEM equipped with an SE/BSE detector. Energy dispersive spectra were taken at 20 kV with an Auger electron spectroscopy detector (AES, JAMP-9500F, accelerating voltage: 10 kV, JEOL Ltd.). High-resolution transmission electron microscopy (HRTEM) and selected area electron diffraction (SAED) were performed with a JEM-2100F UHRTEM equipped with a LaB6 source operated at 200 kV.3. Results and discussion
3.1. Electrodeposition of Si
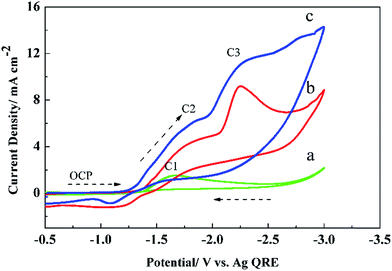
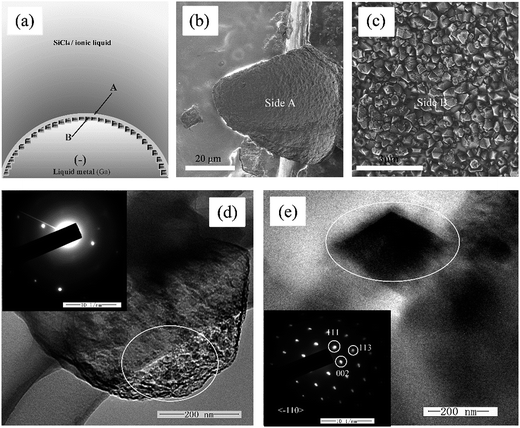
In order to determine the cathodic limit of IL stability and to study Si reduction in SiCl4/[N4441][TFSI], CV was performed. Fig. 1 shows the cyclic voltammetric responses for SiCl4 reduction on Ga liquid metal electrodes at the first negative scan at 100 °C. For the pristine IL, irreversible reduction of the organic cation can be observed at the potential −2.7 V (vs. Ag QRE). A rather weak voltammetric wave (C1) was also observed at approximately −1.39 V which probably was caused by cleavage of the S–N bond in the anion.26 The voltammetry performed in SiCl4 containing ionic liquid (0–500 mM) displayed two main reduction peaks (C2 and C3). The observed cathodic wave (C2) at −1.22 V can be attributed to the underpotential deposition Si on Ga electrode. The peak at round −1.86 V followed by a more negative wave indicated the bulk deposition. For 250 mM SiCl4 containing IL solution, the voltammetric response showed a clear diffusion-limited wave at −2.3 V (vs. Ag QRE), which could be separated from the onset of cathodic solvent decomposition. The present voltammetry data differs from the results reported for the electroreduction of SiCl4 in propylene carbonate.15 In the latter process, diffusion-controlled peak was observed only at lower SiCl4 concentration and lower temperature, such as 100 mM at RT. This indicates that, compared with propylene carbonate organic system, IL [N4441][TFSI] has better electrochemical stability.Potentiostatic electrolysis was used to electrodeposit Si onto liquid metal electrode at −2.3 V (vs. Ag QRE). Fig. 2 shows current–time curves of the electrodeposition process with different electrodepositing time. Formation and growth of the Si crystals in deposition process could be generally divided into three sections: rapid nucleation and growth in the first ten minutes (Part I), crystal growth in the next two hours (Part II) and a period of slow-growing (Part III). In fact, Si electrodeposition differs from metal deposition, the deposited layer is semiconductor which has lower conductivity than metal electrode. The reduced conductivity of working electrode surface would complicate the electron transfer through the deposit and prevent a continuous deposition reaction.27 This could explain that the rapidly decrease of current with time, as observed in Fig. 2. Morphology of the deposited Si was characterized by SEM. Interestingly, two sides (see Fig. 3a) of the deposited Si layer have completely distinct morphological properties. As shown in Fig. 3b and c, side A (face to electrolyte) has a relatively smooth morphology and side B (face to liquid metal electrode) is a polycrystalline layers composed by gathering of nano-sized crystals. TEM and SAED were performed in order to determine the structure difference of the two sides. TEM image and SAED pattern of the side A were shown in Fig. 3d and the inset of Fig. 3d, respectively. Diffraction pattern in Fig. 3d shows that side A, which can be quickly formed at the beginning of the reaction, is amorphous in structure. Fig. 3e shows the TEM image of the crystal grain. Lattice fringes could not be discernable for the large size of the grain. SAED was also used to determine the structure of particles on side B. The observed diffraction pattern showed in the inset of Fig. 3e is consistent with a diamond cubic lattice as expected for a single crystal of Si. TEM and SAED patterns of Si particles and films that electrodeposited for 2 h by this method were also checked (Fig. S3, ESI†). The diffraction characteristics of the deposited samples are similar to that showed in Fig. 3.
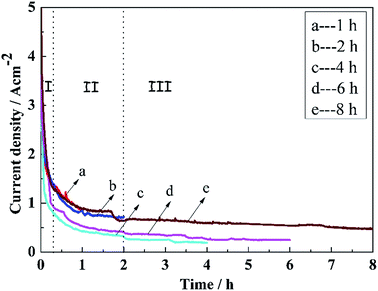 | ||
| Fig. 2 Current–time curves of the potentiostatic electrodeposition process at −2.3 V (vs. Ag QRE) for different time (1 h, 2 h, 4 h, 6 h and 8 h) at 100 °C. The concentration of SiCl4 is 250 mM. | ||
The crystal growth on side B was investigated by electrodepositing for different lengths of time. Fig. 4 shows a series of SEM images of Si deposits on side B. High magnification image shows that Si deposit is spherical silicon particles range from 100 to 500 nm on the amorphous film at the first 10 min (Fig. 4a). Cone-shape particles with dominant size of 0.5–0.8 μm were formed in the next 1 h (Fig. 4b). Every particle showed sharp facets after the electrodeposition for 4 h (Fig. 4c), and gradually grown to polyhedrons, the size is about 2–3 μm in 8 h (Fig. 4d). The increasing of size and sharpness of the crystals were attributed to the using of liquid-metal electrodes which can act as both an electron source for reducing dissolved species in solution and a solvent for re-crystallization, and this process was named electrochemical liquid–liquid–solid (ec-LLS) process.15
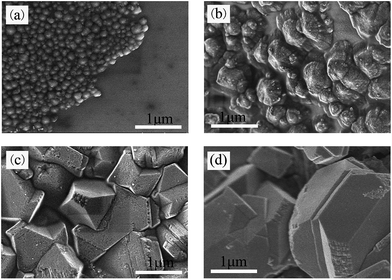 | ||
| Fig. 4 SEM images of the deposits prepared at −2.3 V (vs. Ag QRE) with different depositing time ((a), 10 min; (b), 1 h; (c), 4 h; (d), 8 h) at 100 °C. The concentration of SiCl4 is 250 mM. | ||
3.2. Effect of working electrode disturbance on the morphology of Si deposits
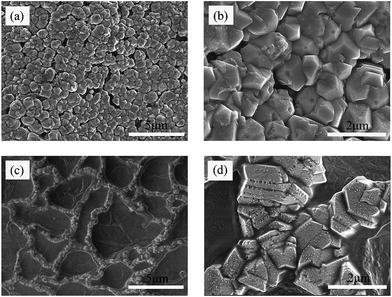
SiCl4 can be electro-reduced to Si at the surface of solid metal electrode and producing amorphous film has been proved previously.13,14 Crystal Si can be electrodeposited from liquid metal electrode by an ec-LLS process also was reported.15 However, deposited Si with two different side was observed in this study and the crystal layer seems grow on the amorphous film. In order to study the catalyst or induced effects of the amorphous film on re-crystallization of Si in the liquid metal,28,29 a magnetic stick was adopted into the liquid metal electrode pool in the electrodeposition process which could rupture the initially formed amorphous film on the surface of the liquid metal electrode. SEM images of the as-electrodeposited Si layer are shown in Fig. 5. Similar to the deposits on static working electrode, uniformly sized crystal particles were consistently observed on an amorphous film with total widths of 1–2 μm (Fig. 5a and b). However, crystal particles produced on stirred working electrode surface grew along a certain line instead of closely packed, showed mesh-like distributing on amorphous film (Fig. 5c and d).The nucleation and growth of Si requires a large amount of energy. Si likely to crystallization and growth in the solid film on the electrode surface rather than inner of the liquid metal electrode because the amorphous Si has nuclei effect. Furthermore, when energy of amorphous surface distributed unevenly, Si in liquid electrode tends to crystallize along the higher energy lines. Amorphous film deposited initially on the liquid metal electrode was cracked and wrinkled by magnetic stirring. In the effect of external electric field, energy distribution on the wrinkled electrodeposited films became more uneven. Crystal preferentially grew on high energy points of the wrinkled films, consequently the Si crystals with continuous net structure were formed. SEM and corresponding element mapping images of Si deposits prepared on the liquid metal electrode without (Fig. S4, ESI†) and with magnetic stirring (Fig. S5, ESI†) are all showed that crystal Si particles are grown on thin film of Si. Furthermore, both amorphous and crystal phases can be observed in the Raman spectrum of the as-prepared Si (Fig. S6, ESI†). From the above discussion, we can reach that amorphous Si film has inductive effect on Si re-crystallization in the ec-LLS process, then the polyhedron crystal particles with sharp facets formed. The lowest temperature demonstrated here (100 °C) significantly favors for better electrodeposition of crystalline Si over both of the previous reports.30,31
3.3. Crystal structures and composition analysis of Si deposits
Crystallographic orientation of the deposited Si in the ionic liquid was determined using XRD. As shown in Fig. 6a, the as-deposited sample at 100 °C yielded sharp diffraction peaks at 2θ = 28.4°, 47.2° and 56.0° which are perfectly matched with the diffraction from the (111), (220) and (311) orientations of crystalline Si with the diamond cubic crystal structure, respectively. The result shows that the deposited Si were polycrystalline without detectable impurity phase and having the preferred crystallographic growth orientation of (111). This crystallization is also confirmed by Raman spectrum of the freshly deposited Si sample. Fig. 6b displays the Raman spectra obtained at 514 nm. High power laser can facilitate crystallization of amorphous Si and affect the judgment of material structure. Spectra obtained by focusing the laser spot with different power from 0.4 to 4.0 mW on the as-deposited Si are compared in Fig. 6b. There is an obvious Raman peak in every curve inspired by different laser powers, which represent the crystalline Si was formed at the electrodepositing process. Raman peaks range from 501 to 508 cm−1 is slightly down-shifted than that of bulk Si at 520 cm−1. Furthermore, the peaks are also red-shifted and dissymmetrical broadened with the increasing of laser power which demonstrated phonon confinement of the crystal Si that may arise from micro-size of crystalline.32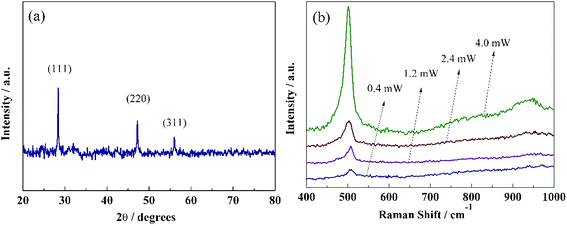 | ||
| Fig. 6 (a) XRD pattern and (b) Raman spectra of the silicon deposit grown at −2.3 V (vs. Ag QRE) at 100 °C in the IL of [N4441][TFSI] containing of 250 mM SiCl4. | ||
Energy-dispersive spectrometry (EDS) elemental mapping image (Fig. 7b) and EDS spectrum (Fig. 7c) revealed that both the micro-crystal grain and amorphous film are mainly the formed Si. The EDS spectrum of the Si deposit also suggests that the deposited Si is quite pure and the amounts of other elements, such as, C and Ga, are related to the process of deposits separation. The successful reduction of silicon tetrachloride to elemental silicon (Si0) was confirmed by X-ray photoelectron spectroscopy (XPS) of the Si deposit (Fig. 7b). The presence of SiO2 in the deposits should be due to the surface oxidization of the Si by air during the transfer of the prepared sample.
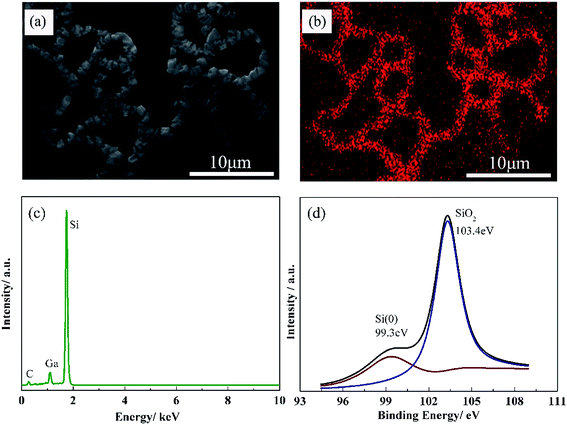 | ||
| Fig. 7 (a) SEM and (b) corresponding EDS elemental mapping images, (c) EDS and (d) XPS spectra of the Si deposited at −2.3 V (vs. Ag QRE). | ||
3.4. Growth mechanism of electrodeposited crystal Si
The mechanism for the direct electrodeposition of crystalline Si on liquid electrode from ILs is complicate, and still unknown so far. We just can propose some possible process by referring to the experimental results and the literatures. As illustrated in Fig. 8, the formation of crystalline Si is divided into 3 stages. At the first stage, oxidized precursor (SiCl4) was electro-reduced to the fully reduced state (Si) at the surface of liquid metal electrode and producing purely amorphous Si film. As the deposition going, the thickness of the amorphous layer quickly increases, making the surface of liquid electrode more resistant and deposit current dropped rapidly (see Fig. 2). The formation of amorphous Si layer by electrodepositing from SiCl4/IL solution has been investigated at solid electrodes previously.10,13,14,23,33,34 The difference is that, when a liquid metal electrode Ga (l) is used, the initially produced Si could be diffused into the liquid Ga phase. According to the published metallurgical data,35 the solubility of Si in Ga between RT and 100 °C ranges from 10−8 to 10−6 at%. At stage II, Si at the interface of amorphous layer and liquid electrode dissolved into Ga (l) and reached saturation and supersaturating conditions with continually reduction of SiCl4 at the electrode surface. When a critical supersaturating conditions reached, phase separation of Si (s) from Ga (l) followed by nucleation would occur. Solubility of Si in Ga (l) is low, amorphous Si-induced crystal separating is more inclined to occur on the interface of amorphous Si and Ga (l). At stage III, as continuous crystallization and oriented attachment going on the inner surface, the polyhedron crystal particles with sharp facets formed. In other words, initially formed amorphous Si layer on the electrode surface might induce the crystallization of Si. Finally, perfect large single crystals were obtained successfully by dissolution and re-precipitation of Si in the stage III. To check the universality of this method for preparation of crystalline Si, N-propyl-N-methyl-piperidinium bis((trifluoromethyl)sulfonyl)imide ([PP13][TFSI]) was also used as electrolyte for the deposition of Si. Crystalline Si (Fig. S7, ESI†) also can be successfully prepared in [PP13][TFSI] at 100 °C.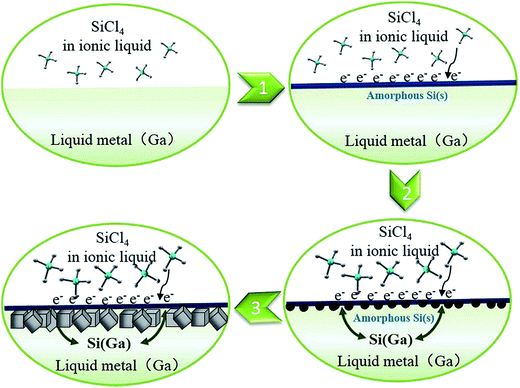 | ||
| Fig. 8 Schematic illustration of crystalline Si formed on the liquid metal electrode from ILs by electrodeposition. | ||
4. Conclusions
In conclusion, we successfully prepared crystalline Si via an appealing low-temperature electrodeposition strategy. Herein, the IL of [N4441][TFSI] and Ga (l) were utilized as electrolyte and liquid-metal electrode, respectively, which are the key factors to fabricate crystalline Si at the mild operating conditions (atmospheric pressure and 100 °C). The [N4441][TFSI] rendered it possible to electrodeposit at low pressure for a long time. Liquid Ga acted as a separate phase for re-crystallization of Si at low temperature. Growth mechanism of crystalline Si was tentatively proposed including first formation of solution of Si in liquid-metal Ga, and following nucleation and growth of crystal Si on the reduced amorphous Si film. We also envision that the synthetic approach can be easily generalized to fabricate high-purity Si directly from SiCl4 or SiHCl3 just with a single step. More significantly, it offers an appealing avenue for scalable, economic and green fabricating process for low-temperature Si metallurgy.Acknowledgements
This work was financially supported by the National Basic Research Program of China (No. 2015CB251401), the National Nature Science Foundations of China (No. 51274181, 21276257), Beijing Municipal Natural Science Foundation (No. 2132054).References
- Y. Cui and C. M. Lieber, Science, 2001, 291, 851 CrossRef CAS PubMed.
- K. Sun, S. H. Shen, Y. Q. Liang, P. E. Burrows, S. S. Mao and D. L. Wang, Chem. Rev., 2014, 114, 8662 CrossRef CAS PubMed.
- Y. Xiao, X. Li, H. D. Um, X. Gao, Z. Guo and J. H. Lee, Electrochim. Acta, 2012, 74, 93 CrossRef CAS.
- W. Simka, D. Puszczyk and G. Nawrat, Electrochim. Acta, 2009, 54, 5307 CrossRef CAS.
- F. Endres, Chem. Ing. Tech., 2011, 83, 1485 CrossRef CAS.
- E. J. Frazer and B. J. Welch, Electrochim. Acta, 1977, 22, 1179 CrossRef CAS.
- T. Nohira, K. Yasuda and Y. Ito, Nat. Mater., 2003, 2, 397 CrossRef CAS PubMed.
- Y. Nishimura and Y. Fukunaka, Electrochim. Acta, 2007, 53, 111 CrossRef CAS.
- T. Munisamy and A. J. Bard, Electrochim. Acta, 2010, 55, 3797 CrossRef CAS.
- S. Z. El Abedin, N. Borissenko and F. Endres, Electrochem. Commun., 2004, 6, 510 CrossRef.
- R. Al-Salman, S. Z. Abedin and F. Endres, Phys. Chem. Chem. Phys., 2008, 10, 4650 RSC.
- Y. Nishimura, T. Nohira, T. Morioka and R. Hagiwara, Electrochemistry, 2009, 77, 683 CrossRef CAS.
- G. Pulletikurthi, A. Lahiri, T. Carstens, N. Borisenko, S. Z. El Abedin and F. Endres, J. Solid State Electrochem., 2013, 17, 2823 CrossRef CAS.
- M. Bechelany, J. Elias, P. Brodard, J. Michler and L. Philippe, Thin Solid Films, 2012, 520, 1895 CrossRef CAS.
- J. S. Gu, E. Fahrenkrug and S. Maldonado, J. Am. Chem. Soc., 2013, 135, 1684 CrossRef CAS PubMed.
- Z. N. Wang, Y. J. Cai, T. Dong, S. M. Chen and X. M. Lu, Ionics, 2013, 19, 887 CrossRef CAS.
- J. P. M. Veder, M. D. Horne, T. Ruther, A. M. Bond and T. Rodopoulos, Electrochem. Commun., 2012, 18, 85 CrossRef CAS.
- L. Liu, X. M. Lu, Y. J. Cai, Y. Zheng and S. J. Zhang, Aust. J. Chem., 2012, 65, 1523 CrossRef CAS.
- Q. Sun, Z. Q. Hu, Y. J. Cai, T. Dong and X. M. Lu, Chin. J. Process Eng., 2012, 12, 340 Search PubMed.
- Y. Zheng, S. J. Zhang, X. M. Lu, Q. Wang, Y. Zuo and L. Liu, Chin. J. Chem. Eng., 2012, 20, 130 CrossRef CAS.
- G. K. Yue, S. J. Zhang, Y. L. Zhu, X. M. Lu, S. C. Li and Z. X. Li, AIChE J., 2009, 55, 783 CrossRef CAS.
- Q. Q. Zhang, Q. Wang, S. J. Zhang and X. M. Lu, J. Solid State Electrochem., 2014, 18, 257 CrossRef CAS.
- N. Borisenko, S. Z. El Abedin and F. Endres, J. Phys. Chem. B, 2006, 110, 6250 CrossRef CAS PubMed.
- J. Komadina, T. Akiyoshi, Y. Ishibashi, Y. Fukunaka and T. Homma, Electrochim. Acta, 2013, 100, 236 CrossRef CAS.
- Y. Katayama, M. Yokomizo, T. Miura and T. Kishi, Electrochemistry, 2001, 69, 834 CAS.
- P. C. Howlett, E. I. Izgorodina, M. Forsyth and D. R. MacFarlane, Z. Physiol. Chem., 2006, 220, 1483 CrossRef CAS.
- W. J. Weydanz, M. W. Mehrens and R. A. Huggins, J. Power Sources, 1999, 81, 237 CrossRef.
- K. Kang, H. S. Lee, D. W. Han, G. S. Kim, D. Lee, G. Lee, Y. M. Kang and M. H. Jo, Appl. Phys. Lett., 2010, 96, 053110 CrossRef.
- S. K. Cho, F. R. F. Fan and A. J. Bard, Angew. Chem., Int. Ed., 2012, 51, 12740 CrossRef CAS PubMed.
- G. M. Rao, D. Elwell and R. S. Feigelson, J. Electrochem. Soc., 1980, 127, 1940 CrossRef CAS.
- W. Xiao, X. Wang, H. Y. Yin, H. Zhu, X. H. Mao and D. H. Wang, RSC Adv., 2012, 2, 7588 RSC.
- S. Piscanec, A. C. Ferrari, M. Cantoro, S. Hofmann, J. A. Zapien, Y. Lifshitz, S. T. Lee and J. Robertson, Mater. Sci. Eng., C, 2003, 23, 931 CrossRef.
- Z. G. Li, H. L. Zhang, J. M. Du, B. X. Han and J. Q. Wang, Colloids Surf., A, 2006, 286, 117 CrossRef CAS.
- F. Bebensee, N. Borissenko, M. Frerichs, O. Hofft, W. Maus-Friedrichs, S. Z. El Abedin and F. Endres, Z. Physiol. Chem., 2008, 222, 671 CrossRef CAS.
- R. W. Olesinski, N. Kanani and G. J. Abbaschian, Bull. Alloy Phase Diagrams, 1985, 6, 362 CrossRef CAS.
Footnote |
| † Electronic supplementary information (ESI) available: Viscosity of ILs, CV in different ILs, schematic illustration of the electrolytic cell, TEM and SAED of the deposits, EDS mapping images, Raman spectrum of Si deposits and SEM images of the deposits prepared from [PP13][TFSI] IL in this study. See DOI: 10.1039/c5ra23085c |
| This journal is © The Royal Society of Chemistry 2016 |

