DOI:
10.1039/C5RA25557K
(Paper)
RSC Adv., 2016,
6, 12068-12075
Energy-efficient degradation of rhodamine B in a LED illuminated photocatalytic fuel cell with anodic Ag/AgCl/GO and cathodic ZnIn2S4 catalysts†
Received
1st December 2015
, Accepted 18th January 2016
First published on 21st January 2016
Abstract
Photocatalytic fuel cells (PFCs) are a newly developed technology that degrade pollutants and simultaneously generate electricity. Stainless steel electrodes loaded with anodic Ag/AgCl/GO and cathodic ZnIn2S4, formed a one-chambered PFC, in which rhodamine B (RhB) was degraded under visible light (2 W LED). After 1 h of irradiation, 87.4% of the RhB was degraded and a 0.52 mA cm−2 current density was generated when the external resistance was 1 Ω. Increasing this resistance lowered the current density and decreased degradation. The current and cell voltage are affected by the degradation efficiency over the electrodes, and the photocatalytic electrode with higher degradation activity functioned as the anode, because of its relatively richer supply of electrons compared to the other. Ag/AgCl/GO can function as a cathode in a two-chambered PFC reactor with Fe as anode, which also had high degradation efficiency and higher electricity generation performance. The characteristics of the photoelectrodes were investigated using scanning or transparent electronic microscopy (SEM, TEM), continuous cyclic voltammograms (CV) and Electrochemical Impedance Spectroscopy (EIS). Electron Spin Resonance (ESR) was used to detect the reactive oxygen species (ROS). The effect of pH and RhB concentration on the degradation performance of this PFC was investigated. The PFCs can work in a broad range of pH.
1. Introduction
The deteriorating situations regarding environmental pollution and an energy crisis have become this generation’s primary concerns, and will probably last into the next generation, due to the discharge of pollutants and the excessive consumption of energy, which negatively impact the environment.1 To overcome these problems in wastewater treatment, new energy-efficient wastewater treatment technologies need to be developed.
One attractive technology which recently emerged is the photocatalytic fuel cell (PFC) which treats waste water using light and produces electricity.2–5 Generally, a PFC consists of an anode loaded with a semiconductor photocatalyst, a cathode carrying a different photo/electro-catalyst and an aqueous electrolyte. Titanium dioxide based catalysts have been used as photoanodes,2,4,6 not only because of its superior stability, low cost and high oxidation power (2.9–3.1 eV),7 but also because it is an n-type semiconductor. However, TiO2-based photoanodes can only be driven using UV light. To increase the light response in the visible range, modifications to the TiO2 are required.
To enhance the anode catalytic activity and PFC performance,8 more effective alternative photocatalysts should be tested. For intensifying degradation, suitable matching of anodic catalysts with more positive VB potential for the anodic oxidation reaction and cathodic catalysts with more negative CB potential for cathodic reduction should be studied.5
Currently, Ag/AgCl, a visible-light-driven plasmonic photocatalyst, displays excellent photocatalytic performance and has been recognized as one of the most promising alternatives to traditional photocatalysts.9–12 The energy gap of Ag/AgCl is 3.25 eV which is comparable with TiO2 (2.9–3.2 eV).13,14 The distinct surface plasmon resonance (SPR) absorption over a wide range of the visible-light region could be attributed to the existence of metallic Ag nanoparticles. Recently graphene-based composite photocatalysts have received increasing attention.15–17 Introducing graphene oxide (GO) into the synthesis of Ag/AgCl as capping agent or catalyst promoter improved the catalytic performance, because of its abundant oxygen-containing functional groups such as hydroxyl, epoxide, carbonyl, carboxyl, etc. The hybrid Ag/AgCl/GO plasmonic photocatalyst has excellent activity toward organic contaminants under visible light. As the valence band (VB) of Ag/AgCl/GO is 3.19 eV (vs. TiO2 3.1 eV), it has a high oxidation power to degrade organic pollutants,14 therefore Ag/AgCl/GO is a suitable alternative to TiO2 as a photoanode catalyst.
In a PFC, the photoanode and cathode are connected through an external circuit. When the cathode is loaded with a photocatalyst, it can be activated to generate electron–hole pairs when illuminated. The generated electrons on the anode transmit to the photocathode via the external circuit, which either recombine with the holes in the photocathode or are consumed by cathodic reactions, while the anode photo-generated holes migrate to the surface and degrade pollutants. The photo-generated electrons may participate in the cathodic reactions, forming H2O or radicals through reducing oxygen, or forming H2 through reducing protons. Hence, an appropriate photocatalyst on the photocathode is important to the performance of a PFC.
ZnIn2S4, with a conduction band (CB) at −0.91 eV,18 is considered suitable for a photocathode. In previous studies,19 ZnIn2S4 had a remarkable hydrogen production rate. It is a very stable and highly active visible light photocatalyst. In addition, ZnIn2S4 film on fluorine doped tin oxide glass prepared through chemical bath deposition (CBD) by Cheng et al. had good photo-electrochemical properties.20
Based on the theoretical suggestions that photoanodes should have a positive VB potential and photocathodes should have a negative CB potential, we constructed a PFC reactor with anodic Ag/AgCl/GO and cathodic ZnIn2S4 to degrade RhB in a one-chambered reactor. In this way, the organic “substrates” can be decomposed and the chemical energy in the organic “substrates” can be converted into electricity simultaneously. To improve the performance of the PFC, photo-electrodes with higher catalytic activities were used. At the same time, to reduce the input power of the PFC, a visible LED light (2 W) was used as the light source.
2. Experimental section
2.1. Materials
Photoelectrodes were prepared using stainless steel mesh (SSM, 500 mesh, Shanghai Suita Filter Material Co., Ltd. China) and coated with photocatalyst. All of the other chemicals used were of analytical grade and used as received. Silicon sol solution was bought from Dalian Sinuo chemical materials science & technology Co., Ltd.
2.2. Preparation of the photocatalysts Ag/AgCl/GO and ZnIn2S4
First, graphene oxide (GO) solution was prepared using a modified Hummers’ method.21 Then, Ag/AgCl/GO photocatalyst was prepared using a two-step method which included a deposition–precipitation reaction and photo-reduction.9,11 In a typical and simple procedure, Ag(NH3)2NO3 solution was used as the Ag source, prepared through dropping ammonia solution (6.9 mL, 25 wt% NH3) into the AgNO3 solution (50 mL, 0.074 mol L−1). A GO aqueous solution (8.4 mL, with a concentration of 1 g L−1) was added drop-wise to the Ag(NH3)2NO3 solution and stirred for 30 min. Subsequently, 4.5 mL of concentrated hydrochloric acid (HCl) was drop-wise introduced into the above solution. After the addition of HCl, the intensive stirring was continued and maintained for 24 h to form a homogeneous suspension. Then, the above solution was mixed with 50 mL of ethanol and irradiated with 100 W tungsten-halogen illumination for 30 min. Then the purple-black product (Ag/AgCl/GO) was collected by centrifugation, washed with deionized water and dried in air.
ZnIn2S4 was synthesized via a hydrothermal method according to our previous research.22
2.3. Preparation of the photoanode and photocathode
The stainless steel mesh was used as the base electrode to support the catalyst. Prior to use, the stainless steel mesh was cut into 2 cm × 5 cm pieces, polished with sandpaper and cleaned ultrasonically in sequence in ethanol, hydrochloric acid (3%) and distilled water (each for 5 min), then dried naturally. The prepared Ag/AgCl/GO photocatalyst was dispersed into a silicon sol solution in a proportion of 1
:
1 (g mL−1) to form a uniform sol. Then the mixed sol was coated on the clean and dried stainless steel substrate with a brush. After brush-coating, the stainless steel mesh was dried in air naturally. The process was repeated three times to prepare the Ag/AgCl/GO-based photoanode. After being brush-coated, the weight of the stainless steel mesh increased by about 0.1 g. The ZnIn2S4-based photocathode was prepared in the same way except using the ZnIn2S4 photocatalyst instead of Ag/AgCl/GO.
2.4. Apparatus for the one-chambered reactor
The performance of the PFC system was studied in a single-chambered reactor with two photoelectrodes. A LED lamp (2 W, brilliant white, φ 18 mm × 25 cm) was chosen as a visible light source and the illumination area was 20 mm × 50 mm. The PFC oxidation reaction under visible light was performed by using the 2 W LED light. In Fig. 1(a), a schematic diagram of the experimental apparatus and electrode assembly for the PFC system is shown. The cell in a quartz tube (φ 30 mm × 18 cm) was equipped with an aeration device, Ag/AgCl/GO-based photoanode and ZnIn2S4-based photocathode. The distance between the anode and cathode was approximately 2.5 cm. The paired photoelectrodes were dipped into an aqueous solution of RhB in 0.1 mol L−1 sodium sulfate. The volume of the reaction solution was 50 mL if not otherwise specified. The initial concentration of RhB was 10 mg L−1 and the initial pH was 7 unless otherwise specified. Prior to irradiation, the photoelectrodes were vertically fixed in the reactor and aerated/stirred for 30 min in the dark to establish the equilibrium of adsorption/desorption. When the system was running, the photoanode and photocathode were connected with 1 Ω resistance and illuminated by LED light of 2 W separately as shown in Fig. 1(a). The values of the cell current and cell voltage were measured using a digital multimeter. All tests were repeated at least three times to ensure reproducibility.
 |
| Fig. 1 A schematic diagram of the photocatalytic fuel cell system. | |
2.5. Apparatus for the two-chambered reactor
The two-chambered PFC was made of quartz glass and each chamber was 100 mm × 50 mm × 200 mm. A cation exchange membrane (DF-120, Shandong Tian Wei membrane technology Co.,118 LTD. China) was sandwiched between the anode and cathode chamber (Fig. S4†). In the PFC reactor with anodic Fe and cathodic Ag/AgCl/GO, the anode is a perforated iron plate (0.1 cm (thickness) × 4 cm (width) × 20 cm (height), aperture diameter 5 mm). The volume of anolyte was 100 mL containing 0.06 mol L−1 of NaHCO3, 0.05 mol L−1 of NaCl, and the initial pH was 5. The catholyte contained 10 mg L−1 of RhB and 0.1 mol L−1 of NaCl. The initial pH was 7. Prior to irradiation, the photoelectrodes were vertically fixed in the reactor, after aeration and stirring for 30 min in the dark, the adsorption/desorption equilibrium was established. Then for normal PFC operation, two LED lights were turned on and the external resistance was 500 Ω.
2.6. Characterization
The morphologies of the as-prepared Ag/AgCl/GO based photoanode and ZnIn2S4 based photocathode were observed using scanning electron microscopy (SEM) and transmission electron microscopy (TEM). The electrochemical properties were characterized through continuous cyclic voltammograms (CV), Linear Sweep Voltammetry (LSV) and Electrochemical Impedance Spectroscopy (EIS) with an electrochemical work station (Chenhua of Shanghai Co., Ltd., China). An electron spin resonance spectrometer (ESR, Bruker Elexsys A200, Germany) was used to characterize the reactive oxygen species (ROS) generated during irradiation. DMPO (20 mM) was used as a spin-trapping agent for the detection of ˙OH and O2˙−.
RhB has commonly been used as a dye, especially as a textile and industrial dye. However, it is potentially toxic and carcinogenic.23 Thus, RhB dye has often been chosen as a representative organic pollutant to evaluate the PC/PEC performances of as-fabricated nano-catalysts.24,25 The concentration of RhB was measured with an ultraviolet-visible spectrophotometer at 554 nm. Potassium permanganate index (CODMn) was measured using the national standard method.
3. Results and discussion
3.1. Structure and morphology of the photocatalysts and photoelectrodes
The morphology of the Ag/AgCl/GO hybrids was observed using SEM and TEM. As shown in Fig. 2(A), Ag/AgCl/GO has a near-spherical morphology with a size of 1–1.8 μm. Ag/AgCl particles are distinctly wrapped with gauze like GO nanosheets (Fig. 2(B)). The SEM image of the Ag/AgCl/GO-coated photoanode indicates a uniform morphology (Fig. 2(C) and (D)). It can be seen that the brush-coated photoanode remains relatively stable and only has a few cracks at the grid intersections. The photocatalysts on the electrode are distributed as fine particles due to particle aggregation. In the UV-visible diffuse reflectance spectra (Fig. S5†), broad and strong absorptions in the visible region were detected, which illustrated that Ag/AgCl/GO had high intensity and wide absorbency which ranged from the UV to visible region due to the presence of GO and reduced Ag which increased the absorbency in the visible range from the SPR (Surface Plasmonic Resonance). In Fig. 2(E) and (F), the ZnIn2S4 particles and ZnIn2S4-coated photocathode are shown. The size of ZnIn2S4 is smaller (about 0.8–1.2 μm).
 |
| Fig. 2 SEM images of Ag/AgCl/GO (A), Ag/AgCl/GO-coated-electrode (C and D), ZnIn2S4 (E), ZnIn2S4-coated-electrode (F); TEM of Ag/AgCl/GO (B). | |
3.2. Properties of the Ag/AgCl/GO-based photoanode and ZnIn2S4-based photocathode
The ORR activities of the photoelectrodes were tested using CV in 0.5 mol L−1 Na2SO4 electrolyte at a scan rate of 50 mV s−1. As shown in Fig. 3(a), Ag/AgCl/GO on the photoelectrode displays clearly redox peak corresponding to excellent redox activity, especially after oxygen purging. The photocatalyst-coated stainless steel wire mesh had better electrochemical activity than the blank stainless steel wire mesh, indicating that the coated photocatalyst could greatly increase the electrochemical activity. The peaks at 0.155 V, 0.68 V and 0.2 V (vs. SCE) confirmed the significant ORR activity of the photoelectrode. But in nitrogen purged electrolyte, the reduction peak current was smaller and the oxidation peak was not obvious. So the presence of dissolved oxygen is advantageous to the redox activity. The oxygen reduction peaks (0.153 V) can be more clearly observed by subtracting the capacitive current from the curve for the oxygen sparged system (inset of Fig. 3(a)).
 |
| Fig. 3 (a) Continuous cyclic voltammograms (CV) of the Ag/AgCl/GO-coated-electrode; (b) EIS changes of our Ag/AgCl/GO and ZnIn2S4 electrodes; (c) linear sweep voltammetric curves of the Ag/AgCl/GO-coated-electrode under visible light and dark conditions. SSM: the stainless steel wire without photocatalyst; Ag/AgCl/GO: the stainless steel wire with Ag/AgCl/GO. | |
EIS is a highly effective method for studying the photoelectrochemical properties of surface-modified electrodes because the arc shape on the EIS Nyquist plot is largely dependent on the composition of the electrode.26 As reported previously, the size of the arc diameter on the EIS Nyquist plots reflected the resistance of electron transfer and the separation efficiency of photoinduced electron–hole pairs at the contact interface between the electrode and electrolyte solution.27,28 In this study, EIS was carried out to investigate the electron transfer resistance controlling the kinetics at the electrode interface, which correspond to the diameter of the arc at higher frequencies in the EIS plane,29–31 as shown in Fig. 3(b). In EIS measurements performed in a 0.5 M Na2SO4 solution at a potential of 0.1 V, the half circle arc diameter of the ZnIn2S4 electrode was smaller, because of its fair conductivity. Both the ZnIn2S4 electrode and the Ag/AgCl/GO electrode had a small arc diameter, indicating good electron accepting and transporting properties of the photoelectrodes, which contribute to the effective charge separation, and subsequently a higher catalytic activity in the degradation of pollutants.
Fig. 3(c) shows the linear sweep voltammetric curves of the Ag/AgCl/GO-based electrode in the dark and under visible light. The LSV curves were obtained in a 0.5 M solution at 50 mV s−1. Clearly, the current intensity under visible light illumination was larger than that in the dark, indicating a photoresponse and current production under visible light.
3.3. Working principle of PFC systems and the performance
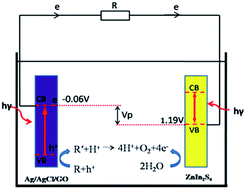
3.3.1 Operating principle of the PFC. The PFC system works because of the mismatched Fermi levels between Ag/AgCl/GO (−0.06 vs. NHE for ECB and +3.19 vs. NHE for EVB) and ZnIn2S4 (−0.91 vs. NHE for ECB and +1.19 vs. NHE for EVB) which provides an interior bias for the PFC (Fig. 1(b)). The high VB of the Ag/AgCl/GO photoanode and low CB of the ZnIn2S4 photocathode cause the potential difference between the electrodes. The higher degradation activity of the Ag/AgCl/GO electrode defines its anodic function for supplying relatively richer electrons than the ZnIn2S4 electrode. Upon irradiation, excited and generated electrons are transported to the cathode through the external circuit, driven by the internal bias. The Ag/AgCl/GO could generate powerful holes to oxidize organics due to its relatively high valence band potential. The holes can degrade RhB directly. At the cathode, the electrons were accepted and consumed by holes and oxygen reduction. Depending on the catalyst and pH, H2O, H2O2 or superoxide radicals may be formed via ORR. This ORR related degradation kinetics and the mechanism need to be further examined, because of possible interaction and involvement in the oxidation reaction of pollutants with ROS on the catalyst surface.
3.3.2 Degradation efficiency, current density of the constructed PFC and its stability. Degradation efficiency and electricity generation are two important parameters to characterize the performance of PFCs. RhB (50 mL, 10 mg L−1) was used to evaluate the performance of the PFC with the Ag/AgCl/GO-based photoanode and ZnIn2S4-based photocathode under visible light (2 W LED). As shown in Fig. 4, 87.4% of the RhB was removed in 60 minutes with an external resistance of 1 Ω. The CODMn was reduced by 58.9%. This proved that RhB could be thoroughly degraded given enough time. If the external resistance is large enough to form a relatively large output voltage, the degradation of RhB would be adversely influenced. RhB degradation depends mainly on the oxidation by holes and hydroxyl radicals. A large external resistance would reduce the amount of electrons transferred from the anode, which would decrease the separation efficiency of h+ and e− in the anode. Only 67.8% of the RhB was degraded in the open circuit PFC. Accordingly, the external resistance of 1 Ω was used in the PFC, the electricity production performance (averaged over the area of the photoanode) was a current density of 0.52 mA cm−2 (Fig. 4(a)). The I–t curve had a slight fluctuation because of the influence of sampling and RhB concentration changes. The observed open circuit voltage under visible light was about 0.35 V. The cycling experiments suggested that the photocatalytic activity decreased slightly after five consecutive cycling tests (Fig. 4(b) and (c)).
 |
| Fig. 4 (a) Degradation efficiency of RhB and the current density of the PFC with an external resistance of 1 Ω (C0 = 10 mg L−1, pH = 7, C(Na2SO4) = 0.1 mol L−1); (b) cycled degradation efficiency of RhB and the CODMn removal rate; (c) current density in the cycling experiment. | |
3.3.3 Electrical energy efficiency. EEO (energy efficiency per order) is usually used to evaluate the treatment costs, which is defined as the electrical energy (kW h) required to reduce the concentration of a pollutant by 1 order of magnitude, in a unit volume of contaminated water.32 As the only energy input was two 2 W LED lights, the EEO calculated for this photoelectrocatalysis system is 38.6 kW h m−3, assuming the full use of all LED light energy by the PFC. Even so, the EEO of our established PFC system was quite low compared with other advanced oxidation processes, which is only 1/27 of a reported value (1075.3 kW h m−3) for photodegradation of diazinon with UV/ZnO (14 nm).33 The power density of the external resistance (1 Ω) was 0.54 W m−3.
3.3.4 The function of cathodic Ag/AgCl/GO in a two-chambered PFC with an Fe anode. In the single-chambered PFC, the anodic Ag/AgCl/GO functioned well for degradation and electricity generation. We found it can also function well as a cathodic catalyst in a two-chambered PFC with Fe as the anode. In the two-chambered reactor, the iron plate anode supplied electrons for the cathodic Ag/AgCl/GO. The cell voltage of the double-chambered PFC was 0.946 V and the potential of the Ag/AgCl/GO cathode was 0.175 V. Compared with the single-chambered PFC with Ag/AgCl/GO and ZnIn2S4, the degraded RhB in one hour increased by 129%, although the degradation efficiency was 54.23% (Fig. 5).
 |
| Fig. 5 Degradation efficiency of RhB and the voltage in the two-chambered PFC with an Fe-anode and a Ag/AgCl/GO-cathode. “Single chamber” refers to the single-chambered PFC with Ag/AgCl/GO and ZnIn2S4 photo electrodes. “Double chamber” refers to the two-chambered PFC with an Fe-anode and a Ag/AgCl/GO-cathode. | |
An ESR spectrum was obtained from a mixture of RhB (10 mg L−1), Na2SO4 (0.1 M) and spin trap DMPO (20 mM) in the anode chamber of the PFC with anodic Ag/AgCl/GO and cathodic ZnIn2S4 catalysts (Fig. S3(a)†). It indicated the actual generation of ˙OH in the process. When Ag/AgCl/GO functioned as the anodic catalyst, ˙OH was formed from the reaction of holes with OH− or H2O and the pollutants were oxidized mainly by ˙OH. In the cathode chamber of the PFC (Fe anode and Ag/AgCl/GO cathode), both DMPO/O2˙− and DMPO/˙OH signals were detectable. That’s because the electrons mainly react with O2 and generate O2˙−, when Ag/AgCl/GO functions as the cathodic catalyst. But O2˙− is sensitive to the presence of protons and it may transform to form H2O2 or ˙OH through a series of reactions.34 So in the cathode chamber, the oxidation of pollutants is mainly by ROS generated from the reductive reaction of electrons with oxygen.
3.3.5 Other possible configurations of PFCs. With anodic Ag/AgCl/GO and cathodic ZnIn2S4, in the two-chambered PFC system (Fig. S2†), the rate constant over the anode was 0.008 min−1 and over the cathode was 0.007 min−1. In the one chambered PFC system, the apparent rate constant (k) was 0.016 min−1, higher than the sum (0.015 min−1) in the two chamber system. PFCs with paired catalysts, Ag/AgCl/GO versus TiO2 and/or TiO2 versus ZnIn2S4 were also tested in the one chamber system (Fig. S1†). Because the CB and VB of TiO2 (−0.1 vs. NHE for ECB and +3.1 vs. NHE for EVB) were almost the same with Ag/AgCl/GO, the cell voltage of Ag/AgCl/GO versus TiO2 was nearly zero in the PFC. The PFC performance of TiO2 versus ZnIn2S4 was comparable to the PFC with Ag/AgCl/GO and ZnIn2S4. A TiO2-electrode can only be excited using UV light. So the one chamber Ag/AgCl/GO–ZnIn2S4 PFC system we constructed was efficient, convenient and more applicable under the visible range.
3.4. Effect of the parameters on the performance of the PFC
3.4.1 Effect of pH. Since there are wide pH ranges in industrial effluents, it is important to study the effects of pH on the degradation of RhB. As already described, 87.4% degradation of RhB was obtained in our PFC with a Ag/AgCl/GO-based photoanode and ZnIn2S4-based photocathode under a neutral pH in 60 minutes (Fig. 6(a)). Under alkaline conditions, 98% and 90% were reached at pH values of 9 and 13 respectively. The enhancement was due to the presence of OH− which helps efficient hole scavenging and the production of hydroxyl radicals. But when the pH was too high, the oxygen evolution may have occurred because of ˙OH radicals (eqn (1)).35 The produced oxygen on the surface of the electrode inhibits adsorption of RhB to the electrode. Thus the degradation of RhB was influenced. |
2˙OH → 2H+ + O2 + 2e−
| (1) |
 |
| Fig. 6 (a) The degradation efficiency of the PFC with different pH; inset: the current density of the PFC with different pH; (b) the kinetic analysis of RhB degradation in the PFC with different pH; (c) the degradation efficiency of the PFC with different initial concentrations of RhB; inset: the current density of the PFC with different initial concentrations of RhB; (d) the kinetic analysis of RhB degradation in the PFC with different initial concentrations of RhB. | |
However in acidic conditions, the degradation efficiency was 97.1% at pH 1 and 93.8% at pH 3. This might be explained by the acid conditions inhibiting oxygen evolution. So the adsorption of RhB would be enhanced. Although decreasing the pH affected the generation of ˙OH to some extent, the generated hydroxyl radicals were enough for the degradation of low concentrations of RhB. After 30 minutes of darkness, the adsorption quantity of RhB increased with an increase in pH value. The kinetic analysis shows that the degradation of RhB follows pseudo-first order (Fig. 6(b)). The apparent rate constants (k) at pH 1, 3, 7, 9 and 13 were 0.019, 0.016, 0.016, 0.044 and 0.03 min−1 respectively. The photogenerated current in the PFC was the highest (about 0.5 mA cm−2) in neutral or basic/alkaline conditions (pH = 7 or 9). When the pH of the solution was too high or too low, the electricity production decreased.
3.4.2 Effect of the initial concentration of RhB. Fig. 6(c) and (d) show the effect of the initial concentration of RhB on the performance of PFC in terms of the degradation efficiency of RhB, and the values of the degradation rate constant which correspond to the slope of the kinetics curves (ln(Ct/C0 − t)). When the initial concentration of RhB increased from 10 mg L−1 to 20 mg L−1, the degradation efficiency was comparable, or even higher. This was because the anodic oxidation rate was higher than the RhB adsorption rate to the anode. The hydroxyl radicals generated were enough to degrade all RhB which diffused to the anode. But with the continued increase of concentration, the RhB adsorption rate was higher. Only part of the RhB on the anode could be degraded in a timely manner. It dropped to 67.6% when the concentration increased to 30 mg L−1. The changes of apparent rate constant with different concentrations of RhB had a similar tendency to the degradation efficiency. The apparent rate constant for 20 mg L−1 was 0.023 min−1 which was higher than the values of 0.016 min−1 for 10 mg L−1 and 0.009 min−1 for 30 mg L−1. The value of the current density with a 10 mg L−1 RhB initial concentration was comparable for that with 30 mg L−1, but it decreased to 0.2 mA cm−2 when the concentration was 20 mg L−1. The electricity production could be influenced by many factors, such as the concentration of the substrate, electrode reaction, adsorption activity on the surface of the electrodes, ions in the electrolyte and so on. In theory, the more sufficient the substrate is, the higher the electricity generated. But in our one chamber system, different concentrations of substrate may lead to other reactions, so when the RhB concentration increased from 10 mg L−1 to 20 mg L−1, the generated electricity decreased.
4. Conclusions
In summary, a stainless steel based PFC with anodic Ag/AgCl/GO and cathodic ZnIn2S4, illuminated by a 2 W LED, efficiently removed RhB (87.4%) with a 1 Ω external resistance (versus the 67.8% removal under OCV). The higher degradation activity of the Ag/AgCl/GO electrode defines its anodic function for supplying a relatively richer amount of electrons than the ZnIn2S4 electrode. The degradation mechanism in the PFC was discussed using ESR studies. The anodic degradation over Ag/AgCl/GO mainly occurs by oxidative holes, while the cathodic degradation over ZnIn2S4 is because of the reduction of oxygen over the conductive band and the formation of oxidative radicals. When the Fe anode supplied electrons, Ag/AgCl/GO functions as a cathodic catalyst and degrades pollutants mainly using O2˙−. The effect of pH and initial RhB concentration on the cell voltage and degradation rate were studied. The single-chambered PFC can operate in a broad range of pH, and low acidic pH or highly alkaline pH can promote degradation. It is efficient, convenient and more applicable under illumination in the visible range.
Acknowledgements
This research is supported by the China National Natural Science Foundation (Project no. 21177018), and the Program of Introducing Talents of Discipline to Universities (B13012).
References
- N. Abdullah and S. K. Kamarudin, J. Power Sources, 2015, 278, 109–118 CrossRef CAS.
- Y. Liu, J. Li, B. Zhou, H. Chen, Z. Wang and W. Cai, Chem. Commun., 2011, 47, 10314–10316 RSC.
- K. Li, H. Zhang, T. Tang, Y. Xu, D. Ying, Y. Wang and J. Jia, Water Res., 2014, 62, 1–10 CrossRef CAS PubMed.
- Y. Liu, J. Li, B. Zhou, X. Li, H. Chen, Q. Chen, Z. Wang, L. Li, J. Wang and W. Cai, Water Res., 2011, 45, 3991–3998 CrossRef CAS PubMed.
- Q. Chen, J. Li, X. Li, K. Huang, B. Zhou, W. Cai and W. Shangguan, Environ. Sci. Technol., 2012, 46, 11451–11458 CrossRef CAS PubMed.
- J. Li, J. Li, Q. Chen, J. Bai and B. Zhou, J. Hazard. Mater., 2013, 262, 304–310 CrossRef CAS PubMed.
- Y. Xu and M. A. Schoonen, Am. Mineral., 2000, 85, 543–556 CrossRef CAS.
- H. Zhang, J. Xuan, H. Xu, M. K. H. Leung, H. Wang, D. Y. C. Leung, L. Zhang and X. Lu, Energy Procedia, 2014, 61, 246–249 CrossRef CAS.
- H. Zhang, X. Fan, X. Quan, S. Chen and H. Yu, Environ. Sci. Technol., 2011, 45, 5731–5736 CrossRef CAS PubMed.
- M. Zhu, P. Chen and M. Liu, ACS Nano, 2011, 5, 4529–4536 CrossRef CAS PubMed.
- M. Zhu, P. Chen and M. Liu, Langmuir, 2013, 29, 9259–9268 CrossRef CAS PubMed.
- W. Li, Z. Ma, G. Bai, J. Hu, X. Guo, B. Dai and X. Jia, Appl. Catal., B, 2015, 174–175, 43–48 CrossRef CAS.
- X. Yao, X. Liu, D. Zhu, C. Zhao and L. Lu, Catal. Commun., 2015, 59, 151–155 CrossRef CAS.
- J. Hou, C. Yang, Z. Wang, Q. Ji, Y. Li, G. Huang, S. Jiao and H. Zhu, Appl. Catal., B, 2013, 142–143, 579–589 CrossRef CAS.
- N. Zhang, Y. Zhang and Y. J. Xu, Nanoscale, 2012, 4, 5792–5813 RSC.
- N. Zhang, M. Q. Yang, S. Liu, Y. Sun and Y. J. Xu, Chem. Rev., 2015, 115, 10307–10377 CrossRef CAS PubMed.
- N. Zhang and Y.-J. Xu, CrystEngComm, 2016, 18, 24–37 RSC.
- B. Gao, L. Liu, J. Liu and F. Yang, Appl. Catal., B, 2014, 147, 929–939 CrossRef CAS.
- Z. Lei, W. You, M. Liu, G. Zhou, T. Takata, M. Hara, K. Domen and C. Li, Chem. Commun., 2003, 2142, 10.1039/b306813g.
- K.-W. Cheng and C.-J. Liang, Sol. Energy Mater. Sol. Cells, 2010, 94, 1137–1145 CrossRef CAS.
- W. S. Hummers Jr and R. E. Offeman, J. Am. Chem. Soc., 1958, 80, 1339 CrossRef.
- B. Gao, L. Liu, J. Liu and F. Yang, Appl. Catal., B, 2013, 129, 89–97 CrossRef CAS.
- J. Zhao, T. Wu, K. Wu, K. Oikawa, H. Hidaka and N. Serpone, Environ. Sci. Technol., 1998, 32, 2394–2400 CrossRef CAS.
- J. Yang, W. Liao, Y. Liu, M. Murugananthan and Y. Zhang, Electrochim. Acta, 2014, 144, 7–15 CrossRef CAS.
- S. Rasalingam, R. Peng and R. T. Koodali, Appl. Catal., B, 2015, 174–175, 49–59 CrossRef CAS.
- X. Yu, Y. Zhang and X. Cheng, Electrochim. Acta, 2014, 137, 668–675 CrossRef CAS.
- Y. Hou, X. Li, Q. Zhao, X. Quan and G. Chen, Environ. Sci. Technol., 2010, 44, 5098–5103 CrossRef CAS PubMed.
- X. Zhao and Y. Zhu, Environ. Sci. Technol., 2006, 40, 3367–3372 CrossRef CAS PubMed.
- H. Liu, S. Cheng, M. Wu, H. Wu, J. Zhang, W. Li and C. Cao, J. Phys. Chem. A, 2000, 104, 7016–7020 CrossRef CAS.
- Y. Fu, P. Xiong, H. Chen, X. Sun and X. Wang, Ind. Eng. Chem. Res., 2012, 51, 725–731 CrossRef.
- S. Chai, G. Zhao, Y. N. Zhang, Y. Wang, F. Nong, M. Li and D. Li, Environ. Sci. Technol., 2012, 46, 10182–10190 CrossRef CAS PubMed.
- N. Daneshvar, A. Aleboyeh and A. R. Khataee, Chemosphere, 2005, 59, 761–767 CrossRef CAS PubMed.
- N. Daneshvar, S. Aber, M. Seyeddorraji, A. Khataee and M. Rasoulifard, Sep. Purif. Technol., 2007, 58, 91–98 CrossRef CAS.
- S. Song, J. Fan, Z. He, L. Zhan, Z. Liu, J. Chen and X. Xu, Electrochim. Acta, 2010, 55, 3606–3613 CrossRef CAS.
- W. Luo, J. G. Muller and C. J. Burrows, Org. Lett., 2001, 3, 2801–2804 CrossRef CAS PubMed.
Footnote |
† Electronic supplementary information (ESI) available. See DOI: 10.1039/c5ra25557k |
|
This journal is © The Royal Society of Chemistry 2016 |
Click here to see how this site uses Cookies. View our privacy policy here.