DOI:
10.1039/C5RA21389D
(Paper)
RSC Adv., 2016,
6, 563-574
Fabrication and performance evaluation of a novel membrane electrode assembly for DMFCs†
Received
14th October 2015
, Accepted 15th December 2015
First published on 17th December 2015
Abstract
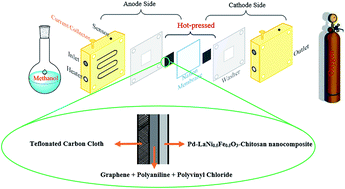
In the current study, a nano-scale perovskite LaNi0.5Fe0.5O3 (LaNi0.5Fe0.5O3NPs) was synthesized by a rapid ultrasonic-assisted co-precipitation method and characterized by various techniques. A modified glassy carbon electrode with Pd nanoparticles (PdNPs) and LaNi0.5Fe0.5O3NPs dispersed into chitosan (CH) polymer was prepared and its catalytic activity toward methanol oxidation was investigated. Based on the electrochemical studies, the PdNPs-LaNi0.5Fe0.5O3NPs-CH nanocomposite showed considerable activity for methanol oxidation in comparison to PdNPs-CH. Then a gas diffusion layer (GDL) was prepared with the ratio of 40% wt graphene carbon and 60% wt polymer mixture (consisting of 35% wt polyvinyl chloride and 65% wt polyaniline) for the micro-porous layer and a teflonated carbon cloth as the macro-porous substrate. A direct methanol fuel cell was designed, assembled and tested with the suggested PdNPs-LaNi0.5Fe0.5O3NPs-CH nanocomposite as anodic catalyst and the synthetic GDL under several different conditions.
1. Introduction
Fuel cells are planned to be reliable candidates for competing against other energy generation sources. During decades of research, different types of fuel cells have been developed. Among these types, the direct methanol fuel cell (DMFC) seems to be promising as a battery replacement for portable electronic devices such as mobile phones and laptops. It has attracted more and more attention due to its long operation time, high energy density, no need for charging and simple system design.1 Methanol as a liquid fuel has many benefits in comparison to hydrogen, including easier production, simpler structure, higher energy content, safer storage/transportation and lower operating temperatures in fuel cells.2 One of the most serious weaknesses associated with the development of DMFCs is poor catalytic activity of the anode catalysts.3 To overcome this problem, many electrocatalysts have been investigated. Among them, Pt is known as the best anode material, but it is expensive and its surface is poisoned by adsorption of methanol oxidation by-products such as carbon monoxide (COads).4 Palladium has a similar lattice constant and valence shell electronic configuration to platinum.5 One promising approach to overcome the high cost and easily accumulation of Pd-based materials is to use nanoscale complex oxides, e.g., perovskites. These compounds have been used as catalytic materials in comprehensive chemical kinetics and electrochemistry as well as in important processes such as: the oxidation of alcohols, electrochemical evolution/reduction of oxygen, reduction of nitrogen oxides, the chemical oxidation of CO and hydrocarbons.6 The catalytic activity toward alcohol oxidation was affected by both the absorption of alcohol as well as the electrical and oxygen ion conductivities of perovskites. The presence of transition metal ions improves the oxidation of alcohol.7 Different polymers like chitosan are very convenient supports for dispersing catalytic materials at the molecular level, in such a way that each catalytic centre will be accessible to the reactive molecules. Chitosan offers great advantages due to its non-toxicity and suitable adhesion to the electrode substrate.8 The addition of chitosan into noble metal containing catalysts can significantly improve the electrode performance for alcohol oxidation. In this study, diverse approaches for the improvement of an effective, low-cost and multifunctional anodic catalyst for direct methanol-based fuel cells followed. In a direct methanol fuel cell, the polymer membrane is sandwiched between two sheets of porous backing media referred to as gas diffusion layers or current collectors. The gas diffusion layer (GDL) is a porous material that facilitates contact between the methanol solution and the anodic catalyst (or the air and the cathodic catalyst).9 Typically, a GDL consists of a macro-porous substrate and a micro-porous layer of carbon. Carbon paper and carbon cloth are usually used as the macro-porous substrate due to its low ohmic resistance and high gas permeability. The studies demonstrated that carbon cloth led higher performance of fuel cell due to less water saturation and higher porosity.10 The micro-porous layer consists of carbon powder and increases electronic conductivity between the catalyst layer and the macro-porous substrate and provides non-permeable support during catalyst deposition.11 There is often hydrophobic agents like polytetrafluoroethylene at the GDL to allow an effective management of water flow (methanol solution in at the anode and water produced at the cathode sides).12 Extensive experimental have done on the micro-porous layer of GDL to investigate the effects of carbon powder types and loadings.13 Graphene is pure carbon and also a suitable candidate for the usage at the micro-porous layer. It is remarkably strong for its very low weight and it conducts heat14 and electricity with great efficiency.
In this study, in order to provide more effective reaction sites for the catalysis; nickel-substituted lanthanides orthoferrite perovskite, LaNi0.5Fe0.5O3 catalysts were synthesized as nano-meter particles (LaNi0.5Fe0.5O3NPs). The activity of Pd nanoparticles (PdNPs) in the presence of LaNi0.5Fe0.5O3NPs into the appropriate amount of chitosan (CH) polymer as multifunctional catalyst for methanol oxidation was evaluated by the electrochemical techniques. The effect of some experimental factors on the anodic current density and the potential of methanol oxidation were studied. Afterwards, the graphene was prepared through a mild and one-step electrochemical approach. Also, the polyaniline was synthesized with the assistance of ammonium persulfate and phenylamine. For GDL preparation, after a number of experiments, we found an appropriate ratio of graphene, polyaniline and polyvinyl chloride (PVC) as the micro-porous layer. The resulting carbon ink was sprayed and deposited onto one side of the carbon cloth pretreated with polytetrafluoroethylene (hydrophobic agent) as the macro-porous substrate. Finally, the functions of PdNPs-LaNi0.5Fe0.5O3NPs-CH and PtNPs-CH nanocomposites as anodic and cathodic catalysts were investigated in single cell and assembled direct methanol fuel cell. The fuel cell polarization curves were plotted for mentioned DMFCs.
2. Experimental
2.1. Materials
All reagents were purchased from Merck Company and used without further purification. A natural polymer, Chitosan, ([2-amino-2-deoxy-(1-4)-β-D-glucopyranose]), with medium molecular weight of 400
000 Da was purchased from Fluka. All solutions were prepared by doubly distilled water. The rods of graphite were purchased from Gioconda Company. The teflonated carbon cloth, commercial GDL and Nafion117 membrane were purchased from Asian Hydrogen New Science Company (H2 Engine Company), manufacturing & development Isfahan science and technology town, Isfahan, Iran.
2.2. Instrumentation
All electrochemical studies were carried out in a conventional three-electrode cell at room temperature. The working electrode substrate was a GC electrode with 0.03 cm2 surface area. A platinum electrode and an Hg/HgO electrode were used as the counter and reference electrodes, respectively. All potentials were measured with respect to this reference electrode. The electrolyte was a mixture of potassium hydroxide (KOH) and the corresponding methanol with a known concentration. A sonicator Euronda-Eurosonic 4D was employed for ultrasound-assisted co-precipitation. X-ray powder diffraction (XRD) analysis was conducted on a Philips analytical PC-APD X-ray diffractometer with graphite monochromatic CuKα radiation (λ = 1.54 Å) to verify the formation of products. The Fourier transform infrared (FT-IR) spectra of the samples were taken using a JASCO-460 FT-IR spectrometer. The surface morphology and the status of the sample were observed with scanning electron microscopy (SEM) and energy dispersive X-ray (EDX) analysis, which was equipped with an SEM instrument (SEM-Philips XL30). TEM image of nanocomposite was taken using a Philips CM120 transmission electron microscopy with 2.50 Å resolution. A Zeiss EM900 transmission electron microscopy with 80 keV energy was used for TEM image of graphene sheet. SEM image of synthetic GDL was taken using a TESCAN VEGA LMU scanning electron microscope. An air brush kit model MBD-116C was employed for spray the micro-porous layer in carbon cloth and nanocatalyst ink on carbon cloth-diffusion layer. The resistance of the samples was measured from the films by the four-point equipment with 1 mm fixed distance between points. The distance between the points was fixed at 1.0 mm. For graphene synthesis, a LEYBOLD power supply model 667827 was employed.
2.3. Preparation of LaNi0.5Fe0.5O3 nanocrystalline
Aqueous solutions of 0.5 M ferric chloride (FeCl3·6H2O), 0.5 M nickel chloride (NiCl2·7H2O) and 1 M lanthanum chloride (LaCl3·7H2O) were prepared and mixed together in 1
:
1 molar ratio. Deionized distilled water was employed as the solvent in order to avoid the production of impurities in the resulted product. 2 ml octanoic acid was added to the mixture as a surfactant. The solution was stirred followed by adding NaOH (1.5 M) drop by drop to keep the pH at 7–8. After complete precipitation, the liquid precipitate was irradiated with ultrasonic waves. The sonication time was found effective in the formation of the crystalline phase of nanoparticle. In our experimental condition were 30 min/60 °C (300 W and 40 kHz). After cooling at room temperature, the resulting products were centrifuged for 15 min at 403 RCF and washed with distilled water and ethanol several times to remove the excess surfactant from the solution and then, were dried at 100 °C for 8 h. The product was calcinated at 800 °C for 4 h to let the product self-ignite and burn off the organic compound in the material. The product was cooled to room temperature and the LaNi0.5Fe0.5O3NPs was obtained.
2.4. Preparation of nanocomposites
A chitosan solution (2 mg mL−1) in 1% acetic acid solution was prepared, due to the poor solubility of the polymer, the mixture was stirred to dissolve entirely and kept for 24 h, and the solution was filtrated to remove any impurity before use. 25 μL 37% HCl solution was added to 5 mg of PdCl2 salt. During this mixture, Pd2+ ions were transformed to PdCl42− that it had better solubility. The result was mixed with a known amount of CH solution using a rotary aperture (100 rpm) for 60 min. Then, 50 μL of freshly prepared aqueous solution of 2.5 M NaBH4 was added to the blend. It was kept stirring for 90 min to achieve complete reduction (eqn (1)) of Pd nanoparticles. |
4NaBH4 + H2PdCl4 → Pd + 4NaCl + 3B2H6 + 3H2
| (1) |
The resulting suspension (PdNPs-CH) was kept at room conditions. 2 mg LaNi0.5Fe0.5O3NPs was mixed with 0.5 mL CH solution using an ultrasonic bath for 15 min (LaNi0.5Fe0.5O3NPs-CH).
2.5. Electrode preparation
The GC electrode with 0.03 cm2 surface area was polished with 0.05 μm alumina slurry to a mirror finish surface and was then rinsed with distilled water. The GC electrode was subsequently sonicated in a mixture of water
:
ethanol (9
:
1 v/v) for 3 min. The GC electrode was cleaned and activated in an electrochemical cell containing 1 M H2SO4 solution by using cyclic voltammetry (CV) technique between −1.5 and +1.5 V at a scan rate of 100 mV s−1 until a stable cyclic voltammetric profile (≈15 times) was obtained (only here, due to acidic media, standard calomel electrode was used as reference electrode). The clean GC electrode was modified with ‘layer by layer’ method. For electrode modification, 10 μL PdNPs-CH was spread by a pipette onto the prepared GC electrode and the electrode was put under infrared radiation for 10 min (GC/PdNPs-CH). Then, 10 μL LaNi0.5Fe0.5O3NPs-CH was spread onto the prepared electrode. The prepared electrode was kept under infrared radiation for 10 min. During this period, the solvent evaporation led to the formation of a deposited catalyst layer on the GC electrode surface (GC/PdNPs-LaNi0.5Fe0.5O3NPs-CH).
2.6. Polyaniline and graphene synthesis
The employed method for synthesizing of the poly aniline polymer was based on described procedures.15 An aqueous solution of (NH4)2S2O8 was added to a solution of aniline dissolved in aqueous HCl (1 M) and was mixed for 1 h at 5 °C. The formed precipitate was removed by filtration, washed with 1 M HCl and dried at room condition. In a typical preparation by Liu et al.,16 the graphene nanosheets were prepared by the electrochemical functionalization of graphite. 40 g poly-phosphoric acid and 200 mL two-distillated water were mixed as the electrolyte. A static potential of 3 V was applied between the two rods of graphite by power supply in prepared electrolyte at room temperature for 10 h. After corrosion, the graphene sheets were obtained at the reactors bottom. The black precipitate was centrifuged for 20 min at 806 RCF and washed with distilled water several times to remove the polyphosphate from the solution. The resulting precipitate was dried at 80 °C for 12 h.
2.7. CO striping
The reaction of CO oxidation on the modified electrodes was evaluated with using the CO stripping technique. CO is adsorbed at a constant potential (∼50 mV) during 15 min. In the following, N2 gas is purged to remove dissolved CO during 30 min. Three potentials scans at 50 mV s−1 between −0.6 and 0.4 V vs. Hg/HgO were recorded for each of the electrodes. The first, second and third scans were recorded before the CO purging, after the N2 injection and after second scan recording, respectively.
2.8. GDL preparation
We carried out a number of experiments to find the proper ratio between graphene (as a base material), polyaniline (as an adhesive and conductive agent) and PVC (as a flexible, hydrophobic agent). They were compared in terms of adhesion, flexibility, hydrophobicity and electrical conductivity. In order to synthesis of carbon ink as micro-porous layer, 0.21 g polyaniline were mixed with a known amount of methylisobutylketone as solvent using ultrasonic waves for 20 min. Then, graphene (for example 0.20 g) and PVC (for example 0.08 g) were added to the suspension. The mixture was sonicated followed by adding solvent drop by drop insofar as the suspension is suitable for spraying. The resulting carbon ink was layer by layer sprayed onto one side of teflonated carbon cloth and followed by drying at 40 °C, consecutively. The synthetic GDL was hot-pressed under the conditions of 85 °C, 200 psi for 1 min. The sheet resistance of three different ratio of graphene
:
polymer, 40
:
60, 60
:
40 and 70
:
30 was 35.4, 24.4 and 19.7 Ω sq−1, respectively. A proper ratio 60
:
40 of the graphene
:
polymer was chosen as optimum because of low adhesive for 70
:
30 and high resistance of 40
:
60 ratio.
2.9. Fuel cell operation
Initially, the prepared of suspension nanocatalysts were sprayed uniformly onto synthetic and commercial GDLs by using the air brush kit. The anodic catalyst loading was (2 mg cm−2) PdNPs–(1 mg cm−2) LaNi0.5Fe0.5O3NPs onto the carbon cloth-diffusion layer (PdNPs-LaNi0.5Fe0.5O3NPs-CH/CC-DL); whiles, the active surface area of the single cells were 5 and 13 cm2. The PtNPs-CH was first prepared as indicated in 2.4 Section from the chloride precursor (PtCl2) (eqn (2)) then sprayed onto GDLs. |
6NaBH4 + H2PtCl6 → Pt + 6NaCl + 3B2H6 + 4H2
| (2) |
The CC-DL with prepared PtNPs-CH with 4 mg cm−2 Pt-loading was used as cathode. A Nafion117 membrane was pretreated by successive dipping in 5% wt H2O2 solution, doubly distilled water, 8% wt H2SO4 solution and finally in doubly distilled water again, at 80 °C, 30 min each step. The membrane and electrode assemblies (MEAs) were made by hot-pressing the anode and the cathode electrodes and membrane in the middle under the conditions of 90 °C, 200 psi for 2 min. The MEAs were assembled in the single cells for performance evaluation. Two different single cells with 5 and 12 cm2 surface area were employed in this study. The flow rate of methanol as fuel was controlled using a peristaltic pump. I–V curves were obtained galvanostatically with an electronic load, EL200P, Daegil, and controlled via a personal computer.
3. Result and discussion
3.1. LaNi0.5Fe0.5O3NPs characterization
Fig. 1A shows the FT-IR spectra of octanoic acid (up), the product before calcination (medial), and LaNi0.5Fe0.5O3NPs perovskite after calcination (bottom), in the frequency range from 4000 to 400 cm−1. In Fig. 1A (up spectrum), the 2600–3000 cm−1 broad band is attributed to the O–H stretching vibration of octanoic acid. While the peak at 1712 cm−1 is the typical band of the carbonyl group. The bands at 1459 and 1379 cm−1 are associated with the bending of CH2 and CH3 bonds respectively. The absorption peaks detected at 1210–1320 cm−1 and 937 cm−1 were attributed to the stretching of C–O and out of plane bending of the O–H group, respectively. For precursor, all infrared bands of octanoic acid are observed but shift to a lower wave number as seen in Fig. 1A (middle spectrum). In the FT-IR spectrum, the final product (bottom spectrum), two strong absorptive bands at nearby 594 and 473 cm−1 were correspond to Fe–O stretching vibration and O–Fe–O bending vibration of LaNi0.5Fe0.5O3NPs, respectively.
 |
| Fig. 1 (A) FT-IR spectra of octanoic acid (up), product before (middle) and after (bottom) calcination, (B) SEM, (C) XRD and (D) EDX of LaNi0.5Fe0.5O3NPs. | |
The size, structure and morphology of the LaNi0.5Fe0.5O3NPs were considered using SEM (see Fig. 1B). The SEM micrograph was approved that the grains were composed of tremendously fine particles and were basically secondary agglomerates of primary particles. It was observed that nanoparticles started to become evident within the grains and agglomerates and sphere-like LaNi0.5Fe0.5O3NPs obtained were uniform in both morphology and size (∼45 nm).
In Fig. 1C shows the XRD pattern of LaNi0.5Fe0.5O3 perovskite. The analysis of XRD pattern showed crystallizes in the orthorhombic system with main diffraction peak at d = 2.75 Å ((1 2 1) plane). No peaks attributable to Fe2O3 weren't observed and the initial compound was decomposed to single-phase LaNi0.5Fe0.5O3, entirely. The sharpening of the peaks is due to the high crystallinity of the LaNi0.5Fe0.5O3NPs. The peak broadening confirmations in XRD patterns were shown that the LaNi0.5Fe0.5O3 particles are nano-size. The mean size of the LaNi0.5Fe0.5O3NPs (D) was estimated by XRD line broadening using the Debye–Scherer equation:17
|
 | (3) |
which
λ is the X-ray radiation wavelength (1.54 Å),
θ is the Bragg angle and
B is the breadth of the observed diffraction line in its half intensity maximum. The mean crystallite size of the LaNi
0.5Fe
0.5O
3NPs was obtained 36.05 nm.
EDX was performed on LaNi0.5Fe0.5O3NPs for more demonstrations. The EDX spectrum given in Fig. 1D shows the presence of lanthanum, nickel and ferric as the component elements.
3.2. The images investigation of PdNPs-LaNi0.5Fe0.5O3Ps-CH, graphene and GDL
Fig. 2A displays the TEM micrograph of the PdNPs-LaNi0.5Fe0.5O3NPs-CH nanocomposite on a scale of 20 nm. It was realized from Fig. 2A that PdNPs were reduced with sizes of 3–6 nm. Due to small particle size, the surface to volume ration may be high. This property is an important parameter for heterogeneous catalysts. The TEM micrograph of a graphene nanosheet has shown in Fig. 2B. It is clear that the length and width of graphene nanosheet were 1.76 and 1.32 μm, respectively. Fig. 2C shows the SEM micrograph of the synthetic GDL.
 |
| Fig. 2 The images (A) TEM of PdNPs-LaNi0.5Fe0.5O3NPs-CH, (B) TEM of Graphene and (C) SEM of synthetic GDL. | |
The two main layers of GDL (macro-porous substrate and the micro-porous layer) are clearly observed in Fig. 2C. The porosity of GDL is typically attributed to carbon cloth structure. For synthetic GDL, as presented in Fig. 2C, micro-porous layer is densely coated on the macro-porous substrate.
3.3. Electrochemical behaviour of GC/PdNPs-LaNi0.5Fe0.5O3NPs-CH electrode
The CV curve of the GC/PdNPs-LaNi0.5Fe0.5O3NPs-CH electrode has obtained (Fig. S1† solid line) in 1 M KOH aqueous solution in the potential range of −1 to 0.4 V vs. Hg/HgO with a scan rate 50 mV s−1. The character of the cyclic voltammograms and the equivalent potentials were in excellent accordance to those reported for noble metal-based catalysts.18 An electron was produced on the surface of PdNPs due to be more positive electrode potential. The anodic peak at E = −0.63 V vs. Hg/HgO is corresponded to desorption of adsorbed hydrogen.19 |
Pd−Habs/ads + OH− → Pd + H2O + e−
| (4) |
The PdNPs oxide such as PdO, PdOH, Pd(OH)2, PdO2, and PdO3 were formed in the positive potential region.20 The peak centering at −0.30 V vs. Hg/HgO was corresponded to the reduction of the palladium(II) oxide during the cathodic sweep.
|
Pd–O + H2O + 2e− → Pd + 2OH−
| (5) |
3.4. Electrochemical active surface area and accelerated durability test of the GC/PdNPs-LaNi0.5Fe0.5O3NPs-CH electrode
One of the functional factors for the determination of catalytic activity is the electrochemical active surface area (EAS) of palladium particles, especially for surface reactions like the oxidation of heterogenic catalysis. The EAS of PdNPs can be calculated by CV techniques in alkaline solution (1 M KOH at room temperature). The voltammogram of H2 adsorption/desorption was used to determine the EAS of PdNPs for the GC/PdNPs-LaNi0.5Fe0.5O3NPs-CH electrode (Fig. S1† solid line). In actuality, the CV curve in the absence of methanol was attributed to the double layer region of the modified electrode. The columbic charge (QH) for hydrogen desorption was employed for calculation the palladium active surface of the electrode. The value of QH was considered as the mean value between the amounts of charge exchanged during the electrochemically adsorption and desorption of H2 on Pd sites. The columbic charge (QH) for hydrogen adsorption/desorption was employed for Pd EAS calculation of the modified electrodes. The QH value is considered as the mean value between the amounts of charge exchanged during the electrochemically adsorption (Q′′H) from −0.6 to −1 V vs. Hg/HgO and desorption (Q′H) from −1 to −0.4 V vs. Hg/HgO of H2 on PdNPs sites according to following equation; |
 | (6) |
It was calculated by measuring the area under the peak at potential rang of hydrogen adsorption/desorption on modified electrodes.21
The EAS was calculated from eqn (7):
|
 | (7) |
In this equation, L is the palladium loading (mg cm−2) on the electrode and S is a parameter relating the charge to area; this is equal to 4.2 C m−2 for palladium. This represents the charge required for oxidation of a monolayer of H2 on PdNPs. The values of QH and calculated EAS has reported for GC/PdNPs-LaNi0.5Fe0.5O3NPs-CH electrode with the palladium loading of 0.31 mg cm−2 in 1 M KOH aqueous solution with a scan rate 50 mV s−1 in Table 1. In the previous work,19 the QH was reported 3.40 mC cm−2 for PdNPs film electrode with a palladium loading 1.10 mg cm−2. It is shown that the addition of LaNi0.5Fe0.5O3NPs to PdNPs-CH nanocomposite increased the EAS amount. As a result, the GC/PdNPs-LaNi0.5Fe0.5O3NPs-CH electrode has an improved dispersion and less size of PdNPs. Tejuca expressed that on oxides with more oxidized metal centres (e.g. Fe and Ni) could be involved in hydrogen adsorption.22 The dispersion of PdNPs was termed as the fraction of surface-active Pd atoms in all of Pd atoms which can be achieved:23
|
 | (8) |
where
MPd is the relative molecular weight of Pd (106.42 g mol
−1),
NA is Avogadro number (6.02 × 10
23) and
rPd is Pd atomic radius (0.14 nm). The
DPd value was obtained 4.99 × 10
−3 m
2 g
−1. Furthermore, accelerated durability test (ADT) of the nanocatalyst was carried out by continuously applying potentials between −1 to 0.4 V with a scan rate 50 mV s
−1 in 1 M KOH after 100 potential cycles. In general, the durability of the modified electrode was tested by performing the potential cycling as ADT in alkaline solution. The voltammogram of H
2 adsorption/desorption was used to determine the change of the PdNPs electrochemical surface area for GC/PdNPs-LaNi
0.5Fe
0.5O
3NPs-CH electrode by comparing H
2 desorption regions before and after 100 potential cycles (Fig. S1
† dash line). The EAS value for the GC/PdNPs-LaNi
0.5Fe
0.5O
3NPs-CH electrode was decreased from 6.63 to 4.78 m
2 g
−1 after the ADT. The obtained %ADT parameter in
Table 1 is calculated from
eqn (9):
|
 | (9) |
Table 1 The calculated results from CV curves of GC/PdNPs-LaNi0.5Fe0.5O3NPs-CH electrode after 1 and 100 cycles sweep with the palladium loading of 0.31 mg cm−2 in 1 M KOH aqueous solution at 50 mV s−1
No. cycle |
QH (mC cm−2) |
EAS (m2 g−1) |
DPd × 10−3 (m2 g−1) |
% loss |
1 |
8.69 |
6.63 |
4.99 |
27.90 |
100 |
6.26 |
4.78 |
3.59 |
It was calculated 27.90% for GC/PdNPs-LaNi0.5Fe0.5O3NPs-CH after 100 potential cycle. It can be seen in Table 1 that the DPd value for the mentioned electrode decreases from 4.99 × 10⁻³ to 3.59 × 10⁻³ m2 g−1 after ADT, indicating a notable decrease of the PdNPs active surface area due to Pd sintering and the dissolution of Pd metal.
The recorded cyclic voltammograms of both modified electrodes during the reaction of CO oxidation are represented in Fig. 3A and B. As it can be seen from Fig. 3, there are three considerable differences for CO oxidation on the GC/PdNPs-CH and GC/PdNPs-LaNi0.5Fe0.5O3NPs-CH modified electrode;
 |
| Fig. 3 CO oxidation (solid line) on modified electrodes: (A) GC/PdNPs-CH and (B) GC/PdNPs-LaNi0.5Fe0.5O3NPs-CH with the palladium loading of 0.31 mg cm−2 at 50 mV s−1 in 1 M KOH solution. The cycles recorded before and after the CO oxidation process are depicted in and line, respectively. | |
(I) The onset potential of the CO stripping peak at the GC/PdNPs-LaNi0.5Fe0.5O3NPs-CH (−0.49 V) shifted by approximately 20 mV to the positive direction compared with that GC/PdNPs-CH (−0.47 V) electrode.
(II) The current density of the CO stripping at GC/PdNPs-LaNi0.5Fe0.5O3NPs-CH (2.00 mA cm−2) increased three times compared with that GC/PdNPs-CH (0.64 mA cm−2) electrode.
(III) The peak potential of the CO stripping at GC/PdNPs-CH (=+0.22 V) shifted by 330 mV to the negative direction compared with that GC/PdNPs-LaNi0.5Fe0.5O3NPs-CH (=−0.11) electrode.
These results can be comparable with the literature.24 Based on Fig. 3A and B, the QCO,ads obtained 0.37 and 0.86 mC cm−2 for GC/PdNPs-CH and GC/PdNPs-LaNi0.5Fe0.5O3NPs-CH electrodes, respectively. This variation is attributed to the removal of CO poisoning on the PdNPs surface by the surface oxygen of the LaNi0.5Fe0.5O3NPs that is in adjacency of metal particles.
The ECSA of the catalysts has been determined by calculating the area under the curve of Pd(II) oxide reduction (Qp) using the following equation:25
|
 | (10) |
where
Qp is the columbic charge in mC and determined by calculating the area under the curve of the Pd(
II) oxide reduction. a proportionality constant, 0.405 mC cm
−2 is assumed for the charge required for reduction of Pd(
II)oxide monolayer and
l is the loading of Pd on the surface of the electrode in mg cm
−2. ECSA values were found to be 1.15 and 8.44 m
2 g
−1 for the first cycle of GC/PdNPs-CH and GC/PdNPs-LaNi
0.5Fe
0.5O
3NPs-CH electrodes, respectively. Also, the ECSA was calculated 6.33 m
2 g
−1 for GC/PdNPs-LaNi
0.5Fe
0.5O
3NPs-CH electrode after 100 cycles. The results show that the ECSA of PdNPs-LaNi
0.5Fe
0.5O
3NPs-CH is higher than PdNPs-CH, indicating higher electrocatalytic activities and more effective utilization of Pd nanoparticles over the surface.
3.5. The investigation of the methanol oxidation on GC/PdNPs-LaNi0.5Fe0.5O3NPs-CH electrode
Electrochemical properties of modified electrode have been investigated by cyclic voltammetry, controlled potential coulometry and anodic Tafel polarization techniques in 0.80 M methanol and 1 M KOH aqueous solution. For comparison of the addition effect of the LaNi0.5Fe0.5O3NPs on the current density and the oxidation potential, palladium loading (=0.31 mg cm−2) is similar on the GC/PdNPs-CH and GC/PdNPs-LaNi0.5Fe0.5O3NPs-CH electrodes.
3.5.1. Cyclic voltammetry. Fig. 4 represents the cyclic voltammograms for the GC/PdNPs-CH and GC/PdNPs-LaNi0.5Fe0.5O3NPs-CH electrodes in 0.80 M methanol and 1 M KOH aqueous solution at a scan rate of 50 mV s−1.
 |
| Fig. 4 The cyclic voltammograms of methanol oxidation on the GC/PdNPs-CH (dash line) and GC/PdNPs-LaNi0.5Fe0.5O3NPs-CH (solid line) electrodes in 0.80 M methanol and 1 M KOH aqueous solution with a scan rate 50 mV s−1. | |
As seen from Fig. 3, two oxidation peaks on the two modified electrodes, which were associated to the oxidation of methanol (Jf) and the corresponding produced intermediates (Jb). Table 2 shows the electrochemical data of the cyclic voltammograms on GC/PdNPs-CH and GC/PdNPs-LaNi0.5Fe0.5O3NPs-CH electrodes for methanol oxidation in 0.80 M methanol and 1 M KOH with a scan rate 50 mV s−1. The onset potential is often invoked to evaluate the efficacy of the electrocatalysts. It is know that in the oxidation of methanol, more negative onset potential is preferable to increase the overall power of the fuel cell.26 As shown in the obtained results for the modified electrodes (Table 2), the corresponding onset potential of the GC/PdNPs-CH electrode decreases according to the GC/PdNPs-LaNi0.5Fe0.5O3NPs-CH electrode with adding the perovskite to the nanocatalyst. This point shows that the LaNi0.5Fe0.5O3FNPs incorporation improves the kinetics of reaction and effects on the start-up of direct methanol fuel cell. The current density of methanol oxidation on GC/PdNPs-LaNi0.5Fe0.5O3NPs-CH electrode (Jf = 19.10 mA cm−2) is comparable with GC/PdNPs-CH electrode (Jf = 4.77 mA cm−2) and the others containing noble metal at similar concentration of methanol as electro-active material.27 This result explains that PdNPs-LaNi0.5Fe0.5O3NPs-CH nanocomposite has superior activity for methanol oxidation in alkaline media. It is clear that both the synergistic effect between PdNPs and structure effects of the LaNi0.5Fe0.5O3NPs enhanced the catalytic activity of the PdNPs-LaNi0.5Fe0.5O3NPs-CH nanocomposite for methanol oxidation. The current density increasing of the methanol oxidation may be attribute to the removal of CO poisoning on the PdNPs surface by the surface oxygen of the LaNi0.5Fe0.5O3NPs perovskite that were in adjacency of metal particles (see ESI† for mechanism of methanol oxidation on PdNPs-LaNi0.5Fe0.5O3NPs-CH nanocomposite). Likely, the catalytic activity of the nanoparticles toward methanol oxidation was affected by both the absorption of methanol as well as the electrical and oxygen ion conductivities of perovskite. The presence of transition metal ions improved the oxidation of methanol. The surface oxygen of the LaNi0.5Fe0.5O3 nanoparticles in adjacency of metal particles removed the CO poisoning on the surface of the palladium nanoparticles. In addition, metal hydroxides formed from hydrolysis can be reduced to metal nanoparticles.
Table 2 The electrochemical data for methanol oxidation as estimated from CV curves of the modified electrodes in 0.80 M methanol and 1 M KOH aqueous solution with a scan rate 50 mV s−1
Electrodes |
Eonset (V vs. Hg/HgO) |
Ef (V vs. Hg/HgO) |
Jf (mA cm−2) |
Eb (V vs. Hg/HgO) |
Jb (mA cm−2) |
GC/PdNPs-CH |
−0.67 |
−0.14 |
4.77 |
−0.30 |
1.71 |
GC/PdNPs-LaNi0.5Fe0.5O3NPs-CH |
−0.88 |
−0.13 |
19.10 |
−0.29 |
10.23 |
3.5.2. Controlled potential coulometry. The addition effect of functionalized LaNi0.5Fe0.5O3NPs to PdNPs-CH nanocomposite on the current density of the methanol oxidation was investigated by chronoamperometry technique for a 0.80 M methanol concentration solution. Fig. 5A displays the chronoamperograms of methanol oxidation on the GC/PdNPs-CH and GC/PdNPs-LaNi0.5Fe0.5O3NPs-CH electrodes at a similar potential (E = 1.4 V vs. Hg/HgO) in 0.80 M methanol and 1 M KOH aqueous solution for time = 50 s. As it was evident in the absence and presence of LaNi0.5Fe0.5O3NPs, the current–time curve was crossed at 138.64 and 251.28 mA cm−2 amounts of current density at start time (t = 0 s), respectively. The amount of exchanged charge is associated with the area under the curve that it was 38.99 and 52.77 mC for methanol oxidation on the GC/PdNPs-CH and GC/PdNPs-LaNi0.5Fe0.5O3NPs-CH electrodes at the time of 50 seconds, respectively. The chronoamperograms show that the exchanged charge was increased in the presence of LaNi0.5Fe0.5O3NPs. Consequently, the composite containing of LaNi0.5Fe0.5O3NPs was showed the higher catalytic activity catalytic for methanol oxidation. The results of chronoamperometry technique were consistent with the obtained previous consequences of cyclic voltammetry technique.
 |
| Fig. 5 (A) The chronoamperograms of methanol oxidation on the (a) GC/PdNPs-CH and (b) GC/PdNPs-LaNi0.5Fe0.5O3NPs-CH electrodes at 1.4 V as. Hg/HgO potential and (B) Tafel curve of GC/PdNPs-LaNi0.5Fe0.5O3NPs-CH electrode potential in 0.80 M methanol and 1 M KOH aqueous solution. | |
3.5.3. Anodic Tafel polarization. The intrinsic activity of PdNPs-LaNi0.5Fe0.5O3NPs-CH nanocomposite towards the methanol oxidation was measured at 50 mV s−1 in room temperature and alkaline media. Fig. 5B shows Tafel curve of methanol oxidation on GC/PdNPs-LaNi0.5Fe0.5O3NPs-CH electrode in 0.80 M methanol and 1 M KOH aqueous solution at the potential range of −2 to 0 V vs. Hg/HgO with a scan rate 50 mV s−1. The values of the exchange current density (J0) and polarization resistance (Rp) were obtained by extrapolating the Tafel line to the equilibrium potential (Eeq = −0.98 V vs. Hg/HgO) for the methanol oxidation reaction. The amount of the Tafel slope (β = 0.10 V dec−1) was calculated from the linear portions of a log current density vs. potential plot. It was dependent on the coverage of pre-adsorbed CO on the methanol oxidation as anodic reaction. The value of the Tafel slope suggests that the adsorption of methanol on the rare earth-including catalyst was more difficult compared to that on the noble metals.28 Tripković et al.29 proposed that several factors such as electrode surface structure, surface absorbents, pH values and their interactions affect the measured Tafel slope. The Rp and J0 were calculated 3193 Ω and 0.22 mA cm−2 for the oxidation of the 0.80 M methanol on the GC/PdNPs-LaNi0.5Fe0.5O3NPs-CH electrode. The Rp could be a criterion for charge exchange on the surface anodic catalyst. The J0 value is corrected to the real electrochemical surface area of the GC/PdNPs-LaNi0.5Fe0.5O3NPs-CH electrode.
3.6. The effect investigation of different parameters towards the methanol oxidation
We investigated the methanol oxidation on the GC/PdNPs-LaNi0.5Fe0.5O3NPs-CH electrode at the different conditions such as: the methanol concentration, scan rate and the potential range.
3.6.1. The methanol concentration. The cyclic voltammograms of methanol oxidation on the GC/PdNPs-LaNi0.5Fe0.5O3NPs-CH electrode at the different methanol concentrations were obtained in 1 M KOH aqueous solution and the potential range −1 to 0.4 V vs. Hg/HgO with a scan rate 50 mV s−1 at room temperature. The changes of the peak potential and current density of methanol oxidation at forward and backward sweep were investigated (Fig. S2A†). It could be observed that increasing the methanol concentration up to 0.80 M increases the anodic and cathodic current density and the current density of methanol oxidation did not have any considerable increase in methanol concentrations higher than 0.80 M. We believe that this effect could be due to the saturation of active sites on the surface of the catalyst. Moreover, the oxidation reaction of methanol on modified electrode is controlled by the diffusion process of methanol towards the catalyst surface.While the methanol concentration increases from 0.08 to 0.80 M, the Ef and Eb shift toward the positive direction from −0.16 to −0.14 V vs. Hg/HgO and −0.34 to −0.29 V vs. Hg/HgO, respectively. This may be attributed to the poisoning of PdNPs catalyst when increasing the methanol concentration and the oxidative removal of the adsorbed intermediates which would shift to a more positive potential. The plot of the logarithm of current density vs. the logarithm of methanol concentration (see also Fig. S2B†) gives the reaction order.30 The reaction order, derived from the slope of the straight line were 0.37 for the positive and 0.77 for the negative sweep for methanol oxidation on the GC/PdNPs-LaNi0.5Fe0.5O3NPs-CH electrode.
3.6.2. The scan rate. The cyclic voltammograms of methanol oxidation on the GC/PdNPs-LaNi0.5Fe0.5O3NPs-CH electrode at the different scan rates: 50–200 mV s−1 were obtained in 0.80 M methanol and 1 M KOH aqueous solution and the potential rang −1 to 0.4 V vs. Hg/HgO at room temperature. Based on the CV curves, the plots of the peak potential vs. ln(ν) (Fig. S3A†) and the anodic peak current density amounts of methanol oxidation vs. the square root of the sweeping rate (Fig. S3B†) has been displayed. The peak potential of methanol oxidation (Ef) amplifies with increasing the scan rate, and a linear relationship (R2 = 0.98) has been obtained between Ef and ln(ν). This shows that the methanol oxidation is an irreversible charge transfer process. The plot of Ep and ln(ν) was a straight line with a slope:31 |
 | (11) |
where α stands for the electron transfer coefficient, characterizing the effect of electrochemical potential on the activation energy of an electrochemical reaction. The slope of Ep vs. ln(ν) plot was 0.02 V. The α value was calculated as 0.80 (n = 6 and T = 20 °C) which is close to 1. This indicates that the methanol oxidation on the GC/PdNPs-LaNi0.5Fe0.5O3NPs-CH electrode has super kinetics. By increasing the applied sweeping rate, the anodic peak current density of methanol oxidation has been increased. The linear relationship (R2 = 0.98) between the square root of the scan rate and the peak current density was estimated further the control of the overall methanol oxidation reaction via the mass transport of the methanol from the bulk solution to the electrode surface.32
3.6.3. The potential rang. The cyclic voltammograms of methanol oxidation on the GC/PdNPs-LaNi0.5Fe0.5O3NPs-CH electrode were obtained in the conditions that the final potential was varied between 0.3 and 0.6 V vs. Hg/HgO in 0.80 M methanol and 1 M KOH aqueous solution with a scan rate 50 mV s−1 at room temperature. Table 3 shows the electrochemical data as estimated from the corresponding CV curves. As the result for the methanol oxidation, with increasing the final potential limit to more positive potentials, Eb and Jb were decreased; whiles it had a negligible effect on Jf and was effectless on Ef. When limit of potential scanning was increased from 0.3 to 0.6 V vs. Hg/HgO, for methanol oxidation, Jf/Jb increased from 1.84 to 4.74 and also, Eb decreased from −0.26 to −0.36 V vs. Hg/HgO. The forward and reverse peak currents ratio (Jf/Jb) has been used to determine the tolerance of the GC/PdNPs-LaNi0.5Fe0.5O3NPs-CH electrode to CO as an intermediate of methanol oxidation. It seems that the increase of the limit of potential scanning decreased the poisoning rate of the PdNPs catalyst. Probably, by increasing the final positive potentials, the conversion of PdNPs to PdO was accelerated and caused a decrease in Ib.33
Table 3 The effect of upper limit of potential in positive direction on methanol oxidation on the GC/PdNPs-LaNi0.5Fe0.5O3NPs-CH in 0.80 M methanol and 1 M KOH aqueous solution
Potential range |
Forward sweep |
Backward sweep |
Ef (V vs. Hg/HgO) |
Jf (mA cm−2) |
Eb (V vs. Hg/HgO) |
Jb (mA cm−2) |
Jf/Jb |
−1 to 0.3 |
−0.14 |
23.35 |
−0.26 |
12.68 |
1.84 |
−1 to 0.4 |
−0.14 |
23.51 |
−0.29 |
9.62 |
2.44 |
−1 to 0.5 |
−0.14 |
22.60 |
−0.33 |
7.65 |
2.95 |
−1 to 0.6 |
−0.14 |
23.45 |
−0.36 |
4.95 |
4.74 |
3.7. The performance investigation of single cells
In order to investigate the improved performance of the PdNPs-LaNi0.5Fe0.5O3NPs-CH catalyst as an oxygen storage component, single cell tests were carried out for the MEA made as the anode, and the PtNPs-CH catalyst as the cathode for CH3OH/O2. The performance of the proposed single cell system depends on the efficiency of the electrochemical reaction at the interface between the solid phase of electrodes (anode and cathode) and liquid and gas phases in anode and cathode sides. The different parameters are the effective on the mentioned reaction. We investigated the effect of different conditions such as: temperature, the concentration of methanol solution as fuel, the flow rate of carrier stream and the concentration of the NaOH in the carrier stream. Also, we compared the performance of the single cell with a commercial GDL and a synthetic GDL at the same condition.
3.7.1. The temperature. In order to investigate the temperature effect on the performance of the fuel cell, various temperatures ranging between 60–90 °C (PO2 = 2 bar; [methanol] = 1 M; flow rate = 1.6 ml min−1; [NaOH] = 0 M and Nafion® 117 membrane) were tested at a single cell with 5 cm2 surface area, and the synthetic GDL. The I–V characteristics have been shown in Fig. 6. The open circuit voltages of the single cells at the different temperatures were 0.79 V at 60 °C, 0.92 V at 70 °C, 0.96 V at 80 °C and 0.95 V at 90 °C. The increasing temperature enhanced the open circuit voltages. After polarization loss, the potential of single cells were stabled at 0.22 V for 60 °C, 0.35 V for 70 °C, 0.39 V for 80 °C and 0.34 V for 90 °C. Also, the observed maximum power density of single cells were 10.10, 16.79, 19.09 and 16.74 mW cm−2 at the 60, 70, 80 and 90 °C temperature, respectively. It can be seen that the increasing temperature improved the single cell performance. This improvement have a higher slope at the temperature changes from 60 to 80 °C. The single cell performance levelled off at temperatures higher than 80 °C.
 |
| Fig. 6 Electrical performances (cell voltage (solid) and power density (hollow) against current density) of 5 cm2 DMFC at different temperatures (○) 60, (Δ) 70, (□) 80 and (◊) 90 °C using the PdNPs-LaNi0.5Fe0.5O3NPs-CH anodic, PtNPs-CH cathodic catalysts and synthetic GDL ([methanol] = 1 M, flow rate = 1.6 ml min−1, [NaOH] = 0 M, PO2 = 2 bar and Nafion® 117 membrane). | |
3.7.2. The methanol concentration. The methanol concentration as fuel has a significant effect on electrical performances such as cell voltage and power density, as one would expect. The polarization curves of the single cell system were obtained for various methanol concentrations (PO2 = 2 bar; temperature = 70 °C; flow rate = 1.6 ml min−1; [NaOH] = 0 M and Nafion® 117 membrane) at a single cell with 5 cm2 surface area, and the synthetic GDL. The polarization curves have been showed at Fig. 7. The open circuit voltages of the single cells were 0.92, 0.95 and 0.98 V for the 1, 2 and 3 M methanol solution, respectively. The effect of the methanol concentration was the positively and negligibly on the open circuit voltage. After polarization loss, the potential of single cells were stabled at 0.35 V for 1 M, 0.39 V for 2 M and 0.41 V for 3 M methanol solution.
 |
| Fig. 7 Electrical performances (cell voltage (solid) and power density (hollow) against current density) of 5 cm2 DMFC at different methanol concentrations (○) 1, (Δ) 2 and (□) 3 M using the PdNPs-LaNi0.5Fe0.5O3NPs-CH anodic, PtNPs-CH cathodic catalysts and synthetic GDL (temperature = 70 °C, flow rate = 1.6 ml min−1, [NaOH] = 0 M, PO2 = 2 bar and Nafion® 117 membrane). | |
The observed maximum power density of single cells were 16.79, 19.20 and 20.01 mW cm−2 at the 1, 2 and 3 M methanol solution, respectively. It is clear that the increasing concentration of methanol solution as fuel increased the single cell performance.
3.7.3. The flow rate of methanol solution. To investigate the effect of flow rate of methanol solution as fuel on the performance of the single cell, the different flow rates (PO2 = 2 bar; [methanol] = 1 M; temperature = 70 °C; [NaOH] = 0 M and Nafion® 117 membrane) were tested at a single cell with 5 cm2 surface area, and the synthetic GDL. The I–V characteristics have been shown in Fig. 8.
 |
| Fig. 8 Electrical performances (cell voltage (solid) and power density (hollow) against current density) of 5 cm2 DMFC at different flow rates (○) 1.6, (Δ) 2.3 and (□) 3.8 ml min−1 using the PdNPs-LaNi0.5Fe0.5O3NPs-CH anodic, PtNPs-CH cathodic catalysts and synthetic GDL (temperature = 70 °C, [methanol] = 1 M, [NaOH] = 0 M, PO2 = 2 bar and Nafion® 117 membrane). | |
The open circuit voltages of the single cells at the different flow rates were 0.92 V at 1.6 ml min−1, 0.93 V at 2.3 ml min−1 and 0.95 V at 3.8 ml min−1. After polarization loss, the potential of single cells were stabled at 0.35 V with 1.6 ml min−1, 0.31 V with 2.3 ml min−1 and 0.33 V with 3.8 ml min−1 flow rate of methanol solution. The observed maximum power density of single cell was increased from 16.79 to 17.61 mW cm−2 when the flow rate of methanol solution was increased from 1.6 to 2.3 ml min−1. The maximum power density of single cell was decreased to 17.53 mW cm−2 at 3.8 M flow rate of methanol solution.
3.7.4. The NaOH concentration. The main advantages of the DMFC include faster methanol oxidation kinetics in an alkaline media than in acidic solutions and the potential to use inexpensive metal catalysts.34 It is known that many catalysts reactions (such as reduction of oxygen and oxidation of methanol) perform better in alkaline electrolytes. It was also discovered that the methanol oxidation in alkaline electrolytes is structure insensitive,35 which opens up the opportunity for use of perovskite-type oxides,36 which are significantly cheaper than Pd and Pt based catalysts, in alkaline fuel cells. Furthermore, the ionic current in the alkaline fuel cell is due to conduction of hydroxide ions. This ionic flow is in the reverse direction to that in proton conducting systems. The hydroxide ions are transported through the membrane electrolyte along a direction of the electro-osmotic drag opposing methanol flow, thus reducing methanol crossover.37 The experimental results show that in the fuel cell, when the pH of fuel was higher, hydrolysis become significant and competed with the direct metal reduction reaction. Metal hydroxides formed from hydrolysis can be reduced to metal nanoparticles. Due to the formation of intermediate hydroxide phase, the nanoparticles formation rate at high pH was limited by the reduction reactions of various hydroxides and their dissolution rates. It is know that CO2 is a by-product in DMFC from methanol oxidation on the anode electrode and can ruin this electrode. One solution is the carbonation of the solution due to CO2 production in alkaline electrolytes in fuel oxidation route as follow: |
2OH− + CO2 → CO32− + H2O
| (12) |
So, the CO2 fouling has been decreased with increasing the NaOH concentration. However, when increasing the NaOH concentration in the fuel carrier stream, the solid precipitation of carbonate salts on the anode electrode has been increased.38 Consequently, this leads to a reduction in reactivity for fuel oxidation in the system.39 Fig. 9 shows the cell performance the different NaOH concentration (PO2 = 2 bar; [methanol] = 1 M; temperature = 70 °C; flow rate = 1.6 ml min−1 and Nafion® 117 membrane) at a single cell with 5 cm2 surface area, the flow path of parallel and the prepared GDL. The open circuit voltages of the single cells at the different NaOH concentrations were 0.92 V for 0 M, 0.90 V for 0.5 M, 0.91 V for 1 M and 0.90 V for 1.5 M. After polarization loss, the potential of single cells were stabled at 0.35 V for 0 M, 0.32 V for 0.5 M, 0.32 V for 1 M and 0.34 V for 1.5 M the NaOH concentration in fuel stream. The observed maximum power density of single cells were 16.79, 39.79, 49.09 and 49.47 mW cm−2 at the 0, 0.5, 1 and 1.5 M the NaOH concentration in the fuel stream, respectively. The efficacy of the NaOH addition to the fuel stream is obvious on the single cell performance through the increasing power density.
 |
| Fig. 9 Electrical performances (cell voltage (solid) and power density (hollow) against current density) of 5 cm2 DMFC at different NaOH concentrations (○) 0, (Δ) 0.5, (□) 1 and (◊) 1.5 M using the PdNPs-LaNi0.5Fe0.5O3NPs-CH anodic, PtNPs-CH cathodic catalysts and synthetic GDL (temperature = 70 °C, [methanol] = 1 M, flow rate = 1.6 ml min−1, PO2 = 2 bar and Nafion® 117 membrane). | |
3.7.5. The gas diffusion layer. To compare the performance of the synthetic and commercial GDLs, the 13 cm2 single cells with two kinds GDLs were tested (PO2 = 2 bar; [methanol] = 1 M; temperature = 70 °C; [NaOH] = 0.5 M; flow rate = 1.6 ml min−1 and Nafion® 117 membrane). The I–V characteristics have been shown in Fig. 10. The open circuit voltages were 1.05 V for single cell with the prepared GDL and 1.24 V for single cell with the commercial GDL. After polarization loss, the potential of single cells were stabled at 0.30 V for single cell with the prepared GDL and 0.43 V for single cell with the commercial GDL. The observed maximum power density were 34.25 and 36.72 mW cm−2 for single cell with the prepared and commercial GDLs, respectively.
 |
| Fig. 10 Electrical performances (cell voltage (solid) and power density (hollow) against current density) of 13 cm2 DMFC using (○) commercial and (Δ) synthetic GDL, the PdNPs-LaNi0.5Fe0.5O3NPs-CH anodic and PtNPs-CH cathodic catalysts (temperature = 70 °C, [methanol] = 1 M, flow rate = 1.6 ml min−1, [NaOH] = 0.5 M, PO2 = 2 bar and Nafion® 117 membrane). | |
Although the prepared GDL had a weaker performance than the commercial GDL; it provided 93.27% obtained power density of the single cell with the commercial GDL. As a result, the prepared GDL can be an appropriate candidate.
4. Conclusions
In this work, PdNPs-LaNi0.5Fe0.5O3NPs-CH nanocomposite was successfully synthesized. The GC/PdNPs-LaNi0.5Fe0.5O3NPs-CH electrode was prepared as active catalyst for methanol oxidation. Our results showed that the addition of LaNi0.5Fe0.5O3NPs into PdNPs catalyst and the use of a more porous matrix of CH can significantly improve the electrode performance for methanol oxidation. The factor influencing PdNPs utilization in the methanol oxidation reaction is intrinsically related to PdNPs formation but using LaNi0.5Fe0.5O3NPs helps in enhancing the DMFC performance with low Pd loading. The fuel cell results indicated that deposited PdNPs-LaNi0.5Fe0.5O3NPs-CH and PtNPs-CH as anodic and cathodic catalyst on the prepared GDL provided adequate electron pathway and improved the oxidation reaction. So that a single cell with 5 cm2 surface area had 49.47 mW cm−2 with 2 mg cm−2 PdNPs and 1 mg cm−2 LaNi0.5Fe0.5O3NPs as anodic catalyst and 4 mg cm−2 PtNPs as cathodic catalyst when PO2 = 2 bar; [methanol] = 1 M; temperature = 70 °C; [NaOH] = 1.5 M; flow rate = 1.6 ml min−1 and Nafion® 117 membrane.
Acknowledgements
We thank University of Sistan and Baluchestan (USB) for financial support.
References
- L. Feng, W. Cai, C. Li, J. Zhang, C. Liu and W. Xing, Fuel, 2012, 94, 401 CrossRef CAS.
- H. R. Corti, in Direct alcohol fuel cells: materials, performance, durability and applications, ed. E. R. Gonzalez, Springer Dordrecht Heidelberg London, New York, 2014 Search PubMed.
- W. Liu, W. Cai, C. Liu, S. Sun and W. Xing, Fuel, 2015, 139, 308 CrossRef CAS.
- E. Antolini, T. Lopes and E. R. Gonzalez, J. Alloys Compd., 2008, 461, 253 CrossRef CAS.
- A. Alexandrovich Serov, S. Y. Cho, S. Han, M. Min, G. Chai, K. Hyun Nam and C. Kwak, Electrochem. Commun., 2007, 9, 2041 CrossRef.
- M. Noroozifar, M. Khorasani-Motlagh, M. S. Ekrami-Kakhki and R. Khaleghian-Moghadam, J. Power Sources, 2014, 248, 130 CrossRef CAS.
- M. Noroozifar, M. Khorasani-Motlagh, R. Khaleghian-Moghadam, M. S. Ekrami-Kakhki and M. Shahraki, J. Solid State Chem., 2013, 201, 41 CrossRef CAS.
- J. Ma and Y. Sahai, Carbohydr. Polym., 2013, 92, 955 CrossRef CAS PubMed.
- H. Guo, X. Liu, J. F. Zhao, F. Ye and C. F. Ma, Appl. Energy, 2014, 136, 509 CrossRef CAS.
- Y. Wang, C. Y. Wang and K. S. Chen, Electrochim. Acta, 2007, 52, 3965 CrossRef CAS.
- S. Park and B. N. Popov, Fuel, 2011, 90, 436 CrossRef CAS.
- L. R. Jordan, A. K. Shukla, T. Behrsing, N. R. Avery, B. C. Muddle and M. Forsyth, J. Power Sources, 2000, 86, 250 CrossRef CAS.
- S. Park, J. W. Lee and B. N. Popov, J. Power Sources, 2006, 163, 357 CrossRef CAS.
- A. Amiri, R. Sadri, M. Shanbedi, G. Ahmadi, B. T. Chew, S. N. Kazi and M. Daharia, Energy Convers. Manage., 2015, 92, 322 CrossRef CAS.
- J. Ch. Chiang and A. G. Macdiarmid, Synth. Met., 1986, 13, 193 CrossRef CAS.
- N. Liu, F. Luo, H. Wu, Y. Liu, C. Zhang and J. Chen, Adv. Funct. Mater., 2008, 18, 1518 CrossRef CAS.
- M. Khorasani-Motlagh, M. Noroozifar and A. Ahanin-Jan, J. Iran. Chem. Soc., 2012, 9, 833 CrossRef CAS.
- F. Alcaide, G. Álvarez, P. L. Cabot, H. J. Grande, O. Miguel and A. Querejeta, Int. J. Hydrogen Energy, 2011, 36, 4432 CrossRef CAS.
- M. Noroozifar, M. Khorasani-Motlagh, M. S. Ekrami-Kakhki and R. Khaleghian-Moghadam, J. Appl. Electrochem., 2014, 44, 233 CrossRef CAS.
- B. Habibi, Int. J. Hydrogen Energy, 2013, 38, 5464 CrossRef CAS.
- C. V. Rao, S. K. Singh and B. Viswanathan, Indian J. Chem., Sect. A: Inorg., Bio-inorg., Phys., Theor. Anal. Chem., 2008, 47, 1619 Search PubMed.
- L. G. Tejuca, Thermochim. Acta, 1988, 126, 205 CrossRef.
- Y. Chen, L. Bai, C. Zhou, J. M. Lee and Y. Yang, Chem. Commun., 2011, 47, 7473 RSC.
- O. V. Cherstiouk, P. A. Simonov, V. I. Zaikovskii and E. R. Savinova, J. Electroanal. Chem., 2003, 554/555, 241 CrossRef.
- G. F. Alvarez, M. Mamlouk, S. M. Senthil Kumar and K. Scott, J. Appl. Electrochem., 2011, 41, 925 CrossRef CAS.
- N. A. M. Barakat, M. Motlak, B. S. Kim, A. G. El-Deen, S. S. Al-Deyab and A. M. Hamza, J. Mol. Catal. A: Chem., 2014, 394, 177 CrossRef CAS.
- Y. Xu and X. Lin, Electrochim. Acta, 2007, 52, 5140 CrossRef CAS.
- V. Raghuveer, K. Ravindranathan Thampi, N. Xanthopoulos, H. J. Mathieu and B. Viswanathan, Solid State Ionics, 2001, 140, 263 CrossRef CAS.
- A. V. Tripković, K. D. J. Popović, J. D. Lović, V. M. Jovanović and A. Kowal, J. Electroanal. Chem., 2004, 572, 119 CrossRef.
- İ. Becerık, S. Sǖzer and F. Kadirgan, J. Electroanal. Chem., 2001, 502, 118 CrossRef.
- H. Tong, H. L. Li and X. G. Zhang, Carbon, 2007, 45, 2424 CrossRef CAS.
- S. N. Azizi, S. Ghasemi and N. S. Salek Gilani, Chin. J. Catal., 2014, 35, 383 CrossRef CAS.
- A. Nozad Golikand, M. Ghannadi Maragheh, S. S. Sherehjini, K. M. Taghi-Ganji and M. Yari, Electroanalysis, 2006, 18, 911 CrossRef.
- J. Kim, T. Momma and T. Osaka, J. Power Sources, 2009, 189, 999 CrossRef CAS.
- Y. Chen, L. Zhuang and J. Lu, Chin. J. Catal., 2007, 28, 870 CrossRef CAS.
- K. Miyazaki, N. Sugimura, K. Matsuoka, Y. Iriyama, T. Abe, M. Matsuoka and Z. Ogumi, J. Power Sources, 2008, 178, 683 CrossRef CAS.
- E. H. Yu and K. Scott, Electrochem. Commun., 2004, 6, 361 CrossRef CAS.
- E. Gǖlzow, J. Power Sources, 1996, 61, 99 CrossRef.
- Y. Wang, L. Li, L. Hu, L. Zhuang, J. Lu and B. Xu, Electrochem. Commun., 2003, 5, 662 CrossRef CAS.
Footnote |
† Electronic supplementary information (ESI) available. See DOI: 10.1039/c5ra21389d |
|
This journal is © The Royal Society of Chemistry 2016 |
Click here to see how this site uses Cookies. View our privacy policy here.