QM/MD simulations on the role of SiO2 in polymeric insulation materials

Baozhong Han*ac, Menggai Jiaob, Chunyang Lia, Chengcheng Zhanga, Zhijian Wub, Ying Wang*ab and Hui Zhanga
aKey Laboratory of Engineering Dielectrics and Its Application (Harbin University of Science and Technology), Ministry of Education, Harbin, 150080, PR China. E-mail: hbzhlj@163.com
bState Key Laboratory of Rare Earth Resource Utilization, Changchun Institute of Applied Chemistry, Chinese Academy of Sciences, Changchun 130022, PR China. E-mail: ywang_2012@ciac.ac.cn
cShanghai Qifan Wire Admdcable Co., LTD., Shanghai 200008, PR China

Received 22nd September 2015 , Accepted 9th December 2015

First published on 11th December 2015


Abstract

Quantum chemical molecular dynamics (QM/MD) simulations based on a self-consistent charge density functional tight-binding (SCC-DFTB) method on SiO2 filler in polyethylene (PE) showed that: in the absence of SiO2, the PE was quickly charged by high-energy electrons, which resulted in C–C or C–H bonds breaking; on the contrary, in the presence of SiO2 nanoclusters, electron trapping and accumulating were dominated by SiO2 nanoclusters rather than polyethylene, which made polyethylene be preferentially protected and increased the initial time of electrical treeing. In our calculations, we also observed double electric layers around the SiO2 nanocluster, in agreement with recent suggestions from experimental observations. Furthermore, compared with some other investigated nanoclusters, SiO2 was regarded as the most promising candidate attributed to the highest electron affinity. We further observed that once the high-energy electrons were supersaturated in the nanoclusters, the polyethylene chains would be unavoidably charged and C–H bond breaking would occur, which resulted from the interaction between H and O or Si in the nanoclusters. Following that, decomposing and cross-linking of the polyethylene chains were involved in the initial growth of electrical treeing. The current observation can potentially be used in power cable insulation.

Introduction

Nowadays, polymeric insulation materials, such as cross-linked polyethylene (XLPE), are widely used in high voltage equipment due to the superiority of their electrical performance. However, it is unavoidable that the polymeric materials will become aged, finally resulting in dielectric breakdown. The main reason for dielectric breakdown is attributed to electrical treeing.1 Significant efforts have been dedicated towards understanding the electrical treeing mechanism and inhibiting electrical treeing formation. Numerous studies have predicted that nano-sized particle fillers, such as SiO2,2–6 MgO,7,8 ZnO,9–11 Al2O3,12 TiO2,13 C60,14–17 and PCBM ([6,6]-phenyl-C61-butyric acid methyl ester),17,18 would be a very promising method in improving the electrical tree resistance and may considerably enhance the transmission efficiency of power grids. Basically, tree initial voltage, tree breakdown voltage, tree initial time, and tree breakdown time are four parameters that have been used to investigate the effectiveness and capabilities of filler to suppress the growth of electrical treeing. Experiments2–6 have found that silica nanofiller prolonged the tree initiation time and increased the tree breakdown voltage; using MgO7,8 or TiO2 (ref. 13) nanoparticles as fillers could increase the tree breakdown time or increase the tree growth time.

Currently, the essential role of nano-composites is explained by the following aspects: the main advantage of using nano-sized particles as a filler was to provide a larger surface area, which is related to the interfacial region of filler and polymer;19 another superiority is that the surface interaction between polymer and nanoparticles affects the electrical properties of the dielectric material.20 Generally, the behaviour of the nanocomposite material is dominated by the properties of the interfaces of the nanoparticles with its surrounding environment. The interfacial region addition of nanoparticles in a polymer matrix can change some of the structural properties such as local charge, local conductivity distribution, free volume, and charge mobility; also, the charge carriers could be trapped more easily by nanoparticles and these additives could scavenge high-energy electrons, which reduces the accumulated damage in the material and avoids the degradation of polyethylene chains,21 thereby increasing the lifetime of the polymer. Moreover, by collision with the nanoparticles, the high-energy electrons will lose energy resulting in the reduction of treeing; nanoparticles can also be responsible for the stability of PE since the PE chains are strongly attracted by the nanoparticle surfaces.

Although the presence of nanoparticles or nanoclusters hindering electrical tree propagation in a polymer matrix has been widely observed in experiments, the essence of the obstacle effect is still not clear. Therefore, further research on electrical treeing and its formation mechanism in nanocomposites are urgently required. In this paper, using quantum chemical molecular dynamics (QM/MD) simulations we focused on the effect of SiO2 nanoclusters on charge redistribution and electron trapping, and investigated the role of SiO2 as a voltage stabilizer for high-voltage power cable insulation. Furthermore, we discussed the interaction between nanoclusters and polyethylene to explain the critical effect of the interfacial region. The current observation can potentially be used to understand the initiation of the treeing mechanism and improve the performance of power cable insulation.

Computational methodology

A. SCCDFTB method

In the present study, all the electronic structure calculations and nonequilibrium quantum chemical molecular dynamics simulations were carried out by the self-consistent-charge density-functional tight-binding method including van der Waals correction (SCCDFTB-D)22 with the DFTB + program package.23 DFTB is an approximate density functional theory method based on the tight binding approach, and utilizes an optimized minimal LCAO Slater-type all-valence basis set in combination with a two-center approximation for Hamiltonian matrix elements. The DFTB quantum chemical potential is ideally suited to bridge the gap between reactive force field approaches and first principles density functional theory (DFT) methods. It is several orders of magnitude faster than the latter but in contrast to the former it explicitly includes electronic effects.

All the nonequilibrium MD simulations in this study were performed based on a quantum chemistry method (QM), i.e. the self-consistent charge density functional tight-binding method. The nuclear equations of motion of nuclei were integrated using the Velocity Verlet algorithm24t = 0.5 fs), and a nuclear temperature of 300 K with the NVT ensemble was maintained via a Nosé–Hoover chain thermostat.25 To achieve convergence a finite electronic temperature approach26 with Te = 300 K was employed to evaluate the quantum chemical potential on the fly. Standard C–C, C–O, C–H, O–O, O–H, H–H, Si–C, Si–O, Si–H and Si–Si DFTB parameters were selected from the mio-0-1 set which is freely available at http://www.dftb.org.

B. IE, EA, and L.I. definitions

Electron affinity (EA) and ionization potential (IP) are commonly used to evaluate the charge injection abilities,27–29 and they were defined as follows,
 
EAv = EMEM−//M (1)
 
IPv = EM+//MEM (2)
 
EAa = EMEM− (3)
 
IPa = EM+EM (4)
where the subscripts v and a represented vertical and adiabatic EA and IP, respectively. EM, EM+, and EM− were the energies of neutral, cationic, and anionic molecules. EM+//M or EM−//M denoted the single point energies of cationic or anionic molecules based on the geometries of neutral molecules. Otherwise, the mobility of electrons and holes was also dominantly determined by reorganization energy λ.30,31 A low λ value is necessary for an efficient charge transport process. Generally, reorganization energy is determined by the fast change of the molecular geometry when a charge is added to or removed from a molecule (the intramolecular reorganization energy λi) and slow variations in the surrounding medium due to the polarization effects (intermolecular reorganization energy λe). The previous reports32,33 have demonstrated that λe is very small and λi is dominant in λ. Therefore, in the present study, we focus on the intramolecular reorganization energy λi, and the intramolecular reorganization energy for hole/electron transfer is simply defined as follows:
 
λih = IPv − HEP (5)
 
λie = EEP − EAv (6)
where HEP or EEP represents hole or electron extraction potential, which was the energy difference between M (neutral molecule) and M+ (cationic), based on M+ geometry or the energy difference between M and M− (anionic), based on M− geometry.

The Lindemann index (L.I.)34 was employed here to analyze the physical state and the mobility of polyethylene and SiO2 nanocomposites, and it is defined as below,

image file: c5ra19512h-t1.tif
where N is the number of atoms in the relevant system, rij is the instantaneous distance between atoms i and j, and the brackets denote thermal averaging over a finite interval of time. The Lindemann index has been used on a number of occasions to elucidate the phase-transitions of transition metals and SiO2 in the context of carbon nanotube or graphene nucleation and growth.35–39

C. Model

Regarding the calculations of EA, IP, HEP, EEP, and λ, the nanocluster spheres with a radius of 10 Å were prepared by cutting from the bulk structures, as shown in Fig. 1. The total numbers of atoms (∼400) were listed in Table 1. In QM/MD simulations, three models were considered. (1) Four molecules of CH3(CH2)38CH3 with a density of 0.925 g cm−3, depicted as PE4, were set up in a periodic boundary box of 15.9 × 15.9 × 15.9 Å3 according to the experimental conditions. (2) and (3) To save the simulation time and to provide the appropriate SiO2 density, two SiO2 spheres with a radius of 3 Å and 4.5 Å, which are almost the smallest nanoclusters of SiO2, were inserted into the above PE model. Thus, the SiO2/PE nanocomposites (C160H328Si6O8 and C160H328Si9O22) with a nanocluster content of 11.6 and 21.2 wt%, as model S and model L, were created. Since these two small nanoclusters are prepared by cutting a sphere from the SiO2 bulk, they do not exactly have 1[thin space (1/6-em)]:[thin space (1/6-em)]2 stoichiometric ratios and therefore, in the discussion section SiO2 is replaced by SixOy to describe the interaction between SiO2 and PE. The cubic periodic boundary boxes of 16.6 × 16.6 × 16.6 and 17.2 × 17.2 × 17.2 Å3 were established to keep a constant density of 0.925 g cm−3. To evaluate the electron trapping ability of a nanocluster, different numbers of electrons (from 1 to 4) were assumed in the two nanocomposite materials (S and L) and the pure PE systems, named as Sn, Ln, and PEn (n = 1–4). Three independent trajectories with different initial velocities for each model were performed using randomized initial conditions. These trajectories were denoted as Smn, Lmn, and PEmn (m = 1–3, and n = 0–4).
image file: c5ra19512h-f1.tif
Fig. 1 The models of nanoparticles for IE and EA estimation. (a) SiO2; (b) Al2O3; (c) Fe2O3; (d) TiO2; (e) CuO; (f) ZnO; (g) C60; (h) C60F; (i) C59N; (j) PCBM.
Table 1 Ionization potentials (IP), electron affinities (EA), hole and electron extraction potentials (HEP and EEP), and internal reorganization energies (λ) (in eV) for the studied complexes. All the nanoparticles are cut as a sphere with a diameter of ∼10 Å from the bulk
  # of atoms IPv EAv IPa EAa λih λie HEP EEP
a From ref. 22.b From ref. 23.c From ref. 24.d From ref. 25.
PE4 488 7.14 −3.61 7.12 0.48 0.03 6.94 7.11 2.29
SiO2 342 7.82 6.65 7.80 6.68 0.04 0.04 7.78 6.70
Al2O3 510 6.16 5.11 6.16 5.11 0.02 0.02 6.14 5.12
Fe2O3 418 2.17 1.17 2.16 1.19 0.02 0.02 2.15 1.20
TiO2 404 4.02 2.92 3.99 2.94 0.05 0.04 3.97 2.96
CuO 418 5.00 3.97 4.99 3.98 0.02 0.02 4.98 3.99
ZnO 356 5.66 4.53 5.65 4.56 0.08 0.05 5.58 4.58
C60 60 6.94 (7.60)a 2.95 (2.67)b 6.94 2.96 0.01 0.03 6.94 2.97
C60F 61 6.85 3.38 6.83 3.41 0.04 0.07 6.81 3.45
C59N 60 6.19 2.81 6.17 2.83 0.03 0.04 6.16 2.84
PCBM 88 6.66 (7.17)c 2.93 (2.63)d 6.59 2.97 0.10 0.07 6.54 3.00


Results and discussion

A. EA and IP

The IP40 and EA41 of the additives are correlated with the voltage stability, the electrical treeing, and dielectric strength of the polymeric insulation materials. It has been proven that a high electron affinity of the additives can increase the breakdown field by trapping electrons to delay the formation of an electron avalanche42 and the breakdown strength of LDPE (low density polyethylene) films.43 Additionally, experimental and theoretical studies have already identified that high electron affinity and ionization energies were the necessary criteria for efficient electrical tree inhibition.41,44 Therefore, in this study we calculated the vertical IP (IPv), adiabatic IP (IPa), vertical EA (EAv), and adiabatic EA (EAa), as well as the hole or electron extraction potentials and internal reorganization energies (HEP or EEP and λih or λie, which are related to the mobility of holes and electrons) of some additive nanoclusters investigated frequently in the experiments, such as fullerenes and their devices (C60, C60F, C59N, PCBM), and some other metal oxides (Al2O3, Fe2O3, TiO2, CuO, ZnO). The values are listed in Table 1 and the investigated isolated nanocluster models are shown in Fig. 1. It is obvious that the calculated IP and EA values of C60 and PCBM are very close to the experimental data.45–48 The IP is underestimated by ∼0.6 eV and the EA is overestimated by 0.3 eV, which further confirms the validity of the DFTB method, while DFTB can save extreme amount of the computational source and time. We also found that the EA and IP values range from 1.0–7.0 and 2.0–8.0 eV, respectively. This suggests that altering the nanoclusters is a possible way to tune the charge transfer properties for these complexes. Among all the investigated nanoclusters, it is obvious that SiO2 possesses the largest IP, indicating that it is the most difficult hole injection material. On the other hand, SiO2 has the largest EA, which will contribute to a lower electron-injection barrier. Obviously, the introduction of an electron-injection nanocluster unit to the skeleton of PE would enhance the electron-injection ability. Our calculations indicate that SiO2 is a promising candidate to reduce electrical treeing due to its high IP and EA. Regarding the λih and λie, all the nanoclusters have comparative values of ∼0.05 eV, indicating a similar hole- and electron-transporting rate and excellent transfer balance. However, for PE, the λih is extremely smaller than λie, demonstrating the better hole-transporting performance for this complex. Since SiO2 nanoclusters characterized a potential suppression on electrical treeing, QM/MD simulations were performed for these nano-filler composites.

B. PE decomposition mechanism on SixOy nanoparticles

We will initially discuss our QM/MD simulations on the interaction between SixOy nanoclusters and PE. Fig. 2 shows the optimized neutral structures of three models, PE0, S0, and L0. Employing these optimized structures the 60 ps QM/MD simulations were performed. The final snapshots of all trajectories were provided as ESI (Fig. S1–S3). Since the PE decompositions were similar, here we took four representative trajectories as examples, shown in Fig. 3, to describe the PE decomposing process on SixOy. Three typical procedures can be observed immediately from these figures. First, with the translational and vibrational diffusion of PE and nanoclusters, the O⋯H hydrogen bonds (highlighted in red dashed line) were frequently formed and broken. The same as for S22−, at 3.12 ps the O started to interact with the H in PE (Fig. 3a) and for L30, at 3.65 ps two O gradually connected with two neighbor C–H to finally form a four-membered ring (Fig. 3b). These H bonds will lead to an immobilized polymer interface49 due to the strong attraction of the polymer chains with the nanocluster surfaces. Second, the H (highlighted in orange) transferred from polymer (–CH2–) to nanocluster (Si or O) and the –CH– radical was formed, which is the precursor for the branched structures. Although the hydrogen bonds were only observed between O and H due to the higher electronegativity of O and lower electronegativity of Si, H transferring processes from polyethylene to both Si and O took place. For example, for trajectories S22−, S14−, and S34−, Si–H bonds were formed at 5.62, 8.05, and 6.10 ps, respectively. On the other hand, for L30, an O–H bond came into being at 15.42 ps, as seen in Fig. 3b. Third, Si–C or O–C bonds were formed, as shown in Fig. 3, highlighted in purple (C) and green (O or Si). Following the H-abstraction reaction, the active –CH– radical was easily saturated by Si–C or O–C bonds. Two trajectories of S14− and S34− showed the Si–C formation and one trajectory of L30 exhibited O–C formation at 52.77, 6.10, and 17.10 ps, respectively.
image file: c5ra19512h-f2.tif
Fig. 2 The optimized geometries of three models. (a) PE0; (b) S0 (PE4 + SiO2 nanocluster with a radius of 3.0 Å) and (c) L0 (PE4 + SiO2 nanocluster with a radius of 4.5 Å).

image file: c5ra19512h-f3.tif
Fig. 3 The snapshots of H bond formation between H and O (red dashed line) or H transferring from polymer (CH2) to nanocluster (Si or O), (a) for trajectory 2 of model S2−; (b) for trajectory 3 of model L0; (c) for trajectory 1 of model S4−; (d) for trajectory 3 of model S4−. The reactive H, Si, and C atoms are highlighted by orange, green, and purple circles.

With regards to the PE decomposition process in pure PE, there was a dramatic difference to the nanocluster-filled composites. In the pure PE model, with the number of trapped electrons increasing, the C–C bonds tended to be broken which is, however, not observed in the above nanocluster-filled composites. Fig. 4a depicts the C–C bond breaking procedure for PE11− (PE21− is similar to PE11−). During the 60 ps MD simulations, the C–C bond was continuously wobbling with a C–C distance of ∼2.3 Å, which was elongated by 53.3% compared to the C–C single bond. This C–C bond breaking/elongation was attributed to the repulsion of two negatively charged carbon atoms (−0.41 and 0.40 e), as shown by the red balls in Fig. 4b. This suggests that the C–C bonds were easily activated by the trapped electrons. Fig. 4c describes the average carbon cluster size at 60 ps. It was obvious that for only the pure PE system with one trapped electron (model PE1−), one C40 chain (a total of four C40 chains) decomposing to C24 and C16 is observed. It is noted that for PE31− the broken C–C bond was recovered during the 60 ps MD simulation, however, two C–H bonds were activated, as shown in Fig. 4a (right snapshot). The broken C–H bonds were elongated to 1.87 and 1.85 Å, resulting from the increased repulsive column interaction due to more negatively charged carbon atoms (∼−0.37 e). Consequently, in a pure PE system, without the help of nanoclusters, the redundant electrons were easily localized on certain carbon atoms and gave rise to the breaking of C–C and C–H bonds. Contrarily, in the presence of the SixOy nanoclusters, even with four trapped electrons, there was still no C–C bond disruption and four C40 polyethylene chains were unchanged following the 60 ps MD simulations. It suggests that SixOy filler can redistribute the electrons and prevent the C–C bond from breaking, to further reduce the initial precursor formation of electrical treeing and increase the tree initial time, in agreement with the experimental observation.2–6


image file: c5ra19512h-f4.tif
Fig. 4 The snapshots of C–C bond and C–H bond breaking in model PE. The left is for PE11− and the right is for PE31− (the upper inset two figures are enlarged C–H broken structures); (b) Mulliken charge distribution schematics of PE11− and PE31−; (c) the averaged carbon cluster size at 60 ps, for all systems. The reactivated C and H atoms are highlighted with purple and orange circles.

C. Charge redistribution and double electric layer

Obviously, the introduction of SixOy nanoclusters redistributed the Mulliken charge, which is attributed to the different electronegativity of C, H, Si, and O (2.55, 2.20, 3.44, and 1.90). Taking the average Mulliken charge analysis as an example, shown in Fig. 5, all SixOy nanoclusters possessed negative charges from −2 to −1 depending on the different number of trapped electrons (from 0 to 4 e) and the size of SixOy nanocluster fillers. With respect to the Mulliken charge on polyethylene chains (PE) in the nanocomposites (see Fig. 5b), when the nanocomposites were neutral and trapping one electron, the PE in the S or L model were always positively charged by 1 or 2 (red or black curve) and 0.5 or 1 e (green or orange curve). This promised PE can continuously accept electron-injection to reach a stable neutral-close stage, and thereby a longer time was required for charge building up, delaying the electrical treeing initial growth process, and finally increasing the tree initial time, which is consistent with the experimental observation.2–5 Besides, it is clear that the larger the particle the more negative charge was located on the nanocluster (Fig. 5a S0 vs. L0 and S1− vs. L1−), suggesting that the ability of electron trapping and collision was very dependent on the nanocluster size. Larger nanoclusters or higher filler content led to more positively charged polyethylene, indicating that a larger nanocluster or higher filler content can decrease the initiated rate of electrical treeing more significantly, which agrees well with the experimental observations.50 On the other hand, with the number of trapped electrons increasing from two to four, in the S model, the polyethylene was gradually negatively charged by −0.5, −1.5, and −3 e, while this was still higher than the charge of the pure PE system without nanocluster filling by 0.5–1 e. Therefore, the SixOy nanoclusters can efficiently accumulate electrons and protect polyethylene from electron trapping and collision. Furthermore, the behavior of SixOy nanoclusters can largely decrease the energy of higher-energy electrons by colliding with and trapping them, and thus, to some extent, the dielectric breakdown was relieved.
image file: c5ra19512h-f5.tif
Fig. 5 The Mulliken charge as a function of time on (a) SixOy nanoclusters and (b) PE, in a small model with neutral (S0), trapping one/two/three/four electrons (S1−/S2−/S3−/S4−), and in the large model with neutral and one electron (L0 and L1−).

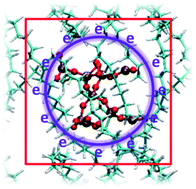
The interface behaviour between the nanoclusters and the polyethylene matrix is important in conductivity, permittivity, and the performance of space charge injection. Based on the interaction zones theory proposed by Lewis,51 there exists an electric double layer around the nanocluster. In our simulations, we indeed observed the existence of the interface charges between nanoclusters and the polymers, as observed in experimental work.52 Fig. 6a and b depicts the averaged RDF (radial distribution function) of Mulliken charge distribution around SixOy nanoclusters for model Sn (n = 0, 1, 2, 3, 4) and Ln (n = 0, 1), and the individual charge distribution for each trajectory is shown in Fig. S2. It is clear that a multi-core model, proposed by Tanaka53 was predicted here. A core-layer, a bound layer, and a free layer were observed in our SiO2 composite filler. As we know that the nanocluster preferred to trap electrons consequently resulting in the redistribution of charge between nanocluster and the polymer matrix. From Fig. 6a we can see that for the neutral and systems with a small amount of charge trapped (with negative charges of −1 and −2) the positive charge was distributed in the core-layer (1–2 Å from the mass center of the SiO2 nanocluster) and the negative charge was located in the outer-layer at 2–3 Å. However, once the nanocomposite trapped too many electrons, such as with four electrons, there were two small positive charge layers available at ∼1.8 and 3 Å. On the other hand, two larger negative charge layers were obviously observed with two peaks at 2 and 4 Å. This alternative positive and negative double electronic layer plays a very important role in explaining its impact on the dielectric properties of polymeric insulations. Considering the size effect, the similarity is that the positive core-layer is far away from the mass center with the number of trapped electrons increasing. The difference is that the peak of the core-level in the L model was higher and closer to the mass center than in the S model, suggesting that the larger the nanocluster the higher the ability to trap electrons, which is also consistent with the above Mulliken charge distribution and the experimental result.50 We also found several separated small peaks for the large nanocluster system. We can deduce that there are large numbers of local charge domains distributed on the surface of the larger SiO2 filler sample.


image file: c5ra19512h-f6.tif
Fig. 6 The RDF of averaged Mulliken charge distribution around SixOy nanoparticles from the mass center to radius of 8.5 Å. (a) For model Sn (n = 0, 1, 2, 3, 4); (b) for model Ln (n = 0, 1).

D. Mobility of polyethylene

Lindemann indexes (δ) for all systems are shown in Fig. 7 and S3. It is typically accepted that δ = 0.1 marks the transition between the solid and liquid phases.54 Fig. 7 shows that polyethylene rapidly undergoes a solid to liquid-like phase transition upon thermal annealing, as indicated by the rapid increase of δ in all systems. Moreover, the increasing rate of pure PE from 10–60 ps was much faster than that of nanocluster filled systems (see Fig. 7a). This indicates that the mobility and the collision ratio were higher in the pure PE system, making electrical treeing more easily initiated. On the contrary, the smaller δ for the SixOy composite filler indicated a more solid-like character, which stabilized the polyethylene and impeded the chain collision. This immobilized interface agreed with the experimental result.49 We also found that the number of trapped electrons can affect the mobility of polyethylene.
image file: c5ra19512h-f7.tif
Fig. 7 The Lindman index (L.I.) of CH atoms, (a) for PE, Sn, and Ln (n = 0, 1); (b) for Sn(n = 0, 1, 2, 3, 4).

When the number of trapped electrons is small, for example one or two, the mobility restriction was stronger with a small value of δ. However, once more electrons were trapped in the systems, the mobility of polyethylene was increased, and δ was even larger than in the pure PE systems. This indicates that the ability to trap electrons on the immobilized polymer interface of SixOy was only valid before “electron saturation”. To get a higher dielectric strength, different sized or various other nanoclusters should be characterized.

Conclusions

SiO2 possessed the highest EA and was identified as an efficient electron-injection materials. In our simulation, we summarized the role of SiO2: first, SiO2 can potently collide with the high energy electrons and decrease their energies due to its high electronegativity; second, SiO2 can efficiently trap the electrons, preventing C–C bonds breaking, and further avoiding the initial precursor growth of electrical treeing; third, Si and O in the SiO2 nanoclusters can interact with the H in PE by hydrogen bonding, restricting the mobility of PE, which can stabilize PE and decrease the collision ability of PE chains, and then prevent the initial branched structure growth to increase the tree initial time. In this paper, we observed the double electronic layer in the atomic scale, and we hope our observations are helpful to understand the electrical treeing mechanism and can subsequently be used in improving the properties of power cable insulation.

Acknowledgements

The authors thank the National Science Foundation of China (grant No. 51337002, 21203174, 21221061, 21273219), the Natural Science Foundation for Distinguished Young Scholars of Heilongjiang Province (JC201409), and the Natural Science Foundation of Jilin Province (No. 20130522141JH, 20150101012JC). The authors also thank the financial support from the Department of Science and Technology of Sichuan Province. The computational resource is partly supported by the Performance Computing Center of Jilin University, China. We are also grateful to the Computing Center of Jilin Province for essential support.

Notes and references

  1. K. Rajagopala, K. P. Vittal and L. Hemsingh, J. Electr. Eng., 2012, 10, 1904–1916 Search PubMed.
  2. R. Kurnianto, Y. Murakami, N. Hozumi and M. Nagao, IEEE Trans. Dielectr. Electr. Insul., 2007, 14, 427–435 CrossRef CAS.
  3. S. Alapati and M. J. Thomas, Presented in part at the Fifteenth National Power Systems Conference (NPSC), IIT Bombay, 2008 Search PubMed.
  4. T. Iizuka and T. Tanaka, Presented in part at the IEEE 9th International Conference on the Properties and Applications of Dielectric Materials, Harbin, July, 2009 Search PubMed.
  5. F. Guastavino, A. Dardano, E. Torello, M. Hoyos, J. M. Gomez-Elvira, P. Tiemblo and A. Ratto, Presented in part at the Annual Report - Conference on Electrical Insulation and Dielectric Phenomena, Vancouver, BC, Oct., 2007 Search PubMed.
  6. M. Nagao, K. Oda, K. Nishioka, Y. Muramoto and N. Hozumi, Presented in part at the Annual Report Conference on Electrical Insulation and Dielectric Phenomena, 2002 Search PubMed.
  7. M. Kawano, Y. Murakami, M. Nagao, Y. Sekiguchi, C. C. Reddy and Y. Murata, Presented in part at the IEEE 9th International Conference on the Properties and Applications of Dielectric Materials, Harbin, July, 2009 Search PubMed.
  8. T. Tanaka, T. Iizuka, Y. Sekiguchi, Y. Murata and Y. Ohki, Presented in part at the IEEE Conference on Electrical Insulation and Dielectric Phenomena, Virginia Beach, Oct., 2009 Search PubMed.
  9. Z. li, K. Okamoto, Y. Ohki and T. Tanaka, IEEE Trans. Dielectr. Electr. Insul., 2011, 18, 675–681 CrossRef CAS.
  10. H. Z. Ding and B. R. Varlow, Presented in part at the Annual Report Conference on Electrical Insulation and Dielectric Phenomena, Oct., 2004 Search PubMed.
  11. A. Rashid, M. Ali and M. Asif, Presented in part at the IEEE 13th International Multitopic Conference, Islamabad, Dec., 2009 Search PubMed.
  12. S. Alapati and M. J. Thomas, IET Sci., Meas. Technol., 2012, 6, 21–28 CrossRef CAS.
  13. D. Pitsa and M. G. Danikas, Presented in part at the International Conference on Power and Energy Systems, Dec., 2011 Search PubMed.
  14. T. D. Anthopoulos, B. Singh, N. Marjanovic, N. S. Sariciftci, A. Montaigne Ramil, H. Sitter, M. Cölle and D. M. de Leeuw, Appl. Phys. Lett., 2006, 89, 213504 CrossRef.
  15. H. Li, B. C. K. Tee, J. J. Cha, Y. Cui, J. W. Chung, S. Y. Lee and Z. Bao, J. Am. Chem. Soc., 2012, 134, 2760–2765 CrossRef CAS PubMed.
  16. S. Rossbauer, C. Müller and T. D. Anthopoulos, Adv. Funct. Mater., 2014, 24, 7116–7124 CAS.
  17. M. Jarvid, A. Johansson, R. Kroon, J. M. Bjuggren, H. Wutzel, V. Englund, S. Gubanski, M. R. Andersson and C. Müller, Adv. Mater., 2015, 27, 897–902 CrossRef CAS PubMed.
  18. P. H. Wöbkenberg, D. D. C. Bradley, D. Kronholm, J. C. Hummelen, D. M. de Leeuw, M. Cölle and T. D. Anthopoulos, Synth. Met., 2008, 158, 468–472 CrossRef.
  19. M. H. Ahmad, N. Bashir, H. Ahmad, A. A. Abd Jamil and A. A. Suleiman, TELKOMNIKA Indonesian Journal of Electrical Engineering, 2014, 12, 5827–5846 Search PubMed.
  20. K. Y. Lau and M. A. M. Piah, Malaysian Polymer Journal, 2011, 6, 58–69 Search PubMed.
  21. N. Shimizu, T. Takahashi and S. Iemura, Presented in part at the IEEE 7th International Conference on Solid Dielectrics, Eindhoven, 2001 Search PubMed.
  22. M. Elstner, D. Porezag, G. Jungnickel, J. Elsner, M. Haugk, T. Frauenheim, S. Suhai and G. Seifert, Phys. Rev. B: Condens. Matter Mater. Phys., 1998, 58, 7260–7268 CrossRef CAS.
  23. B. Aradi, B. Hourahine and T. Frauenheim, J. Phys. Chem. A, 2007, 111, 5678–5684 CrossRef CAS PubMed.
  24. W. C. Swope, H. C. Andersen, P. H. Berens and K. R. Wilson, J. Chem. Phys., 1982, 76, 637–649 CrossRef CAS.
  25. G. J. Martyna, M. L. Klein and M. Tuckerman, J. Chem. Phys., 1992, 97, 2635–2643 CrossRef.
  26. R. M. Wentzcovitch, J. L. Martins and P. B. Allen, Phys. Rev. B: Condens. Matter Mater. Phys., 1992, 45, 11372–11374 CrossRef.
  27. X.-N. Li, Z.-J. Wu, Z.-J. Si, H.-J. Zhang, L. Zhou and X.-J. Liu, Inorg. Chem., 2009, 48, 7740–7749 CrossRef CAS PubMed.
  28. L.-L. Shi, Y. Liao, G.-C. Yang, Z.-M. Su and S.-S. Zhao, Inorg. Chem., 2008, 47, 2347–2355 CrossRef CAS PubMed.
  29. Y. Liu, X. Sun, G. Gahungu, X. Qu, Y. Wang and Z. Wu, J. Mater. Chem. C, 2013, 1, 3700–3709 RSC.
  30. B. C. Lin, C. P. Cheng and Z. P. M. Lao, J. Phys. Chem. A, 2003, 107, 5241–5251 CrossRef CAS.
  31. K. Sakanoue, M. Motoda, M. Sugimoto and S. Sakaki, J. Phys. Chem. A, 1999, 103, 5551–5556 CrossRef CAS.
  32. X.-N. Li, Z.-J. Wu, Z.-J. Si, Z. Liang, X.-J. Liu and H.-J. Zhang, Phys. Chem. Chem. Phys., 2009, 11, 9687–9695 RSC.
  33. X.-N. Li, Z.-J. Wu, X.-Y. Li, H.-J. Zhang and X.-J. Liu, J. Comput. Chem., 2011, 32, 1033–1042 CrossRef CAS PubMed.
  34. F. A. Lindemann, Phys. Z., 1910, 11, 609–612 CAS.
  35. Y. Shibuta and T. Suzuki, Chem. Phys. Lett., 2010, 498, 323–327 CrossRef CAS.
  36. E. C. Neyts and A. Bogaerts, J. Phys. Chem. C, 2009, 113, 2771–2776 CAS.
  37. K. R. S. Chandrakumar, A. J. Page, S. Irle and K. Morokuma, J. Phys. Chem. C, 2013, 117, 4238–4244 CAS.
  38. A. J. Page, K. R. S. Chandrakumar, S. Irle and K. Morokuma, Chem. Phys. Lett., 2011, 508, 235–241 CrossRef CAS.
  39. A. J. Page, K. R. S. Chandrakumar, S. Irle and K. Morokuma, J. Am. Chem. Soc., 2011, 133, 621–628 CrossRef CAS PubMed.
  40. A. C. Ashcraft, R. M. Eichhorn and R. G. Shaw, Presented in part at the IEEE Int. Symp. on Elec. Ins., 1976 Search PubMed.
  41. M. Jarvid, A. Johansson, V. Englund, A. Lundin, S. Gubanski, C. Muller and M. R. Andersson, J. Mater. Chem. A, 2015, 3, 7273–7286 CAS.
  42. E. Kuffel, W. S. Zaengl and J. Kuffel, High Voltage Engineering Fundamentals, Newnes, Oxford, UK, 2nd edn, 2000, ch. 5, pp. 281–366 Search PubMed.
  43. Y. Yamano, IEEE Trans. Dielectr. Electr. Insul., 2006, 13, 773–781 CrossRef CAS.
  44. S. Kisin, J. den Doelder, R. F. Eaton and P. J. Caronia, Polym. Degrad. Stab., 2009, 94, 171–175 CrossRef CAS.
  45. B. W. Larson, J. B. Whitaker, X.-B. Wang, A. A. Popov, G. Rumbles, N. Kopidakis, S. H. Strauss and O. V. Boltalina, J. Phys. Chem. C, 2013, 117, 14958–14964 CAS.
  46. K. Akaike, K. Kanai, H. Yoshida, J. y. Tsutsumi, T. Nishi, N. Sato, Y. Ouchi and K. Seki, J. Appl. Phys., 2008, 104, 023710 CrossRef.
  47. C. Brink, L. H. Andersen, P. Hvelplund, D. Mathur and J. D. Voldstad, Chem. Phys. Lett., 1995, 233, 52–56 CrossRef CAS.
  48. R. K. Yoo, B. Ruscic and J. Berkowitz, J. Chem. Phys., 1992, 96, 911–918 CrossRef CAS.
  49. L. A. S. d. A. Prado, Society of Plastics Engineers (SPE) Plastics Research Online, 2011, pp. 1–2 Search PubMed.
  50. W. Yang, X. Yang, M. Xu, P. Luo and X. Cao, Presented in part at the IEEE Conference on Electrical Insulation and Dielectric Phenomena (CEIDP), Oct., 2013 Search PubMed.
  51. T. J. Lewis, IEEE Trans. Dielectr. Electr. Insul., 2004, 11, 739–753 CrossRef CAS.
  52. C. Zheng, W. Zhang, H. Zhao, X. Wang, Z. Sun and J. Yang, IEEE Trans. Dielectr. Electr. Insul., 2014, 21, 1493–1500 CrossRef CAS.
  53. T. Tanaka, M. Kozako, N. Fuse and Y. Ohki, IEEE Trans. Dielectr. Electr. Insul., 2005, 12, 669–681 CrossRef CAS.
  54. Y. Zhou, M. Karplus, K. D. Ball and R. S. Berry, J. Chem. Phys., 2002, 116, 2323–2329 CrossRef CAS.

Footnote

Electronic supplementary information (ESI) available: The last snapshots at 60 ps for each trajectory, the RDF of Mulliken charge distribution and the Lindemann index for individual trajectory. See DOI: 10.1039/c5ra19512h

This journal is © The Royal Society of Chemistry 2016
Click here to see how this site uses Cookies. View our privacy policy here.