Application of a multifunctional magnetic mesoporous material for seafood sample clean-up prior to the determination of highly chlorinated polychlorinated biphenyls

Haibo Liu a, Jiabin Zhanga, Ning Gan*a, Yinji Chen*b, Jie Huangc, Yuting Caoa, Tianhua Lia and Hangzhen Lanc
aFaculty of Materials Science and Chemical Engineering, Ningbo University, Ningbo, 315211, China. E-mail: ganning@nbu.edu.cn
bDepartment of Food Science and Engineering/Collaborative Innovation Center for Modern Grain Circulation and Safety, Nanjing University of Finance and Economics, Nanjing, 210046, China. E-mail: chenyinji@gmail.com; Fax: +86 574 87608347; Tel: +86 574 87608347
cFaculty of Marine Science, Ningbo University, Ningbo, 315211, China

Received 13th October 2015 , Accepted 13th December 2015

First published on 15th December 2015


Abstract

In this study, a highly effective clean-up adsorbent was developed for eliminating matrix interferences, especially main organochlorine pesticide residues during the determination of highly chlorinated polychlorinated biphenyls in seafood. The multifunctional adsorbent was prepared by grafting carboxymethyl-β-cyclodextrin on the surface of amino functionalized mesoporous nanoparticles. The amino group functionalized mesoporous SiO2 can remove most of matrix interference in samples. Moreover, carboxymethyl-β-cyclodextrin has stronger host–guest complexation with 1,1,1-trichloro-2,2-bis(p-chlorophenyl)ethane, 2,2-bis(p-chlorophenyl)-1,1-dichloro-ethylene, and 1,1-dichloro-2,2-bis(p-chloropheny)ethane. However, it showed weaker adsorption ability toward highly chlorinated polychlorinated biphenyls due to a steric hindrance effect. Based on this, a gas chromatography-mass spectrometry method coupled with the multifunctional adsorbent as a clean-up adsorbent for dispersive solid phase extraction was developed for the analysis of several highly chlorinated polychlorinated biphenyls in seafood samples. The results indicate that the multifunctional adsorbent as a purification material can easily and effectively remove matrix interferences in seafood samples within a short time. The recoveries for polychlorinated biphenyls were in the range of 88.4–103.2%, with relative standard deviations varying between 1.3 and 5.7%.
1 Introduction

In recent years, the significant environmental damage caused by polychlorinated biphenyls (PCBs) has been a main concern for both scientists and the general public.1,2 It has been found that PCBs, especially highly chlorinated PCBs (from tetra- to octa-chlorinated PCBs), already exist in marine organisms due to bioaccumulation and transfer.3–5 This indicates that highly chlorinated PCBs can cause more serious effects on human health than lowly chlorinated PCBs.6,7 Therefore, scientists are striving hard to develop a simple and robust analytical method for determining trace residues of highly chlorinated PCBs in seafood samples.

The analysis of highly chlorinated PCBs in seafood usually involves the extraction of the analytes from the complex matrix, the subsequent clean-up procedure of the extracts and the final chromatographic analysis, such as GC-MS.8,9 In particular, the selective extraction of trace highly chlorinated PCBs from complex seafood matrixes with high protein, fat content and other organochlorine compounds are extremely difficult due to the coextraction of matrix components.8–11 Moreover, the matrix components co-eluting with the analytes will interfere the GC-MS determination steps and further influence the quantification of the target compounds.12–14 As for seafood samples, the common interferences of organochlorine pesticides residues, such as DDT, DDE, and DDD, have been identified as a major contributing source of matrix effects. This is attributed to the structure and polarity of PCBs which was similar with DDT, DDE, and DDD.15–17 In order to reduce the matrix effects, sample purification and clean-up procedures were conducted before determining PCBs in seafood samples.18–22 During the classic clean-up procedures, the solid-phase extraction (SPE) is performed using alumina column, Florisil® column (activated magnesium silicate) and multi-layer silica column (basic silica, activated silica, acidic silica, AgNO3 silica, and anhydrous sodium sulphate).23,24 However, SPE is a time-consuming technique involving excessive amounts of hazardous solvents.25 Thus, in order to obtain a high clean-up efficiency and recoveries technique, several effective clean-up methods, such as dispersive solid-phase extraction (dSPE) (quick, easy, effective, rugged and safe) method, were developed.19,26,27

Recently, the mesoporous SiO2 nanoparticles (mSiO2) as adsorbent has attracted considerable attention due to its higher specific surface area, tunable pore sizes and volumes, acceptable mechanical stability. The amino group functionalized silica can remove most of interfering co-extractives and reduce the matrix effect.28 Moreover, magnetic beads (Fe3O4) have received increased attention due to their strong magnetic separation properties, and ease of modification of surface chemistry features. Based on these studies, mesoporous Fe3O4@mSiO2, which has a relatively large specific surface area that can load a larger amount of multifunctional material on its surface, was chosen as matrix to modify amino groups to reduce the matrix effect in this work. However, they were not quite efficient in removing DDT, DDE, and DDD from seafood samples. Thus, the proper modification on the surface of mesoporous Fe3O4@mSiO2–NH2 is requested.

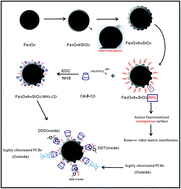
β-Cyclodextrin (containing 7 glucose units) is a natural molecule derived from starch, which has hydrophobic interior cavity and hydrophilic peripheral face. It has the tendency to form inclusion complexes with benzene and chlorobenzene based on host–guest inclusion function.29 However, highly chlorinated PCBs are more difficult to enter into the hydrophobic cavity of β-CD than DDT, DDE, and DDD, due to the steric hindrance effect.30 Therefore, β-CD was chosen as the clean-up components on the adsorbents for enrichment of DDT, DDE and DDD in matrix, and avoiding their interference on determining highly chlorinated PCBs. What's more, amino-functional Fe3O4@mSiO2 (Fe3O4@mSiO2–NH2) was used as the carrier to immobilize carboxymethyl-β-cyclodextrin (CM-β-CD) in order to achieve magnetic separation. The scheme (preparation process and clean-up mechanism) is shown in Fig. 1.


image file: c5ra21214f-f1.tif
Fig. 1 The scheme image (preparation process and clean-up mechanism).

Herein, a new dispersive solid phase extraction (dSPE) clean-up procedure using multifunctional mesoporous composites (Fe3O4@mSiO2–NH2–CMCD) as purification adsorbent combined with gas chromatography-mass spectrometry (GC-MS) detection has been developed for analysis of trace highly chlorinated PCBs in seafood. The composite adsorbent can not only isolate the PCBs from interference of DDTs, but also can be employed as an effective purified material to eliminate matrix interferences. The clean-up adsorbent coupled with dSPE-GC-MS (dispersive solid phase extraction combined with gas chromatography-mass spectrometry) is successfully applied to analyze highly chlorinated PCBs in seafood samples. Satisfactory results are obtained using the novel clean-up adsorbent.

2 Experimental

2.1 Reagents and materials

Five highly chlorinated PCBs including 2,2′,5,5′-tetrachlorobiphenyl (PCB52), 2,2′,4,5,5′-pentachlorobiphenyl (PCB101), 2,2′,3,4,4′,5-hexachlorobiphenyl (PCB138), 2,2′,4,4′,5,5′-hexachlorobiphenyl (PCB153), 2,2′,3,4,4′,5,5′-heptachlorobiphenyl (PCB180) were obtained from Accu Standard (New Haven, CT, USA). p,p′-DDD, p,p′-DDE, p,p′-DDT were purchased from Sigma-Aldrich (St. Louis, MO, USA). Ethylene glycol, hexane, ethyl acetate, methyl alcohol, isopropyl alcohol, dichloromethane (DCM), acetonitrile, acetone, isooctane, ferric chloride (FeCl3·6H2O), concentrated sulfuric acid, anhydrous sodium acetate, 1,6-hexanediamine, basic silica, AgNO3, anhydrous sodium sulphate, N-Hhydroxysuccinimide (NHS) and N-(3-dimethylaminopropyl)-N′-ethylcarbodiimide hydrochloride (EDC), carboxymethyl-β-cyclodextrin (CM-β-CD), 3-aminopropyltriethoxysilane (APTES), tetraethyl orthosilicate (TEOS), cetyltrimethylammonium bromide (CTAB), sodium chloride, dipotassium hydrogen phosphate, potassium dihydrogen phosphate were purchased from Sinopharm Chemical Reagent Co., Ltd. (Shanghai, China). The syringe filters were purchased from Xingya Co., Ltd (Shanghai). All other chemicals were used as received without further purification.

2.2 Equipment

Scanning electron micrographs (SEM) were obtained with a S3400N scanning electron microscope (Hitachi, Tokyo, Japan). N2-BET adsorption–desorption were determined using Micromeritics ASAP 2010 equipment. Infrared spectra were recorded with a Nicolet 6700 FT-IR spectrophotometer (Madison, Wisconsin, USA). The thermal stability of the particles was measured using a thermogravimetric analyzer (Seiko TG/DTA 6300, Japan). The magnetic properties were analyzed through a vibrating sample magnetometer (VSM, PPMS-9, USA). Gas chromatography-mass spectrometry (GC-2010, GC-MS-QP-2010E) was purchased from SHIMADZU (Japan).

2.3 Sample preparation and extraction

Four fish (yellow croaker, silver pomfret, hairtail and shad fish) and three shellfish (oyster, mussels and scallop) were collected from Zhoushan area in Zhejiang Province of China according to sampling standard.31–33 The fish samples were skinned and the shell of the shellfish was removed. Then, the muscular parts of the samples were homogenized using a food cutter and stored at −20 °C until analysis.

Four fish and three shellfish samples (5 g) were lyophilized and the fat was extracted with a mixture of DCM and hexane (1[thin space (1/6-em)]:[thin space (1/6-em)]1 by volume; 100 mL) in a Soxhlet apparatus for 12 h. Fats were then removed to enable analysis by treatment with concentrated sulfuric acid. Finally, the extracts were concentrated before the clean-up process.

2.4 Comparison of different clean-up procedures

In order to evaluate the effectiveness of the Fe3O4@mSiO2–NH2–CMCD for the clean-up properties of five kinds of highly chlorinated PCBs in seafood sample, comparative studies were carried out among three clean-up procedures used C18 column for SPE, amino (–NH2) modified silica and Fe3O4@mSiO2–NH2–CMCD as adsorbent for dSPE, respectively. The further clean-up steps have been provided in ESI.

3 Results and discussion

3.1 Characterization of Fe3O4@mSiO2–NH2–CMCD

3.1.1 SEM analysis. SEM images of bare Fe3O4, Fe3O4@SiO2 and Fe3O4@mSiO2–NH2–CMCD are presented in Fig. S1. Fig. S1a shows the morphology of Fe3O4 nanoparticle is spherical with a diameter of about 380–550 nm. In addition, the surfaces of as-prepared Fe3O4 nanospheres are relatively rough. Interestingly, after modification of SiO2 species on the surface of Fe3O4 (Fe3O4@SiO2), the adsorbent shows a very smooth surface in Fig. S1b (inset, the lower right corner). The mesoporous surface of mSiO2 is further to prepare the Fe3O4@mSiO2 (Fig. S1b) and the surface of the nanoparticle became rough again. As can be seen in Fig. S1c, the surface of the Fe3O4@mSiO2–NH2–CMCD become rougher than Fe3O4@mSiO2 (Fig. S1b). This phenomenon maybe relate to that CM-β-CD was successfully modified on the mesoporous surface of Fe3O4@mSiO2.
3.1.2 Surface area and pore diameter measurements. The specific surface area and pore diameter for Fe3O4@mSiO2–NH2–CMCD were calculated based on standard Brunauer–Emmett–Teller (BET) and Barrett–Joyner–Halenda (BJH) methods, respectively (Fig. 2). The BET surface area of Fe3O4@mSiO2 and Fe3O4@mSiO2–NH2–CMCD are 72.3 and 58.3 m2 g−1, respectively, indicating their porous structure. The pore size distribution derived from the desorption branch using the BJH method indicates that the obtained adsorbent (Fe3O4@mSiO2–NH2–CMCD) has an average pore width (4V/A) of about 5.8 nm with a narrow pore size distribution (Fig. 2, inset). The mesoporous surface of the adsorbent carries more amino functional groups and β-CD so that it can enhance the clean-up efficiency.
image file: c5ra21214f-f2.tif
Fig. 2 BET and BJH image of the Fe3O4@mSiO2–NH2–CMCD.

3.2 Comparison of clean-up procedure via three approaches

In this study, we investigated the clean-up procedure using three different approaches and kept the other variables unchanged. As shown in Fig. 3, a seafood sample spiked with five kinds of highly chlorinated PCBs and three kinds of organochlorine (DDT, DDE, and DDD) at a concentration of 10.0 ng g−1 was used to compare the efficiency of clean-up procedures. The matrix interference is remarkable owing to that the recoveries of all the analytes are low, ranging from 43.6% to 68.4% with simple acid treatment procedure (curve a). The matrix interference reduced dramatically by using C18 column and amino (–NH2) modified silica clean-up, however, the peaks of DDT, DDE, and DDD still appear (curve b and curve c). With the use of Fe3O4@mSiO2–NH2–CMCD clean-up dSPE, the matrix interference also reduced dramatically. This indicates that the clean-up efficiency of Fe3O4@mSiO2–NH2–CMCD is comparable with that of amino (–NH2) modified silica. Moreover, the peaks of DDT, DDE, and DDD are dramatically declined, and the recoveries of all the analytes varied between 85.3–104.2% (curve d). This could be explained by the fact that the chlorobenzene ring (0.17–0.2 nm3 per molecule) of DDT, DDE, and DDD34 can easier enter to the cavity (between 0.26 to 0.35 nm3 in volume) of β-CD,30 but the molecular volume of highly chlorinated PCBs was greater than 0.446 nm3 per molecule and most of highly chlorinated PCBs have no chlorobenzene ring.30 Compared with curve c, the intensity of the peak 7 (PCB138) in curve d is significantly enhanced. When the adsorbent was employed to remove DDT, the recovery of PCB138 increased. In conclusion, Fe3O4@mSiO2–NH2–CMCD dSPE procedure has several advantages: (i) short sample preparation time, (ii) an easy clean-up procedure for the removal of various matrix including DDT, DDE, and DDD in seafood sample using magnetic separation.
image file: c5ra21214f-f3.tif
Fig. 3 The total ion chromatogram (TIC) for the soil spiked with analytes at 10 ng g−1 (a) without clean-up procedure, (b) commercial C18 column for clean-up procedure, (c) amino (–NH2) modified silica for clean-up procedure, (d) Fe3O4@mSiO2–NH2–CMCD for clean-up procedure with peak numbering: PCB52 (1), PCB101 (2), p,p-DDE (3), p,p-DDD (4), PCB153 (5), p,p-DDT (6), PCB138 (7), PCB180 (8).

3.3 Optimization of Fe3O4@mSiO2–NH2–CMCD dSPE clean-up procedures

In order to achieve high selectivity and recovery of PCBs from complex mixtures, some parameters in Fe3O4@mSiO2–NH2–CMCD dSPE clean-up procedure (e.g. organic solvent, dSPE time, amount of adsorbent) were investigated.

In this experiment, acetonitrile, acetone, methyl alcohol, ethyl acetate, and isopropyl alcohol were employed. The results suggested that the molecule within the structure of chlorobenzene ring has strong interactions with the β-CD in acetonitrile. The further mechanism of this discussion has been provided in ESI (Fig. S5–S10).

In order to assess the effect of dSPE time on the clean-up efficiency and recovery, equilibrium dSPE time profiles are derived by increasing the extraction time of 2 mL of acetonitrile. The results show that there are rapid recoveries when the extraction time increases from 2 to 6 min, as shown in Fig. S11. After 8 min, the maximum recoveries are obtained for highly chlorinated PCBs which are close to 95%. Consequently, the total extraction and dSPE time of 10 min are selected for further study.

According to previous discussion, the Fe3O4@mSiO2–NH2–CMCD is very effective in removing major matrices in food samples, especially DDT, DDE, and DDD. While designing Fe3O4@mSiO2–NH2–CMCD dSPE clean-up optimization experiments, a suitable amount of the adsorbent must be used because it does not affect the recoveries of PCBs and the clean-up efficiency. For this purpose, the seafood sample spiked with each highly chlorinated PCB at 10.0 ng g−1 is studied to determine the effectiveness of different amounts of adsorbent on the clean-up efficiency and recoveries of analytes. The results are shown in Fig. 4. When using 5 mg of Fe3O4@mSiO2–NH2–CMCD adsorbents, the recoveries of the highly chlorinated PCBs are exceptionally high in the range of 121.3–134.4%. Moreover, the peaks of DDT, DDE, and DDD appeared without reduction after clean-up, thereby implying that there was very serious matrix interference in this case. By increasing the amount of adsorbents to 30 mg, satisfactory recoveries of the highly chlorinated PCBs were consistent in the range of 86.2–103.6%. In addition, 30 mg is the least amount of adsorbents that can be used to ensure the removal of various matrix (the peaks of DDT, DDE, DDD were reduced by more than 80% after clean up). However, the quantification using amounts to 50 or 60 mg of adsorbent seemed inappropriate for obtained recoveries (64.9–77.2%), especially the PCB52. This may be because PCB52 is the lowest chlorinated PCBs in the five targets, which may partially access the β-CD cavity. Based on these experiments, we conclude that the combination of least amounts of adsorbents in the proportion of 30 mg per 5 g of seafood sample would ensure robust and efficient clean-up by maintaining satisfying recoveries of the target highly chlorinated PCBs.


image file: c5ra21214f-f4.tif
Fig. 4 Recoveries of five kinds of highly chlorinated PCBs using different amount of Fe3O4@mSiO2–NH2–CMCD on the clean-up procedure.

3.4 Analytical performances

After optimization of the Fe3O4@mSiO2–NH2–CMCD-dSPE step, the concentration levels of PCBs were evaluated. The calibration curves for all investigated highly chlorinated PCBs were linear, with correlation coefficients (r) spanning from 0.9985 to 0.9997 in fish matrix and from 0.9987 to 0.9998 in shellfish matrix (Tables 1 and S2). The limits of detection (LODs) were defined as the lowest concentration in which signal-to-noise ratio of 3 (S/N = 3). The limits of quantification (LOQs) were defined as the lowest concentration in which signal-to-noise ratio of 10 (S/N = 10). As can been seen, the LODs of fish sample and shellfish sample are in the range of 0.021–0.068 ng g−1 and 0.025–0.071 ng g−1, respectively. The LOQs are in the range of 0.06–0.02 ng g−1 and 0.07–0.022 ng g−1, respectively (Tables 1 and S2). Precision is assessed in terms of intra-day (n = 6) and inter-day repeatability (n = 6) (Table S3). The analytical method was proved to be sensitive enough to analyze and detect the trace targets in real fish and shellfish samples.
Table 1 Method quality parameters obtained in real fish matrix
Analytes Calibration equations Linear range (μg L−1) Correlation coefficients (r) LOD (ng g−1) LOQ (ng g−1)
PCB52 y = 269.96x + 80.40 0.1–200 0.9994 0.021 0.06
PCB101 y = 244.02x + 55.95 0.1–200 0.9997 0.033 0.11
PCB138 y = 248.52x + 82.67 0.2–200 0.9993 0.036 0.12
PCB153 y = 279.77x + 64.40 0.2–200 0.9985 0.053 0.16
PCB180 y = 284.62x − 81.26 0.2–200 0.9992 0.068 0.20


Moreover, the accuracy of method is evaluated with recovery studies after spiking sample at two different concentration levels. Table S3 lists the calculated recoveries for each analyte at the fortification levels of 0.5 and 10.0 ng g−1 in fish and shellfish matrices, respectively. As it can be seen, the majority of mean recoveries of fish samples are in the range of 83–103% at the two spiking levels for the selected highly chlorinated PCBs and shellfish samples are 82–105%. For the precision on fish samples, the RSDs are calculated in the ranges of 1 and 9%. For shellfish samples, the RSDs are calculated in the ranges of 2 and 11%.

Furthermore, a comparison study among different methods for the determination of PCB was applied in different samples was also out-performed, and the results are shown in Table 2. Comparing the proposed dSPE procedure with these SPE procedures, the Fe3O4@mSiO2–NH2–CMCD do not need to be packed into the SPE cartridge but dispersed in sample extraction instead. Cleanup, the most time-consuming procedure in sample pretreatment, could be fulfilled fast with simply blending and stirring extraction using Fe3O4@mSiO2–NH2–CMCD. As was shown in the Table 2, the proposed method gives a simpler and faster way for cleaning up PCBs in fish samples and provides LODs, higher recoveries and better precisions of PCBs. The Fe3O4@mSiO2–NH2–CMCD with the adsorbed PCBs was easily collected by an external magnetic field without additional centrifugation or filtration. The proposed method possesses many advantages comparing with the classical sample preparation procedures, including easier preparation and regeneration of the sorbent, simpler sample handling procedure, less solvent consumption and higher recovery. The LODs obtained are in the range of 0.021–0.071 ng g−1, which are suitable for the determination of ultra-trace amounts of PCBs. Furthermore, the present work provides a promising alternative to the traditional techniques for the analysis of PCBs in complex mixtures.

Table 2 Method comparisons for analysis of PCBs in real sample
Sample Clean-up procedure Detecting instrument Clean-up time (min) Method LOD, (ng g−1) recoveries (R) Reference
Fish samples PowerPrep™ GC-MS-NCI 20 0.06–4.86, 88.3–111% 35
Soil sample Silica gel GC-MS 30–40 0.007, 77–109% 36
Hair samples Multi-layer silica GC-MS 30 0.02–0.12, 90.8–112.6% 37
Soil sample Alumina GC-MS 30 0.003–0.006, >90% 38
Fish sample MOF-5(Fe) GC-MS 30 0.061–0.096, 94.3–97.5% 39
Fish sample m-ZrO2@Fe3O4 GC-MS/MS 15 0.02–4.40, 69.8–117.1% 40
Seafood sample Multifunctional mesopores material GC-MS 10 0.021–0.071, 82.4–105.2% This work


3.5 Application for real sample

The optimized method was examined by analyzing the highly chlorinated PCBs from real environmental fish and shellfish samples. Three batches of fish sample and shellfish sample (4 fish sample and 3 shellfish sample for each batch) were analyzed by the developed method. Each batch of samples was processed together with a blank matrix (PCBs-free sample), which was confirmed using GC-MS method. The blank matrix was used to eliminate the false positive in the extraction process and instrument. Five kinds of highly chlorinated PCBs were identified by comparing the retention time and fragment ions with the related standard compound. The results indicated the presence of highly chlorinated PCBs in the collected samples with concentrations varied from 0.45 to 6.69 ng g−1 (Table S4). Fig. 5 shows the GC-MS chromatogram of blank background, yellow croaker sample, mussels sample and spiked samples (10.0 ng g−1). The result shows that PCB52 is detected at a concentration of 1.43 ng g−1, and PCB153 is found at a concentration of 2.05 ng g−1 in yellow croaker sample (curve b). Besides, it is found that PCB138 in mussels sample at a concentration of 1.73 ng g−1 (curve c). The results demonstrate that the developed method is applicable for real fish and shellfish sample analyses.
image file: c5ra21214f-f5.tif
Fig. 5 The GC-MS chromatogram for (a) blank background; (b) yellow croaker sample; (c) mussels sample; (d) spiked samples (10.0 ng g−1).

4 Conclusions

In this study, a novel magnetic mesoporous adsorbent for clean-up usage in complex seafood samples was fabricated by modifying CM-β-CD on amino functionalized mesoporous surface of Fe3O4@mSiO2. Furthermore, the material was employed in dSPE clean-up procedure for detection of trace level of highly chlorinated PCBs in seafood samples. This novel adsorbent can effectively eliminate matrix interferences, especially DDT, DDE, and DDD in seafood samples. The results illustrate that the proposed Fe3O4@mSiO2–NH2–CMCD dSPE coupled with GC-MS method is effective in performing the analysis of highly chlorinated PCB residues in complex seafood samples. In conclusion, it can be applied to routine analyses of trace highly chlorinated PCBs residues in seafood samples with complex matrix.

Acknowledgements

This work was supported by the National Natural Science Foundation of China (No. 31070866), the Natural Science Foundation of Zhejiang Province and Ningbo (Y15B050002, LY13C200017, Y16B050004, Pd2013088). Non-profit project funded by State Administration of Grain (201313010), and a project funded by the Priority Academic Program Development of Jiangsu Higher Education Institutions (PAPD), and the KC Wong Magna Fund in Ningbo University.

References

  1. A. Zhao, X. Wang and M. Ma, Microchim. Acta, 2012, 177, 229–236 CrossRef CAS.
  2. X. Cao, J. Chen and X. Ye, J. Sep. Sci., 2013, 36, 3579–3585 CrossRef CAS PubMed.
  3. S. Koenig, P. Fernández and M. Solé, Aquat. Toxicol., 2012, 108, 11–17 CrossRef CAS PubMed.
  4. H. Tang, G. Meng, Q. Huang, C. Zhu, Z. Huang, Z. Li, Z. Zhang and Y. Zhang, RSC Adv., 2014, 4, 19654–19657 RSC.
  5. X. Du, S. Lin and N. Gan, J. Sep. Sci., 2014, 37, 1591–1600 CrossRef CAS.
  6. L. Knobeloch, M. Turyk and P. Imm, Chemosphere, 2012, 86, 735–740 CrossRef CAS PubMed.
  7. I. Ayadi, S. M. Monteiro, I. Regaya, A. Coimbra, F. Fernandes, M. M. Oliveira, F. Peixoto and W. Mnif, RSC Adv., 2015, 5, 87168–87178 RSC.
  8. J. M. Molina-Ruiz, E. Cieslik and I. Cieslik, Environ. Sci. Pollut. Res., 2015, 22, 369–378 CrossRef CAS PubMed.
  9. L. Jing, Y.-E. Shi, J. Cui, X. Zhang and J. Zhan, RSC Adv., 2015, 5, 13443–13450 RSC.
  10. X. Zhang, K. D. Oakes and D. Luong, Anal. Chem., 2011, 83, 6532–6538 CrossRef CAS PubMed.
  11. K. Maštovská, S. J. Lehotay and M. Anastassiades, Anal. Chem., 2005, 77, 8129–8137 CrossRef.
  12. M. Caban, N. Migowska and P. Stepnowski, J. Chromatogr. A, 2012, 1258, 117–127 CrossRef CAS.
  13. J. Hajšlová and J. Zrostlıkova, J. Chromatogr. A, 2003, 1000, 181–197 CrossRef.
  14. C. Yagüe, S. Bayarri, P. Conchello, R. Lázaro, C. Pérez-Arquillué, A. Herrera and A. Ariño, J. Agric. Food Chem., 2005, 53, 5105–5109 CrossRef PubMed.
  15. M. V. Russo, G. Goretti and T. Nevigato, Chromatographia, 1999, 50, 446–452 CAS.
  16. G. Xiong, X. He and Z. Zhang, Anal. Chim. Acta, 2000, 413, 49–56 CrossRef CAS.
  17. L. Weijs, R. S. H. Yang and K. Das, Environ. Sci. Technol., 2013, 47, 4365–4374 CrossRef CAS.
  18. P. Suchan, J. Pulkrabová and J. Hajšlová, Anal. Chim. Acta, 2004, 520, 193–200 CrossRef CAS.
  19. A. R. Fontana, A. Camargo and L. D. Martinez, J. Chromatogr. A, 2011, 1218, 2490–2496 CrossRef CAS.
  20. G. Ottonello, A. Ferrari and E. Magi, Food Chem., 2014, 142, 327–333 CrossRef CAS.
  21. M. Cossu, G. Ledda and G. Chessa, Monatsh. Chem., 2013, 144, 1597–1606 CrossRef CAS.
  22. E. Cocco, C. Guignard, L. Hoffmann and T. Bohn, Int. J. Environ. Anal. Chem., 2011, 91, 333–347 CrossRef.
  23. H. P. Tang, TrAC, Trends Anal. Chem., 2013, 45, 48–66 CrossRef CAS.
  24. K. Čonka, J. Chovancová and Z. S. Sejáková, Chemosphere, 2014, 98, 37–43 CrossRef.
  25. D. Gode, M. M. Martin and F. Steiner, Anal. Bioanal. Chem., 2012, 404, 433–445 CrossRef CAS.
  26. P. Herrero and F. Borrull, J. Chromatogr. A, 2014, 1339, 34–41 CrossRef CAS.
  27. W. Peysson and E. Vulliet, J. Chromatogr. A, 2013, 1290, 46–61 CrossRef CAS.
  28. M. Anastassiades, S. J. Lehotay and D. Štajnbaher, J. AOAC Int., 2003, 86, 412–431 CAS.
  29. Y. Song, F. Wang and X. Yang, J. Soils Sediments, 2011, 11, 1345–1354 CrossRef CAS.
  30. F. Wong and T. F. Bidleman, Environ. Pollut., 2010, 158, 1303–1310 CrossRef CAS.
  31. S. Król, B. Zabiegała and J. Namieśnik, Talanta, 2012, 93, 1–17 CrossRef.
  32. M. Q. Jin, S. S. Zhou, W. P. Liu, D. Zhang and X. T. Lu, J. Environ. Sci. Health, Part B, 2015, 50, 163–174 CrossRef CAS PubMed.
  33. J. Y. Wang, X. W. Yu and L. Fang, Mar. Pollut. Bull., 2014, 80, 288–292 CrossRef CAS.
  34. C. T. Chiou, P. E. Porter and D. W. Schmedding, Environ. Sci. Technol., 1983, 17, 227–231 CrossRef CAS.
  35. M. I. H. Helaleh, A. Al-Rashdan and A. Ibtisam, Talanta, 2012, 94, 44–49 CrossRef CAS PubMed.
  36. S. R. Rissato, M. S. Galhiane and V. F. Ximenes, Chemosphere, 2006, 65, 1949–1958 CrossRef CAS PubMed.
  37. G. Zhao and Z. Wang, Sci. Total Environ., 2008, 397, 46–57 CrossRef CAS.
  38. M. E. Aydin, A. Tor and S. Özcan, Anal. Chim. Acta, 2006, 577, 232–237 CrossRef CAS.
  39. S. Lin, N. Gan, L. Qiao, J. Zhang, Y. Cao and Y. Chen, Talanta, 2015, 144, 1139–1145 CrossRef CAS PubMed.
  40. X. T. Peng, L. Jiang, Y. Gong, X. Z. Hu, L. J. Peng and Y. Q. Feng, Talanta, 2015, 132, 118–125 CrossRef CAS PubMed.

Footnotes

Electronic supplementary information (ESI) available. See DOI: 10.1039/c5ra21214f
They have made the same contribution to this article.

This journal is © The Royal Society of Chemistry 2016
Click here to see how this site uses Cookies. View our privacy policy here.