Seyed Farid Seyed Shirazi*ab,
Samira Gharehkhani*a,
Hendrik Simon Cornelis Metselaara,
Bahman Nasiri-Tabrizic,
Hooman Yarmanda,
Mahdi Ahmadid and
Noor Azuan Abu Osmanb
aDepartment of Mechanical Engineering, Faculty of Engineering and Advanced Material Research Center, University of Malaya, 50603 Kuala Lumpur, Malaysia. E-mail: faridsh80@gmail.com; s_gharahkhani_248@yahoo.com; Fax: +60-3-79675317; Tel: +60-14-2646276
bDepartment of Biomedical Engineering, Faculty of Engineering, University of Malaya, 50603 Kuala Lumpur, Malaysia
cAdvanced Materials Research Center, Materials Engineering Department, Najafabad Branch, Islamic Azad University, Najafabad, Iran
dSchool of Aerospace, Mechanical and Manufacturing Engineering, RMIT University, Melbourne, Australia
First published on 26th November 2015
This study describes how various loadings of two ions with different size and charge, such as silver and tantalum, can affect the mechanical and biological properties of calcium silicate (CS). The incorporation of 5 wt% tantalum (Ta, charge: 5+, ion radius: 0.68 Å) in the CS lattice raised the hardness and fracture toughness values significantly. Increasing the Ta concentration to 10 wt% and 15 wt%, did not lead to further improvements. Additions of silver (Ag, charge: 1+, ion radius: 1.13 Å) to 5, 10 and 15 wt%, resulted in an increase in hardness and fracture toughness values in comparison to undoped CS; however, these values did not change significantly with different concentrations of Ag. Both Ta and Ag doped CS formed surface layers of apatite in simulated body fluid (SBF). CS was found to stimulate hFOB proliferation. The incorporation of Ta into CS did not change this and hFOB proliferation was stimulated even at higher concentrations. With increasing Ag content in the CS structure, the cell proliferation was slightly inhibited.
One of the reported problems associated with ceramic implants is the presence of defects such as cracks due to post processing conditions and the brittleness of ceramics that is an intrinsic property of this class of materials. To suppress this problem some high-tech fabrication processes such as hot isostatic pressing (HIP), spark plasma sintering (SPS) and selective laser sintering (SLS) have been employed.23,24 Incorporation of metals into a ceramic matrix is aimed at taking advantage of the ductility of metal based on a crack-bridging toughening mechanism.25 According to a different theory the higher thermal expansion coefficient of metals can introduce stress into the ceramic matrix, therefore imparting higher toughness.26 Over the past decades, various chemical synthesis methods have been reported for doping ceramics with metal ions. Both wet chemical process27–29 and solid state reaction30,31 have been used for cation and anion dopants. The mechanochemical technique is a synthesis process that has been used for the production of a wide range of materials.32,33 This technique can produce nanocrystalline structures without the necessity for high temperature treatment and also without undesirable side-reaction, has a quite short synthesis time and often avoid the need to wash the synthesized powder. Up to now, many studies have been devoted to the synthesis of nano-crystalline materials but only few have addressed the ion substitutions in the main matrix.
The present study is aimed at the evaluation of biological behaviors and mechanical properties of calcium silicate doped with pentavalent tantalum (Ta5+) and monovalent silver (Ag+) introduced in a prior publication.34 Mechanical properties including hardness and fracture toughness and biological properties as well as e.g. apatite formation and cell proliferation were assessed for various concentrations of Ag and Ta with the aim of using doped CS materials in bone implantations.
To prepare the ceramic disks, doped CS powders were uniaxially pressed at 250 MPa to get doped CS precursor discs with a diameter of 5 mm and a height of 3 mm. Subsequently, the green disks were conventionally sintered at 1200 °C for 3 h with a heating rate of 5 °C min−1 to obtain the ceramic discs. Finally, the sintered discs were molded with epoxy resin before their mechanical properties were measured. The surfaces of the sintered specimens were ground with 600, 1200 and 2000 grit SiC paper, followed by polishing with 9, 3 and 0.5 μm polishing compounds to obtain a consistent surface roughness for all samples.
Microstructural characterization of the sintered doped CS discs was performed using a high resolution FEI Quanta 200F field emission scanning electron microscopy (FESEM). Energy dispersive X-ray spectroscopy (EDX) coupled to the FESEM machine was employed to image the elemental distribution in a fine structure. X-ray diffraction (XRD) of the powders and composites was performed using a PANalytical's Empyrean XRD with mono-chromated Cu-Kα radiation (λ = 1.54056 Å), operated at 45 kV, 40 mA, a step size of 0.026° and a scanning rate of 0.1° s−1 over a 2θ range from 20° to 60°.
Phase volume fraction (WP, %) was determined using semi-quantitative XRD analysis by comparing the peaks of β-CS (−3 2 0), and α-CS ((1 1 2), (−1 2 2), and (3 0 1)) from XRD patterns:35
![]() | (I) |
Five indentations were made per sample and the average reported. The fracture toughness was calculated using the widely used Anstis model. In this method the fracture toughness is calculated from the crack length, hardness of material and also applied load according to the following equation;36–38
![]() | (II) |
The polished specimens were incubated in 10 mL SBF solution in a laminar flow hood. The samples were kept in SBF solution for 7 days and 14 days at a constant temperature of 37 °C and at a pH of 7.3, with HCl and NaOH to adjust the pH. After a pre-set time point, the samples were removed and were rinsed in ethanol; then, they were analyzed by the FESEM and XRD spectrum to determine the apatite formation on the surface of each sample.
To investigate the cell adhesion by FESEM (Ultra-high Resolution SEM SU8000, Hitachi, Japan), the cells were fixed on the surface of the composites by incubating the discs/cells construct in 4% glutaraldehyde for 12 h followed by washing the samples with PBS (0.1 M) three times and dehydration with a series of graded ethanol/water solutions (40%, 50%, 60%, 70%, 80%, 90%, and 3 × 100%, respectively). Next, 0.5 mL of hexamethyldisilazane (HMDS) was added to each well, including the dehydrated samples, to preserve the original morphology of the cells. Three samples of each doping concentration were tested, and each test was conducted in triplicate (p-value < 0.05).
![]() | ||
Fig. 1 XRD patterns of (a) TCS and (b) ACS samples sintered at 1200 °C for 2 h. β and α are the index of β-CS and α-CS respectively. |
Composite name | WP | |||
---|---|---|---|---|
β-CS | α-CS | |||
(−3 2 0) | (1 1 2) | (−1 2 2) | (3 0 1) | |
CS | 20.3 ± 1.5 | 50.2 ± 3.1 | 5.2 ± 0.1 | 25.3 ± 4.2 |
TCS5 | 36.5 ± 2.2 | 42.4 ± 1.2 | 2.1 ± 0.2 | 20.1 ± 1.1 |
TCS10 | 48.1 ± 1.2 | 26.7 ± 1.3 | 1.3 ± 0.1 | 23.9 ± 1.1 |
TCS15 | 59.8 ± 3.1 | 20.4 ± 2.2 | 1.2 ± 0.2 | 18.8 ± 1.2 |
ACS5 | 3.2 ± 0.1 | 47.3 ± 2.4 | 26.4 ± 2.3 | 24.3 ± 1.2 |
ACS10 | 2.4 ± 0.2 | 59.9 ± 3.2 | 1.9 ± 0.2 | 36.3 ± 1.9 |
ACS15 | 18.9 ± 1.2 | 40.2 ± 0.9 | 3.2 ± 0.1 | 37.9 ± 1.1 |
Compared to pure CS, the intensities of α-CS reflections in sintered TCS5 samples were reduced with an obvious increase in the intensities of β-CS. With increased incorporation of Ta (TCS10 and TCS15), a slight further reduction in intensities of α-phase was observed indicating less phase transformation from β to α. Based on the JCPDS 43-1460 the main reflection of β-CS at 29.98° (2 theta) had a significantly increased intensity with higher amounts of Ta substitution. The intensities of all Ta doped samples after sintering at 1200 °C showed that further Ta substitutions retarded phase transformation to α-CS, which could be related to the heating and cooling rate of sintering.40
In addition, it seemed that the temperature of phase transformation increased with higher Ta content, which held true for both calcinations34 and sintering. To stabilize the β form as the dominant phase, the heating and cooling rates must be decreased. If β is the preferred phase over α heating and cooling rates should be increased. β-CS is suitable when a higher fracture toughness is desired, however transformation to α-CS leads to greater hardness.10
ACS5 and ACS10 had an increased amount of α phase present in accordance with JCPDS 031-0300, but the intensity of β phase was higher in sintered ACS15 (Fig. 1b). The intensities of α reflection in ACS15 were slightly lower than those for pure CS which could be due to disruptions of the long range order by addition of Ag contents of more than 10 wt%.
Recently, it was shown that the incorporation of cations with a larger ionic radius, e.g. strontium (Sr2+), increased the crystal dimension, which may result in enhancing the transport of atoms and stimulating the phase transition of CS.41 Hence, it is a rational expectation that Ag ions, which possess a larger ionic radius, could stimulate phase transformation due to lattice distortion. It seems that 15% Ag could create a distortion in the CS lattice, which prevented the phase transformation as observed in ACS5 and ACS10. Furthermore, it is concluded that the temperature of phase transformation for ACS15 should be much higher than for ACS5 and ACS10 due to the lower amount of vacancies in the lattice of CS, which could cause the transport of atoms and accelerated phase transition.
Previously, it was shown that the incorporation of some foreign ions in titanium dioxide (TiO2) can stimulate the phase transformation from anatase to rutile, which was attributed to the formation of oxygen vacancies that enhanced the transport of atoms and accelerated the phase transformation.42
The results revealed that both dopants changed the density of sintered samples (Table 2). Increased densification occurred in the Ag doped samples with increasing addition of Ag as the radius of Ag+ ions is larger than that of Ca2+. Cho, Park, Kim and Chung43 found that Cd2+ as a sintering additive promoted the densification of (Pb0.52Ti0.48)ZrO3 ceramics through the replacement of Pb2+ by Cd2+. It is reasonable to speculate that the mechanisms by which Ag induced densification of the CS ceramics, may be related to this finding and that Ag ions cause an increase in crystal dimensions, thereby enhancing the transport of atoms and accelerating the densification of CS ceramics.
Composite name | Density (g cm−3) | Porosity (%) | Grain size (μm) |
---|---|---|---|
CS | 2.40 ± 0.06 | 17.2 ± 0.7 | 0.24 ± 0.04 |
TCS5 | 2.86 ± 0.08 | 3.6 ± 0.5 | 0.14 ± 0.03 |
TCS10 | 2.77 ± 0.03 | 4.8 ± 0.5 | 0.21 ± 0.06 |
TCS15 | 2.75 ± 0.05 | 5.2 ± 0.2 | 0.24 ± 0.05 |
ACS5 | 2.47 ± 0.1 | 14.8 ± 0.5 | 0.25 ± 0.03 |
ACS10 | 2.56 ± 0.07 | 8.5 ± 0.8 | 0.27 ± 0.03 |
ACS15 | 2.68 ± 0.07 | 7.7 ± 0.3 | 0.31 ± 0.03 |
Ta doped CS specimens showed similar densification behavior as was observed in Ag doped samples. In all cases the density of Ta-doped CS was higher than that of pure CS samples. With incorporation of 5% of Ta, the porosity of the sintered bodies decreased from 17.20 ± 0.7% for pure CS to 3.6 ± 0.5%, while with increasing the content of Ta up to 15 wt% this value was slightly raised to 5.2 ± 0.2%. The results were in full agreement with the hypothesis that the densification rate depended on the radii of ions doped; i.e., the smaller the ionic radii, the better the densification rate.44 In similar studies, rare earth doping of alumina significantly improved the densification behavior.45
However, at 10 wt% and 15 wt% concentration, Ta could cause further vacancies in the CS lattice leading to the formation of a loose structure, which resulted in a lower density compared to 5 wt% Ta containing CS ceramics. As the ionic radius of Ta is smaller than Ag, Ta had more influence on the densification rate of CS in doped samples than Ag. Even though Ta has a smaller ion radius than Ag, the charge imbalance created in the CS lattice by doping with Ta increased the vacancy concentration, which most probably enhanced the transport of atoms and accelerated the densification of CS materials.
With the replacement of 10 wt% and 15 wt% Ag for Ca in the sintered samples, grain growth occurred by over a factor of two compared to undoped CS samples as shown in Table 2 and Fig. 2. As can be seen from the FESEM images and the grain size analysis, the different amounts of dopants had a direct effect on the grain growth. Significant grain refinement occurred for TCS5 specimens, where the grain sizes were reduced by over 40% relative to the pure CS.
![]() | ||
Fig. 2 FESEM images of Grain size of (a) pure CS (b) ACS5 (c) ACS10 (d) ACS15 (e and f) TCS5 (g) TCS10 and (h) TCS15 sintered at 1200 °C for 2 h. |
Ta5+ as a pentavalent dopant generates charge-compensating oxygen vacancies which together with the association energy contributed and furthered the size misfit.34 Accepting the hypothesis that oxygen vacancies enhance cation diffusion,46 it is expected that fewer oxygen vacancies were associated with Ta5+, and that Ta5+ had the lowest diffusivity itself and, therefore, effected the lowest grain boundary mobility. With Ag+ doping there were not sufficient oxygen vacancies to be associated with Ag to cause significant cation diffusion and induce associated mobility at the grain boundaries. When further dopant was incorporated into CS, there was less cation diffusion, due to the lower amounts of oxygen vacancies afforded by the dopants. This caused the mobility in the doped materials to drop further and finally increased grain growth.
Composite name | Hardness (GPa) | Fracture toughness (MPa m1/2) | Young's modulus (GPa) |
---|---|---|---|
CS | 2.57 ± 0.13 | 0.67 ± 0.06 | 105.3 ± 6.1 |
TCS5 | 7.01 ± 0.14 | 1.51 ± 0.05 | 133.5 ± 5.1 |
TCS10 | 5.10 ± 0.0.38 | 1.17 ± 0.09 | 121.2 ± 7.1 |
TCS15 | 3.28 ± 0.27 | 1.14 ± 0.01 | 118.4 ± 5.4 |
ACS5 | 4.30 ± 0.47 | 0.99 ± 0.09 | 111.6 ± 3.2 |
ACS10 | 4.52 ± 0.31 | 1.07 ± 0.01 | 110.3 ± 4.6 |
ACS15 | 4.91 ± 0.17 | 1.05 ± 0.02 | 107.2 ± 4.9 |
Since the hardness technique is purely a surface technique and as such the hardness of a material is dependent on the physical characteristics of the surface,47,48 it is likely that the level of surface porosity may play a more crucial role in the hardness.
In the ACS samples it appeared that a higher amount of dopant and combined with the standard temperature profile of the sintering process increased the flow of ions, which resulted in the closure of surface porosity, which is called the “filling in” effect.49 The effect entails that exposed surfaces are the hottest part of a sample. The comparatively small differences (within the margin of error) in the hardness values between the different ACS specimens could be due to only insignificant variations in the open porosity of ACS samples.
TCS specimens show a different behavior from ACS. TCS5 shows the highest value of hardness among the TCS specimens. With incorporation of 5 wt% Ta, the hardness increased to 7.01 ± 0.1 which is 2.7 times more than pure CS. With increasing amounts of Ta, the hardness values decreased again dramatically due to the reduction in density of the samples. Although it was expected that the “filling in” effect would be observed for all TCS specimens, this was not the case. Apparently the difference in temperature between surface and interior did not lead to significant lower surface porosity for TCS10 and TCS15.
The doped bioceramics certainly had higher values of fracture toughness and hardness (Table 3), than pure CS (fracture toughness of pure CS was 0.67 ± 0.06 MPa m1/2). In spite of the similar microstructures and grain sizes of Ag and Ta doped CS sintered at 1200 °C, the Ta doped bioceramics had higher fracture toughness, as a consequence of the more extensive phase transformation of α to β-CS in the case of the Ag doped CS. In the case of TCS specimens, with Ta content of 5 wt% showed a 105% increase in fracture toughness, which could be interpreted as a lowering of the amounts of α phase, which is the phase with the lower fracture toughness.
Improving the fracture toughness of the doped samples was not limited to the phase transition and grain size but extended to the relative density. Consequently, although undoped CS samples had a biphasic structure they had the lowest fracture toughness. In addition to the biphasic structure, TCS5 specimens had the highest value of relative density, which in turn was a strong reason for a higher fracture toughness. With the decrease in density for the other TCS samples, the fracture toughness value was decreased by about 50%.
However TCS10 and TCS15 had nearly the same fracture toughness even though they had different phase structures. This could be due to the similar relative densities of TCS10 and TCS15.
Contrary to Ta doping, the level of Ag doping did not have a significant effect on the fracture toughness of ACS specimens. With addition of Ag the fracture toughness increased around 30% compared to undoped CS. ACS5 and ACS10 have a monophasic structure of α-CS even though in ACS15 some β-CS was observed. Based on the crystallinity study it was expected that ACS15 samples showed higher fracture toughness values. However, considering the relative densities of ACS specimens it could be claimed that the higher density of ACS15 could moderate the rate of changes in regards to the fracture toughness.
The elastic modulus of pure CS in the biphasic structure of α- and β-CS was 105 ± 6 GPa, which increased to 134 ± 5 GPa for TCS5. The increase of the elastic modulus of TCS5 could be due to the higher relative density, and smaller grain size in comparison with other specimens.50 This explains the reduction of the elastic modules of TCS10 and TCS15 specimens. With increasing amounts of Ta in the CS structure, the Young's modulus decreased to values of 121 ± 7 GPa and 118 ± 5 GPa for TCS10 and TCS15 respectively.
In ACS samples, lower elastic modulus values were observed than in TCS. In ACS5 the elastic modulus decreased to 112 ± 3 GPa due to lower relative density compared to TCS5. This value did not change significantly for ACS10 (110 ± 5 GPa) and ACS15 (107 ± 5 GPa) samples.
![]() | ||
Fig. 3 XRD patterns of apatite formation on the surface of the (a) pure CS, (b) ACS5, (c) ACS10, (d) TCS5, (e) TCS10 after soaking in SBF for 14 days. |
Another result which can be obtained from the XRD patterns was that all specimens were fully covered by HA layers after incubation in SBF for 14 days, which demonstrated the ability of all doped and undoped CS samples to form apatite on their surfaces. Furthermore, no calcite peaks were observed in the XRD patterns; calcite could have side effects in biomedical engineering applications when performing in vivo tests.
There was no significant difference between the morphology of pure and doped CS specimens. For all FESEM micrographs show the apatite layer that was formed on the pure and doped CS ceramics (Fig. 4). For all specimens it could be observed that the apatite layers had a flake-like structure, where the crystal boundaries were evident. EDX spectrum analyses (Fig. 4) confirmed the formation of apatite layers on the surface of the pure and doped samples.
![]() | ||
Fig. 4 Apatite formation (left) and EDX spectrum (right) of the (a) pure CS (b) ACS10 and (c) TCS10 after incubation in SBF for 14 days. |
In the present study, the incorporation of Ag and Ta in the CS structure decreased the release of Si ions into SBF resulting in an overall reduction in the dissolution of the CS bioceramic. Incorporation of Ag+ and Ta5+ enhances the density of CS ceramics, as it was previously discussed, and the higher density lower degradation.51 Further, Ag+ has a larger radius than Ca2+, which occupies more space in the crystal lattice and inhibits the movement and release of silicate anions and thereby decreases the dissolution rate of CS.
Ta5+ has a smaller ion radius than Ca2+, which provides more vacancies in the structure of CS leading to more ions being released and consequently a higher degradation rate of CS. This explains why the Si peak was more intensive in the EDX spectrum of ACS10 than TCS10. The ratio of Ca/P for Ag and Ta doped CS was 1.54, which was less than stoichiometric of HA (1.67). This was likely due to release of metallic cations into the SBF, which decreased the pH of the solution and finally lead to formation of another kind of calcium phosphate crystal; tricalcium phosphate (TCP), which was formed at a lower pH than hydroxyapatite.52
In case of silicon ions, the higher density of ACS and TCS samples resulted in a stronger bonding in the structure of CS leading to reduction of ion release in the SBF solution. Since the ion radius of Ag ion is larger than Ca ion it can occupy more vacancies in the lattice of CS bringing about reduction of ion movement and consequently reduced the release of Si ions into the SBF solution. On the other hand, the presence of Ta ion in the CS lattice created more spaces, which could boost ion release from the structure in comparison to the Ag doped specimens. However, the amount of Ta could weaken the crystal structure compared to pure CS. This was counteracted by the higher degree of densification effected by the Ta onto the doped CS structure, which prevented the release of ions in large quantities.
Fig. 5 also demonstrated that release of Ag ions into SBF solution increased from day one to day 7 as well as higher concentration of Ag into the CS lattice. The amount release of Ag ions from all ACS samples is less than 8 × 10⁻⁴ mM. Silver has a bactericidal activity at concentrations as low as 3.5 × 10⁻⁴ mM without toxic effects to mammalian cells. In vivo, silver levels below 2 × 10⁻³ mM in the blood were considered normal because every day humans ingest small amounts of silver, small amounts of which are resorbed by the intestine, the rest (majority) being excreted by the liver.53
The pH value of Ta and Ag containing CS ceramics-soaked solution was lower compared to pure CS ceramics (http://www.sciencedirect.com/science/article/pii/S0142961207002645 Fig. 6). Release of Ca and Si ions from CS into the solution can increase the pH value. The most important and interesting is that when bone forms, the crosslinking of the collagen chains and the subsequent precipitation of hydroxyapatite are pH dependent and require an optimally pH at the bone formation site.41 Our results showed that the ACS and TCS samples decreased the pH value in SBF, suggesting a potential preferable material for in vitro bone cell culture. On the other hand, even in higher concentrations of Ta and Ag, the pH value was not decreased to lower than 7.3 indicating there was no concern about acidification of SBF solution.
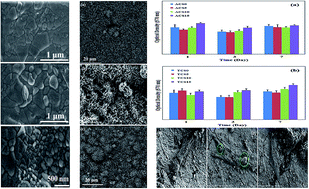
Cellular attachment and growth of the hFOB cells on the pure CS, ACS and TCS specimens were analyzed by FESEM. Fig. 8 shows the cellular morphology and attachment behavior on the surfaces of pure and doped CS after 1 day of culturing. As can be seen in the Fig. 8a–c, hFOB cells spontaneously attached to the surfaces with osteoblast phenotype extensions.
![]() | ||
Fig. 8 FESEM images of hFOB cells attachment to the surface of the (a) pure CS, (b) TCS10 and (c) ACS10 samples after 1 day cell seeding. |
As Ag is extensively used as antimicrobial agent, concerns regarding its cytocompatibility have been raised.53,54 MTT results (Fig. 7a) showed no significant negative effect on cellular proliferation on samples incorporating Ag due to lack of solubility. It must be noted that most of the reports regarding the cytotoxicity of silver have been related to the incorporation of silver oxide (Ag2O) in the structure of bioactive ceramics such as HA.
Ag can create hydroxyl radicals (˙OH) and superoxide anions (O2−) by photocatalytic reactions, which can lead to protein inactivation and eventual cell apoptosis55,56 which by proper doping of Ag cation in the lattice of CS, this problem can be greatly remedied. A small decrease in cell proliferation of ACS15 compared from day 1 to day 7 may indicate that an amount of Ag higher than 15% might increase the cytotoxicity.
With incorporation of tantalum in the structure of CS, the cell proliferation was increased at each time point (Fig. 7b). With increasing the amount of Ta in the lattice of CS, the MTT assay showed a slight increase in cell proliferation, which confirmed that Ta has a higher bioactivity than Ag. Cell attachment and growth were primarily associated with material surface characteristics such as wettability and surface energy.
A higher release of silicate and Ca ions into the cell culture medium could promote cell proliferation in the presence of TCS. On TCS extra cellular matrix (ECM) was secreted by the seeded hFOB cells and the cells merged on the surface of the samples to form cell layers. Merging induced the formation of a rich ECM indicative of high cell activity on TCS compared to ACS samples. Since bone is produced by the mineralization of an organic matrix (largely collagen) through the nucleation and growth of a mineral similar to HA, the presence of calcium phosphate in the ECM acts as a key factor in the regulation of bone remodeling and cartilage.57
This journal is © The Royal Society of Chemistry 2016 |