
 Open Access Article
 This Open Access Article is licensed under a
 Creative Commons Attribution 3.0 Unported Licence
Macroporous three-dimensional graphene oxide foams for dye adsorption and antibacterial applications†
Swetha
Jayanthi
a,
Neerugatti
KrishnaRao Eswar
a,
Satyapaul A.
Singh
b,
Kaushik
Chatterjee
c,
Giridhar
Madras
 *b and
A. K.
Sood
d
*b and
A. K.
Sood
d
aCentre for Nano Science and Engineering, Indian Institute of Science, Bangalore-560012, India
bDepartment of Chemical Engineering, Indian Institute of Science, Bangalore-560012, India. E-mail: giridhar@chemeng.iisc.ernet.in; Fax: +91 80 23600683; Tel: +91 80 22932321
cDepartment of Materials Engineering, Indian Institute of Science, Bangalore-560012, India
dDepartment of Physics, Indian Institute of Science, Bangalore-560012, India
First published on 18th December 2015
Abstract
Several reports illustrate the wide range applicability of graphene oxide (GO) in water remediation. However, a few layers of graphene oxide tend to aggregate under saline conditions thereby reducing its activity. The effects of aggregation can be minimized by having a random arrangement of GO layers in a three dimensional architecture. The current study emphasizes the potential benefits of highly porous, ultralight graphene oxide foams in environmental applications. These foams were prepared by a facile and cost effective lyophilization technique. The 3D architecture allowed the direct use of these foams in the removal of aqueous pollutants without any pretreatment such as ultrasonication. Due to its macroporous nature, the foams exhibited excellent adsorption abilities towards carcinogenic dyes such as rhodamine B (RB), malachite green (MG) and acriflavine (AF) with respective sorption capacities of 446, 321 and 228 mg g−1 of foam. These foams were also further investigated for antibacterial activities against E. coli bacteria in aqueous and nutrient growth media. The random arrangement of GO layers in the porous foam architecture allowed it to exhibit excellent antibacterial activity even under physiological conditions by following the classical wrapping-perturbation mechanism. These results demonstrate the vast scope of GO foam in water remediation for both dye removal and antibacterial activity.
1. Introduction
Environmental pollution caused by water-soluble toxic organic dyes released from the textile, paper and cosmetic industries has become a major concern in the environment.1,2 Various methods have been developed for treating these organic water pollutants. Among these techniques, adsorption is a simple, easy, inexpensive and efficient way of removing multiple components simultaneously.3,4 Several materials such as activated carbon,5 conducting polymers,6 mesoporous silica7 and mesoporous hybrid xerogels8 have been employed as sorbent materials for the adsorption of various dyes. Nanoscale materials such as CNTs, carbon fibers and fullerenes9–12 are excellent adsorbents due to their high surface-to-volume ratio compared to bulk adsorbents. However, the preparation of most of these materials involves sophisticated techniques such as chemical vapor deposition and the requirement of high pressure and high temperature conditions13 that can limit their use in the large-scale applications.In recent years, two-dimensional (2D) graphene-based materials such as graphene oxide (GO) and reduced graphene oxide (rGO) have gained significant interest due to their unique electronic, optical, mechanical and thermal properties.14–16 Moreover, the presence of surface functional groups and large surface area make these materials applicable in various fields such as sensors, water purification techniques, energy storage and catalysis.17–20 Ferrite nanoparticles decorated GO has been shown to be an excellent adsorbate for removing the heavy metals As(III), As(IV) and Pb(II).21 Hitherto, many GO and rGO-based materials have been employed as sorbent materials in dye removal applications.22–26 Although the single layered GO and rGO sheets are known to be efficient sorbent materials, the aggregation of the layers due to π–π interactions reduces the adsorption capacities. Furthermore, the requirement of centrifugation and magnetic separation techniques27–30 complicates the material recovery processes. Therefore, three-dimensional graphene (3D) architectures are desired as they enhance the adsorption ability and also allow the effective reuse of the material by simple recovery processes without the loss of material due to its 3D structure. Many methods such as sol–gel, hydrothermal and template method have been developed in preparing graphene foams.31–34
Among the several methods known, lyophilization is a simple, flexible, effective eco-friendly method that allows the preparation of various dimensions of foams depending on the dimensions of the containers used.35 Due to its high surface-to-volume ratio and ease of material recovery, these ultra-light, highly porous graphene foams and their composites have been employed in water remediation. In this direction, Liu et al. reported the preparation of 3D graphene oxide sponges by a simple centrifugal vacuum evaporation method. These foams exhibited adsorption capacities 397 and 467 mg g−1 for methylene blue (MB) and methyl violet (MV) dyes, respectively.36 Sui et al.37 have reported the adsorption capacities of ∼800 mg g−1 for 3D porous GO–PEI (polyethyleneimine) composite foams for acidic dyes such as Amaranth dyes. 3D reduced graphene oxide architectures are also known for the removal of methylene blue, rhodamine B and methyl orange dyes. These porous rGO sponges were prepared by the hydrothermal treatment of graphene oxide sheets with the assistance of thiourea.38 These 3D architectures exhibited good adsorption abilities towards all the three dyes. However, to the best of our knowledge, the dye adsorption studies on GO foams prepared by lyophilization method have not been reported.
Along with the removal of toxic water-soluble organic dyes to prevent environmental pollution, degradation of water-borne microorganisms is also a crucial issue to be addressed. Microorganisms cause biofouling and eventually the degradation of metal surfaces interfering with many of the industrial applications.39,40 Several anti-biofouling coatings have been developed for controlling the microbial growth. But these coatings release toxic substances such as metals and antibiotics for the inhibition of microbial growth that causes secondary pollution.41 Therefore, the development of eco-friendly and effective anti-biofouling materials is a prerequisite. In this regard, graphene-based materials have been exploited for various applications such as biomedical,42 water disinfection43 and in controlling crop diseases.44 This is because of the direct contact mode of action of graphene-based materials against microbes and their excellent properties such as surface modification, good water dispersibility and good mechanical strength.45,46 Several studies have been conducted to understand the mechanism of antimicrobial activity of graphene-based materials.43,44,47–51 Graphene-based materials especially GO, loses its activity under physiological conditions due to the aggregation effects caused by π–π interactions.47 Therefore, 3D architectures with interconnected layers in random arrangement can prevent the layer aggregation retaining the surface area of the material and its activity even under saline conditions. This motivated us to study the antibacterial activities of 3D macroporous GO foams prepared by lyophilization technique. To the best of our knowledge, antibacterial activity of 3D graphene architectures has not been reported till date.
In this present study, ultra-light, highly porous 3D GO foams were prepared by a simple and effective lyophilization technique. The porosity of the foams can be tuned by simply varying the concentrations of GO dispersions and the dimensions of the foams can be varied by choosing appropriate containers for lyophilization. The foams are used directly after lyophilization without pretreatment such as ultrasonication. The as-prepared GO foams were employed in the removal of three toxic cationic dyes (rhodamine B, malachite green and acriflavine) and for the degradation of E. coli bacteria. The antibacterial activities of GO foam and adsorption studies of acriflavine dye on graphene-based materials are reported for the first time. The adsorption capacities of these foams are found to be comparable to the GO precipitate, while the 3D foams exhibited higher antibacterial activities towards E. coli both in aqueous and nutrient growth media compared to the GO precipitate. This behavior can be attributed to the 3D porous architecture of the GO foam. The random arrangement of GO layers in the porous architecture of GO foams help in retain the activity even under saline conditions by reducing the extent of layer aggregation.
2. Experimental section
2.1. Synthesis of GO foam
Graphene oxide (GO) was synthesized by chemical oxidation of graphite using simplified Hummer's method.46 Commercially procured graphite flakes (Superior Graphite Co.) (2 g) were added to the mixture of H2SO4![[thin space (1/6-em)]](https://www.rsc.org/images/entities/char_2009.gif) :H3PO4 (110:12 mL) and allowed to stir for 2–3 min. Subsequently, KMnO4 (11.1 g) was slowly added and the resulting mixture was stirred for three days at room temperature. Finally, H2O2 (30%, 20 mL) was added to stop the reaction. The yellow precipitate obtained was washed repeatedly with 1 M aqueous HCl solution and distilled water until a pH of 4–5 was achieved. Dark brown gel of graphene oxide (GO) was obtained, which was collected by centrifuging the solution at 10000 rpm. GO foams of weight ratio, 1 wt% were prepared by freeze-drying the dispersion of above-obtained GO precipitate (10 mg) in water (1 mL) in a lyophilizer35 (Free zone 2.5 plus) for three days. The as-prepared GO foams were characterized using X-ray diffractometer (Rigaku instrument, Cu Kα (λ = 1.5418 Å)), field emission scanning electron microscope (Zeiss Ultra FE-SEM), Fourier transform-infrared spectroscopy (Perkin Elmer FT-IR spectrometer), Raman spectroscopy (Witec spectrometer with 514 nm excitation), and porosity measurements (XRadia Versa XRM-500).
:H3PO4 (110:12 mL) and allowed to stir for 2–3 min. Subsequently, KMnO4 (11.1 g) was slowly added and the resulting mixture was stirred for three days at room temperature. Finally, H2O2 (30%, 20 mL) was added to stop the reaction. The yellow precipitate obtained was washed repeatedly with 1 M aqueous HCl solution and distilled water until a pH of 4–5 was achieved. Dark brown gel of graphene oxide (GO) was obtained, which was collected by centrifuging the solution at 10000 rpm. GO foams of weight ratio, 1 wt% were prepared by freeze-drying the dispersion of above-obtained GO precipitate (10 mg) in water (1 mL) in a lyophilizer35 (Free zone 2.5 plus) for three days. The as-prepared GO foams were characterized using X-ray diffractometer (Rigaku instrument, Cu Kα (λ = 1.5418 Å)), field emission scanning electron microscope (Zeiss Ultra FE-SEM), Fourier transform-infrared spectroscopy (Perkin Elmer FT-IR spectrometer), Raman spectroscopy (Witec spectrometer with 514 nm excitation), and porosity measurements (XRadia Versa XRM-500).
2.2. Adsorption studies
The adsorption characteristics of three cationic dyes were studied in the present work. The dyes chosen for present study are malachite green (MG), rhodamine B (RB) and acriflavine (AF) and structures of all three dyes are given in the Fig. S1 (see ESI†). For adsorption equilibrium studies, 3 mg of GO foam/GO precipitate (which were cut into fine number of pieces) was loaded in 10 mL of respective dye solution and kept in an incubator shaker at 37 °C for the period of 8 h. Contact time studies were performed in 30 mL dye solutions with the same GO foam loading (0.3 g L−1) under various pH conditions. The pH variation experiments were performed by using buffer capsules of pH 4.0 ± 0.1, 7.0 ± 0.1 and 9.2 ± 0.1 respectively. The concentrations of all dyes were analyzed at their characteristic wavelength (λmax,MG = 617 nm, λmax,RB = 543 nm and λmax,AF = 464 nm) by using UV-visible spectrometer (Shimadzu 1700). For kinetic studies, 9 mg of GO foam was loaded in 30 mL of respective dye solutions and kept in an incubator shaker at 37 °C. The concentration of dye molecules were analyzed from the absorbance at the characteristic wavelength by recording absorption spectra at time intervals of 30 min over a period of 3 h.2.3. Point of zero charge (PZC) studies
The point of zero charge of GO foam was determined by pH drift method. In this method, various pH solutions were prepared by adding 0.1 M HCl and 0.1 M NaOH solutions to 0.1 M NaCl solution. 9 mg of GO foam was dispersed in 10 mL of each pH solution. These solutions were well mixed and kept in dark for 24 h. The initial and final pH of the solutions were plotted, the point of intersection of the obtained experimental data and 45° line is noted as point of zero charge of the material.2.4. Procedure for antibacterial evaluation
The accessories necessary for microbial growth and plating such as nutrient broth and nutrient agar solutions, Petri plates, micro tips, L-rods were autoclaved. Escherichia coli (MG 1655) was cultured in sterile liquid nutrient broth. The culture was centrifuged for 10 min at 5000 rpm to pellet the bacterial cells. The concentration of bacteria was maintained by re-suspending the pellet in sterile water. Sterile nutrient agar solution was equally poured into the Petri plates and solidified inside the laminar flow chamber. Experiments were conducted with 0.1 g L−1 of GO materials in bacterial suspension. For bacterial growth experiment, 0.1 g L−1 each of GO foam and GO precipitate were suspended into sterile nutrient broth separately without any pretreatment and inoculated with seed culture of bacteria obtained from its log phase of growth. To measure antibacterial activity, aliquots of suspensions were taken at specific intervals and its OD was measured using spectrophotometer at 600 nm. Similarly for plating, 100 μL of serial diluted samples were spread onto solidified nutrient agar plates and incubated at 37 °C for overnight. The experiment was repeated and the bacterial colonies were counted and then evaluated for the bacterial degradation studies.3. Results and discussion
Morphology of 2D GO flakes prepared by dispersing GO precipitate in water and 3D GO foam (1 wt%) prepared by lyophilization technique are characterized by FE-SEM. GO flakes have an average size of 10–20 μm, as shown in the Fig. 1a. Interconnected highly porous structure with pore size ranging from few microns to few tens of microns can be observed in the SEM image of GO foam (Fig. 1b). | ||
| Fig. 1 FE-SEM images of (a) GO flake and (b) GO foam of 1 wt%. | ||
The incorporation of oxygen functional groups in GO foam during the oxidation of graphite is confirmed using FT-IR and XRD analysis. FT-IR spectrum of GO foam (Fig. S2a†) reveals the presence of the following functional groups: hydroxyl (–OH), carbonyl (C![[double bond, length as m-dash]](https://www.rsc.org/images/entities/char_e001.gif) O), aromatic CC, carboxyl (C–OH), epoxy (O–C–O) and alkoxy (C–O) observed at 3427, 1730, 1626, 1384, 1223 and 1048 cm−1 wavenumbers, respectively.52 IR bands at 2852, 2924 and 2958 cm−1 are assigned to the symmetric and asymmetric stretching vibrations of CH2 and asymmetric stretching vibrations of CH3 groups, respectively. XRD spectrum of GO foam shows a sharp diffraction peak at 10.3° corresponding to the interlayer spacing of 8.6 Å (Fig. S2b†). The large d-spacing in GO foam compared to graphite (3.4 Å) also confirms the presence of oxygen functional groups in GO foam.53
O), aromatic CC, carboxyl (C–OH), epoxy (O–C–O) and alkoxy (C–O) observed at 3427, 1730, 1626, 1384, 1223 and 1048 cm−1 wavenumbers, respectively.52 IR bands at 2852, 2924 and 2958 cm−1 are assigned to the symmetric and asymmetric stretching vibrations of CH2 and asymmetric stretching vibrations of CH3 groups, respectively. XRD spectrum of GO foam shows a sharp diffraction peak at 10.3° corresponding to the interlayer spacing of 8.6 Å (Fig. S2b†). The large d-spacing in GO foam compared to graphite (3.4 Å) also confirms the presence of oxygen functional groups in GO foam.53
Porosity of the GO foam of 1 wt% is characterized using X-ray tomography. Three dimensional view of the bulk foam is shown in Fig. 2a. The volume of voids present in the bulk foam is found by scanning the foam in 900 frames in depth. From Fig. 2b, red color of the two-dimensional slices indicates the material, whereas the voids are represented by the dark background. The porosity of GO foam is found to be 86%. Further, the porous structure of the foam is characterized in detail using Avizo analysis model on micro CT images. The voids and the material are clearly marked in the Fig. 3a. Pore diameter distribution of the foam is analyzed by choosing a small volume of the foam as shown in the Fig. 3a. Equivalent diameter of the pores is found by processing the binary image after filtration process. The distribution of the equivalent diameter of the pores is given in the histogram (Fig. 3b) and the range is found to vary from a few microns to 1500 μm. Maximum number of pores have diameter below 100 μm. As the GO layers are separated far apart, the aggregation of GO layers is diminished under saline conditions. Therefore, more number of GO layers (i.e. high surface area) is exposed to bacteria and dye molecules, improving the activity of the GO foam. The 3D highly porous GO foams prepared by simple lyophilization technique have shown higher surface area in comparison to their 2D counterparts. Therefore, these macroporous GO foams can be employed as highly efficient materials in water purification applications.
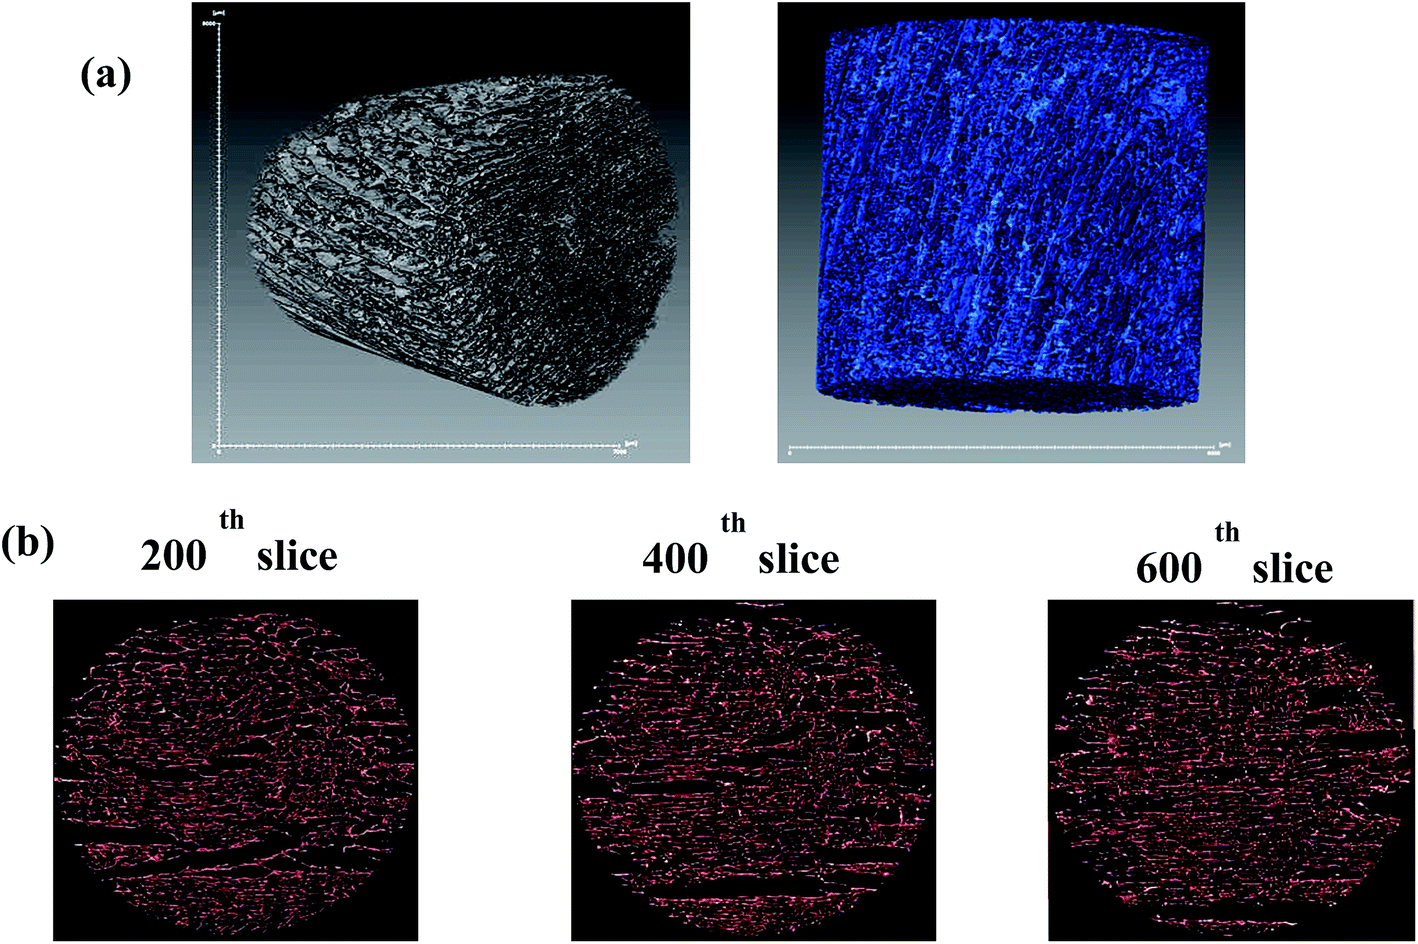 | ||
| Fig. 2 (a) Three dimensional XT micrographs of GO foam (scale bar is 7000 μm), (b) two dimensional images of different slices of the above foam. Slice numbers are given above the images. Pseudo colors are given for the better visibility of the images. | ||
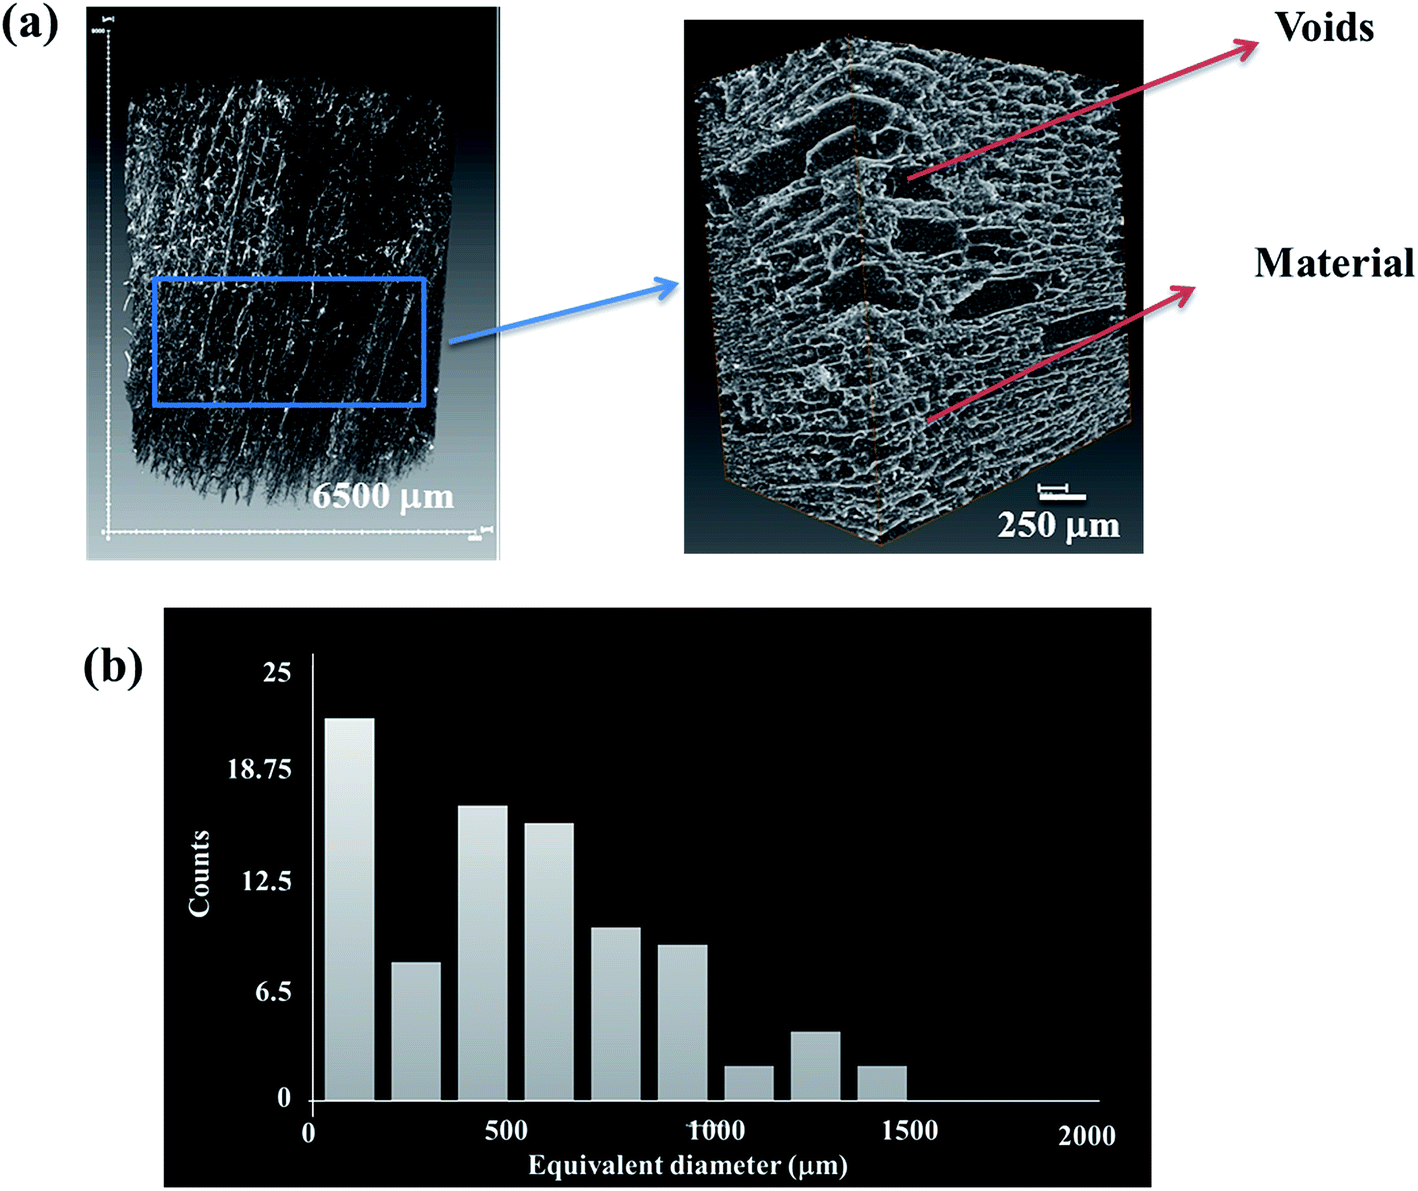 | ||
| Fig. 3 (a) 3D binary images of GO foam and the portion of the foam considered for the pore diameter analysis, (b) distribution of equivalent diameter of pores in GO foam. | ||
3.1. Adsorption isotherms
Fig. 4a depicts the adsorption isotherms of all the three dyes on GO foam indicating the amount of dye adsorbed per g of GO foam versus the concentration of dye in the bulk solution over a period of 8 h. In order to understand the adsorption mechanisms and the affinity of dye molecules towards the adsorbent, experimental data are analyzed using Langmuir–Freundlich adsorption isotherm model. The Langmuir–Freundlich model describes both Langmuir-type and Freundlich-type adsorption behaviors54 and it is expressed by the eqn (1), | (1) |
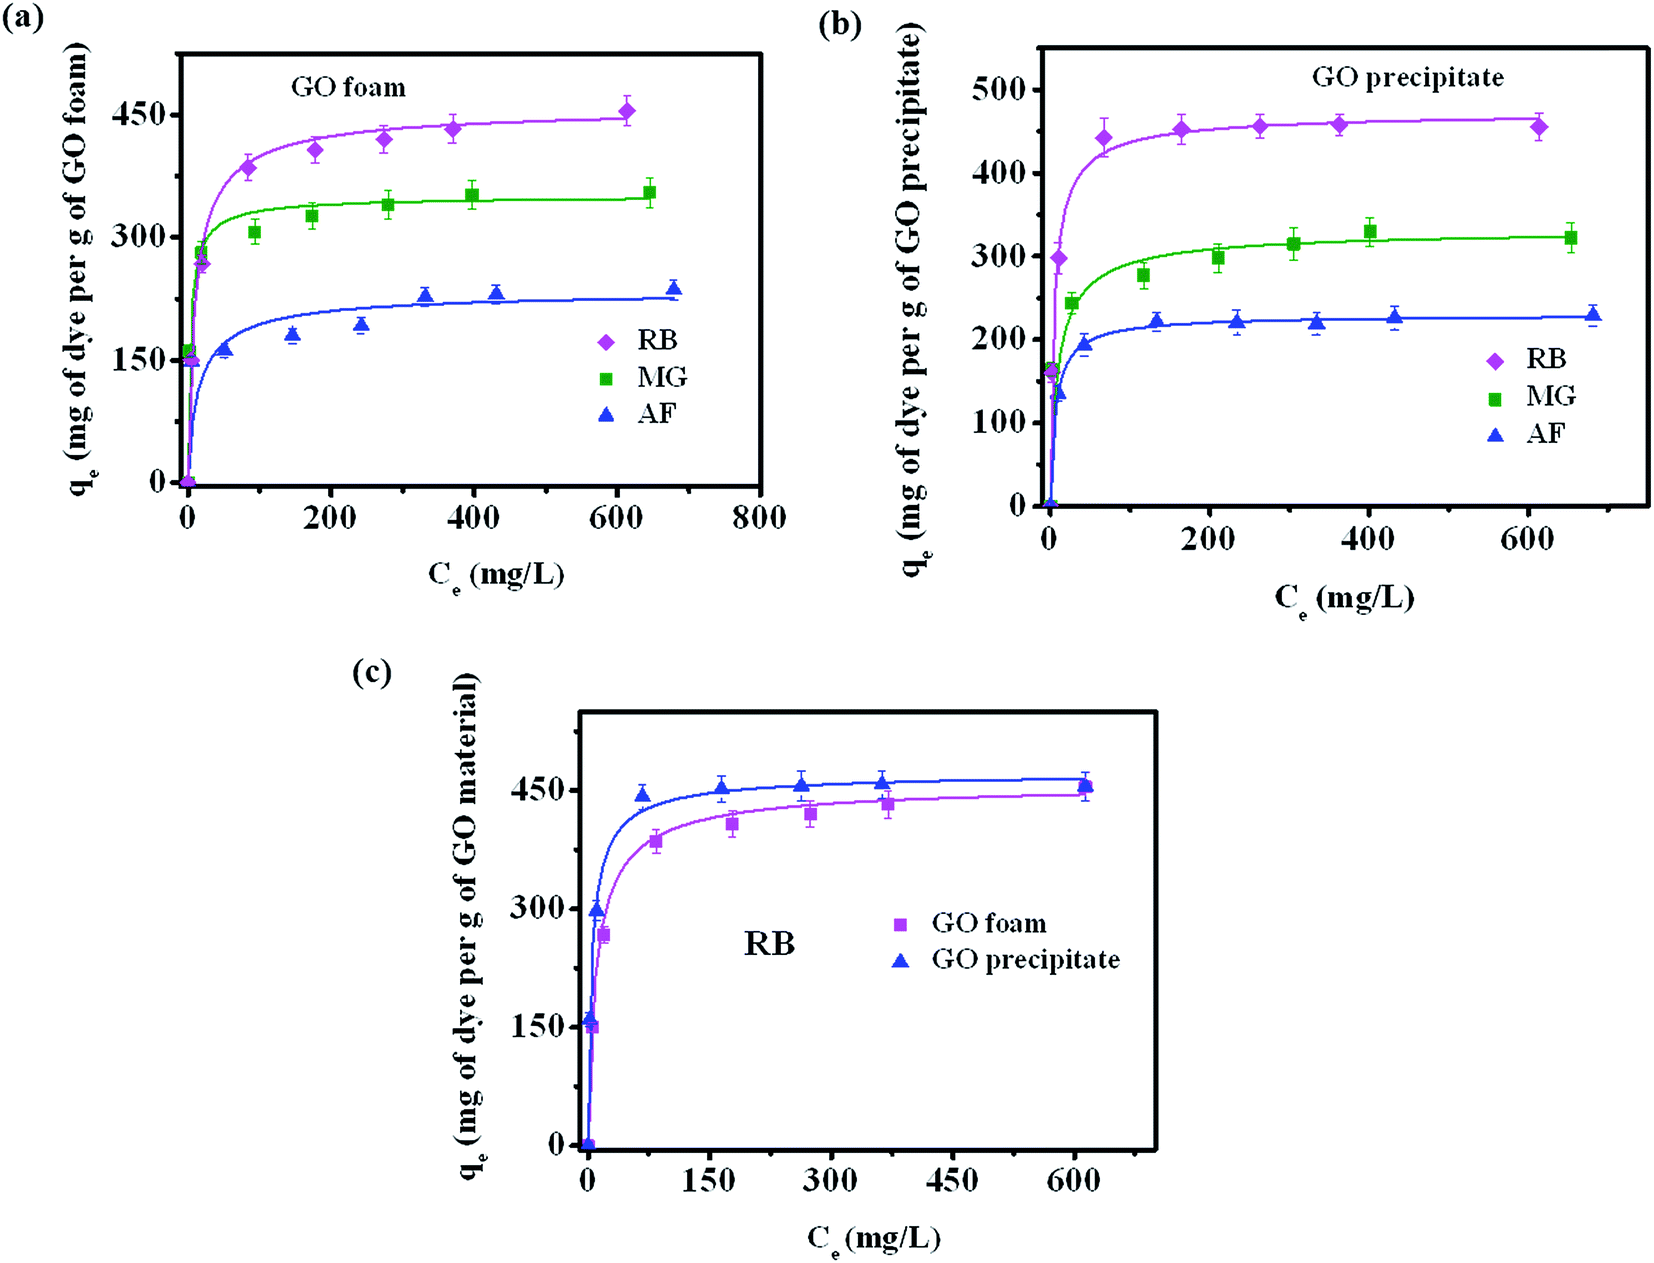 | ||
| Fig. 4 Adsorption isotherms and the corresponding fitting plots of RB, MG and AF dye molecules on (a) GO foam, and (b) GO precipitate at 37 °C and natural pH (∼3). Concentration of GO foam is 0.3 g L−1 and adsorption time is 8 h. (c) Comparison plot of adsorption isotherms of RB dye on GO foam and GO precipitate. | ||
| Dye | Parameters | GO foam | GO precipitate |
|---|---|---|---|
| RB | Q (mg of dye per g of GO materials) | 460 ± 13.0 | 474 ± 10 |
| n F | 1.20 ± 0.02 | 1.23 ± 0.08 | |
| K LF | 0.141 ± 0.033 | 0.280 ± 0.039 | |
| MG | Q (mg of dye per g of GO materials) | 351.4 ± 10.9 | 333.2 ± 29 |
| n F | 1.20 ± 0.03 | 1.20 ± 0.1 | |
| K LF | 0.373 ± 0.098 | 0.15 ± 0.03 | |
| AF | Q (mg of dye per g of GO materials) | 235.4 ± 21.6 | 231 ± 4 |
| n F | 1.20 ± 0.06 | 1.11 ± 0.06 | |
| K LF | 0.099 ± 0.009 | 0.190 ± 0.045 |
Among the three dyes, equilibrium amount of dye adsorbed on the foam surface for a given concentration of dye molecules is observed to be more in the case of RB (446 mg g−1) compared to MG (320 mg g−1) and AF (228 mg g−1) under acidic conditions (pH ∼ 3) (Fig. 4a). This variation in the adsorption is due to the different interactions of various functional groups present on dye molecules and the GO surface. Similar experiments with all three dyes are also carried out with GO precipitate dispersed in dye solution (represented as GO precipitate). The respective adsorption curves are shown in the Fig. 4b. Similar trend of dye adsorption is also observed with GO precipitate. Fig. 4c displays the comparison plot of GO foam and precipitate towards the dye adsorption of RB. Plots for other dyes MG and AF are shown in Fig. S3.† It is clearly seen from the plots of RB and AF that the equilibrium concentration of dye adsorbed on GO foam is lesser in comparison to GO precipitate at low dye concentrations. This can be attributed to the porosity effect in the case of foam that allows the dye molecules to diffuse slowly into the pores in contrast to the precipitate where GO flakes are well dispersed in dye solution. The equilibrium amount adsorbed at higher concentrations is similar in both the cases. Even though the equilibrium dye adsorption is lower at low dye concentrations, the GO foam has an additional advantage over the GO precipitate in the recovery process, where there is no need of employing techniques such as ultrahigh centrifugation in recovering the material after dye adsorption.
We have also carried out the experiments to show the advantage of the GO foam over GO precipitate in recovering the material after adsorption process. GO foam of 1 wt% and GO precipitate of equal weight (6 mg) were added separately to the dye solutions (rhodamine B) of 5 ppm concentration. The material is allowed for the adsorption of dye until the solution became nearly colorless. GO foam and GO precipitate took approximately 24 and 48 h respectively for nearly complete adsorption. The corresponding photographs are shown in Fig. S4.† It is clearly evident from Fig. S4† that GO foams are intact whereas GO precipitate starts dispersing slowly in the solution making the material recovery process easy in the case of foams compared to precipitate.
Therefore, the foams can be recovered completely without any sophisticated techniques whereas in the case of GO precipitate, centrifugation is required for the complete recovery of the material. This makes the material recovery process easy in the case of foams compared to precipitate. Moreover, because of relatively high surface area, foams require less time for the adsorption of same amount of dye when compared to GO precipitate. The activity of GO can be increased by dispersing the precipitate in the dye solution using ultrasonication. However, the complete removal of material requires centrifugation for prolonged times. The relatively high surface area and the intactness of the structure increase the applicability of GO foams in dye removal processes. The usage of foams also prevents the secondary pollution caused by the residual GO particles that can still remain in the solution in the case of well dispersed GO precipitate even after prolonged centrifugation.30
The adsorption mechanism of dye involves the following four steps: (1) dye diffusion in the bulk liquid phase, (2) diffusion through boundary layer, (3) intraparticle diffusion and (4) adsorption on active sites. Dye diffusion in the bulk liquid phase and within the particle determines the kinetics of adsorption of dye molecules. Fig. 5a–c display the adsorption plots of all three dyes at different time intervals under different pH conditions. The concentration of dye molecules in the solution phase declines sharply in the initial time periods that indicates faster adsorption kinetics. This is due to the availability of higher number of vacant sites for adsorption in the initial time period and these vacant sites saturate over time. The experimental data are analyzed using both pseudo-first order (PFO) and pseudo-second order (PSO) kinetic models55 that are represented by the following eqn (2) and (3), respectively
| C = C0e−k′t | (2) |
 | (3) |
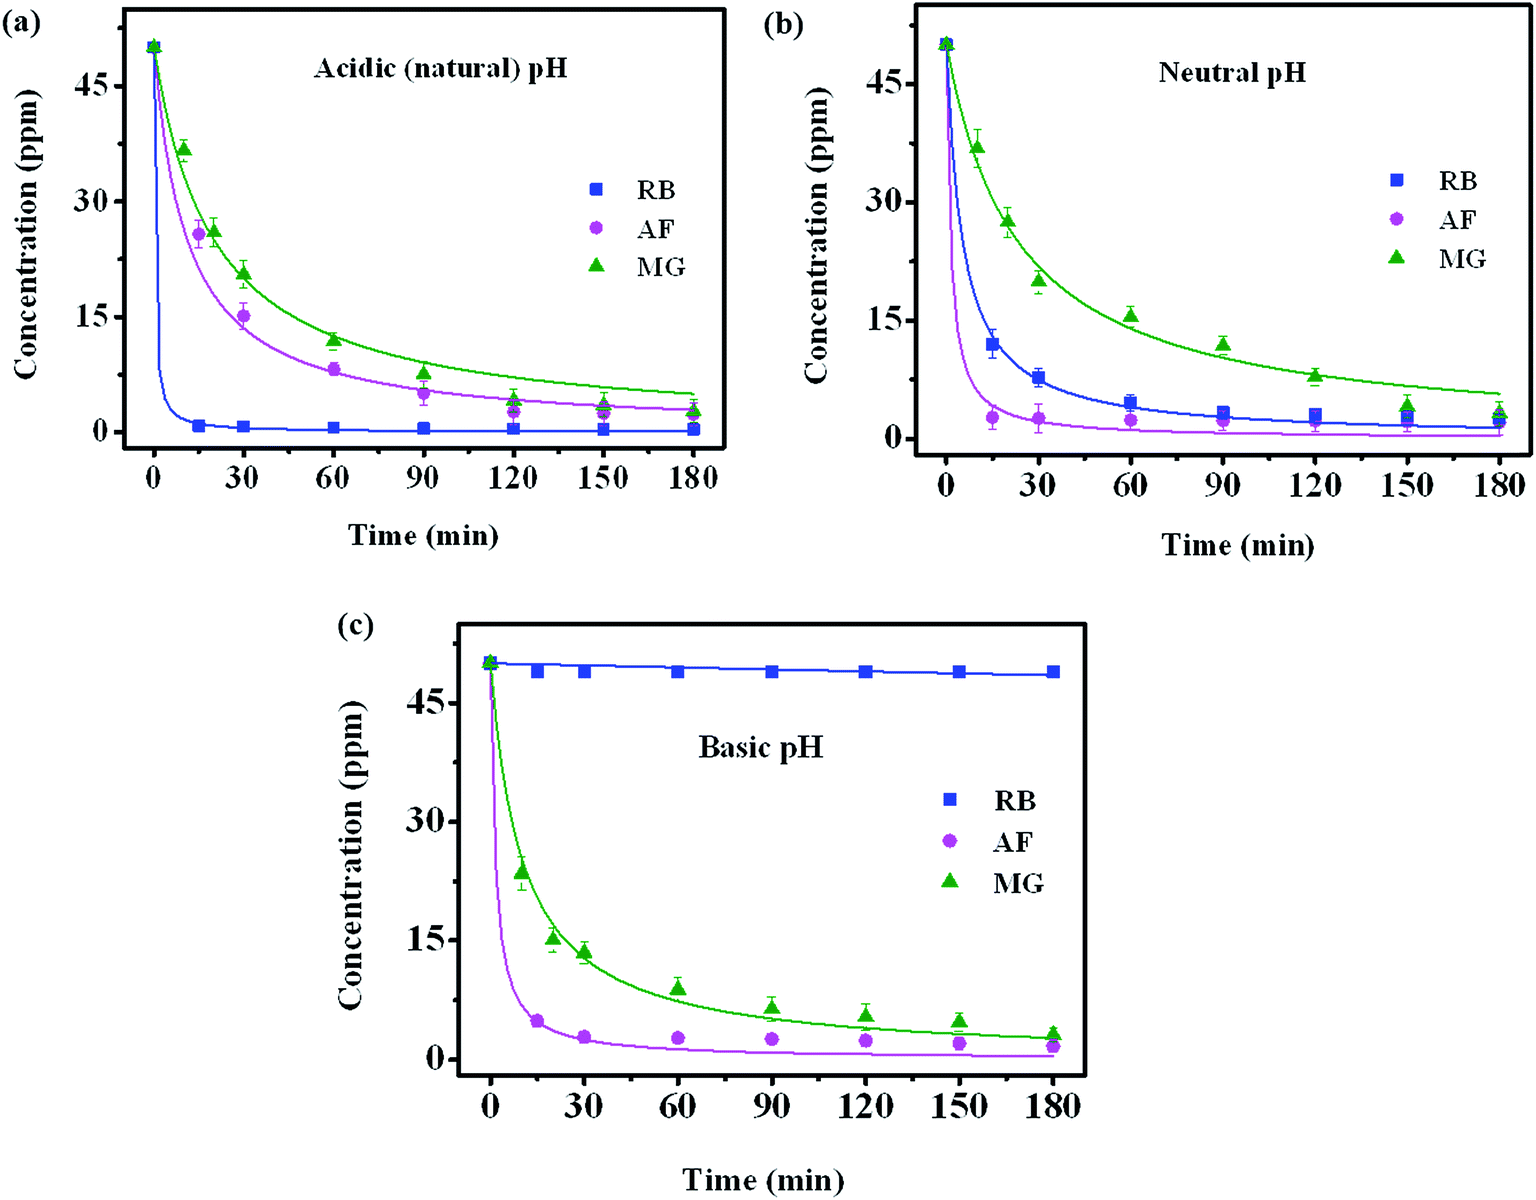 | ||
| Fig. 5 Kinetic adsorption plots and the corresponding pseudo-second order fitting plots of RB, MG and AF dyes under (a) acidic pH, (b) neutral pH and (c) basic pH conditions. Concentration of GO foam is 0.3 g L−1 and adsorption time is 3 h. | ||
| Dye | PFO | PSO | ||||
|---|---|---|---|---|---|---|
| pH = 3.7 ± 0.2 | pH = 6.6 ± 0.1 | pH = 9.5 ± 0.1 | pH = 3.7 ± 0.2 | pH = 6.6 ± 0.1 | pH = 9.5 ± 0.1 | |
| MG | 0.022 ± 0.001 | (2.28 ± 0.03) × 10−2 | (55.50 ± 0.07) × 10−3 | (57.40 ± 1.6) × 10−3 | (0.857 ± 0.103) × 10−3 | (1.94 ± 0.02) × 10−3 |
| AF | 0.032 ± 0.002 | (18.71 ± 0.11) × 10−2 | 0.183 ± 0.086 | (1.27 ± 0.02) × 10−3 | (14.45 ± 0.98) × 10−3 | (12.65 ± 0.52) × 10−3 |
| RB | 0.272 ± 0.013 | (9.29 ± 0.24) × 10−2 | (1.704 ± 0.299) × 10−4 | (0.807 ± 0.010) × 10−3 | (3.04 ± 0.07) × 10−3 | (3.462 ± 0.031) × 10−6 |
The single resistance pore diffusion is expressed by Webber's pore diffusion model which is obtained from Fick's second law of diffusion.55 The model is expressed by eqn (4)
| q = kit0.5 + c | (4) |
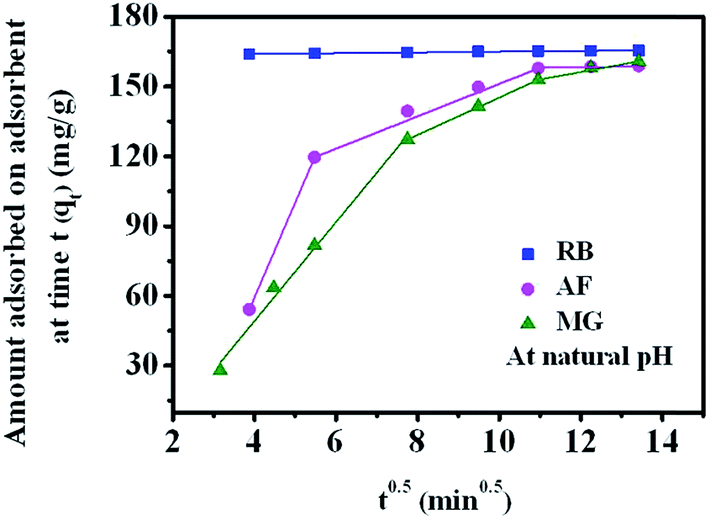 | ||
| Fig. 6 Intraparticle diffusion plot for the adsorption of RB, AF and MG on GO foam under natural pH condition (initial concentration of dye = 50 ppm, GO foam loading 0.3 g L−1). | ||
3.2. Dye interactions with GO foam
The three cationic dyes RB, MG and AF chosen for the present study belong to different classes of functional groups: xanthene fluorine rhodamine, triaryl methane and acridine respectively, but of similar molecular size.56 In order to understand the type of interactions present between dye molecules and the GO surface, pH dependent adsorption studies are carried out for all three dye molecules and the respective plots are shown in the Fig. 5. As the pH of the dye solution is increased, the adsorption capacity of RB molecules decreased, whereas the adsorption of AF and MG dye molecules increased.27 This is because of the different functional groups present in dye molecules and on the GO surface that undergo protonation and de-protonation based on the pH of dye solution. Point of zero charge of GO is found to be 2.02 (Fig. S5†).57 Under acidic conditions, as the pH of dye solution (∼3) is greater than the pHPZC, GO has negative charge on the surface. Therefore, all three dyes adsorb on the GO surface due to their cationic nature. These electrostatic interactions between the GO surface and dye molecules are also evident from the shifts observed in the Raman spectra of GO foam after dye adsorption. As known from the literature, in-plane bond stretching vibrations assigned as G-band in graphene is sensitive to the changes in electronic structure of graphene.58 Therefore, charge transfer from any adsorbed molecules leads to the stiffening or softening of phonons which can be seen as a shift in the G-band of graphene. In all the three dyes, shifts in the G-band towards lower wavenumbers (Fig. 7) are observed indicating that the electron transfer has occurred from adsorbed dye molecules to the GO surface. A significant bathochromic shift is also observed in the characteristic absorption peaks of RB and MG dyes on adsorption to the GO surface (Fig. S6†). This shows that there is a possible π–π interaction between the phenyl rings of dye molecules and the GO surface. Apart from the electrostatic and π–π interactions, hydrogen-bonding interactions between the carboxyl groups of GO and RB molecules are also possible as the carboxyl groups remain protonated under acidic conditions.59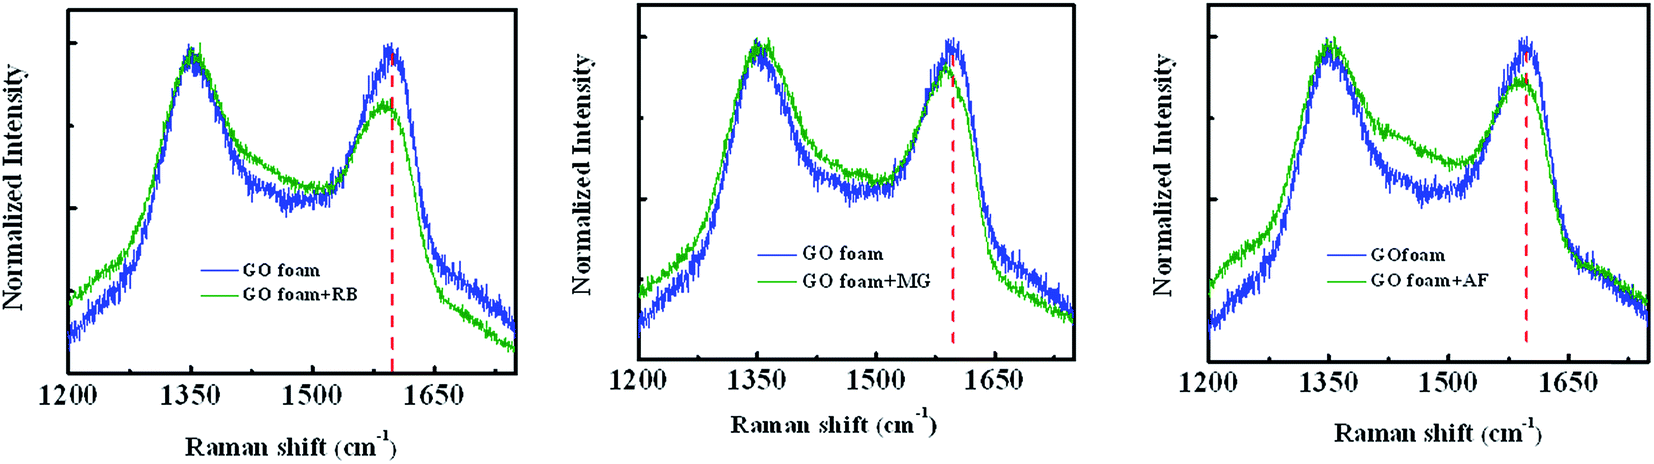 | ||
| Fig. 7 Raman spectra of GO foam before and after adsorption of RB, MG and AF dyes. | ||
Therefore, due to the additional hydrogen-bonding interactions along with π–π and electrostatic interactions, equilibrium adsorption follows the order of RB > MG > AF. Because of the presence of additional π–π interactions in MG molecules, adsorption is higher compared to AF molecules. The rate of adsorption in the initial time periods follows the order RB > AF > MG, under acidic conditions. Even though the equilibrium adsorption concentration is higher for MG molecules compared to AF molecules, the rate of adsorption is observed to be slightly faster in the case of AF molecules. This can be due to the presence of additional amine functional groups in AF molecules, which remain protonated under acidic conditions. Therefore, extra positive charge from protonated amino groups on AF molecules leads to the higher rate of diffusion of AF molecules to GO surface from bulk solution compared to MG molecules. But the presence of limited number of carboxylate groups at the edges on GO surface limits the equilibrium concentration of adsorption of AF molecules.
In the basic conditions, the carboxyl groups on GO exists in de-protonated state that increases the negative charge on GO surface. This can be inferred from the presence of a new peak corresponding to carboxylate ions (1635 cm−1) and the absence of –COOH peak at 1730 cm−1 in the FT-IR spectrum of GO (Fig. S7†). The higher negative charge on GO increases the adsorption of MG and AF dyes due to the increase in the electrostatic interactions and decrease in the interference of protons for adsorption at higher pH. However, in the case of RB, there is a negligible adsorption at higher pH because of the electrostatic repulsions between the negatively charged carboxylic groups present on both GO surface and RB molecules. Besides electrostatic interactions, the strong hydrogen bonding interactions between the amino groups on AF molecules and the carboxylate ions on GO favors the faster adsorption kinetics of AF on the GO surface compared to MG molecules even under basic pH conditions.
3.3. Antibacterial studies
Antibacterial activity of GO foam and GO precipitate towards E. coli bacteria is investigated by evaluating the growth curve and the degradation curve of bacteria in the presence and absence of GO materials. Loss of viability of bacterial cells is assessed by colony counting method after incubating the E. coli cells in aqueous medium containing either GO foam or GO precipitate for 5 h under shaking speed of 100 rpm. Fig. 8a shows the corresponding plot of bacterial degradation in the presence of GO materials. Bacterial loss gradually increased with time in the presence of both GO foam and GO precipitate. In the initial period, loss of cell viability is observed to be the same in both the cases but with progress in time, bacterial degradation is observed to be higher in the case of GO precipitate in comparison to GO foam. This can be attributed to the difference in the surface area of the GO exposed to the bacteria. As the solution is agitated, GO precipitate slowly disperses in water with time thus increasing the number of GO layers in the solution, whereas GO foam remained as such even after agitation.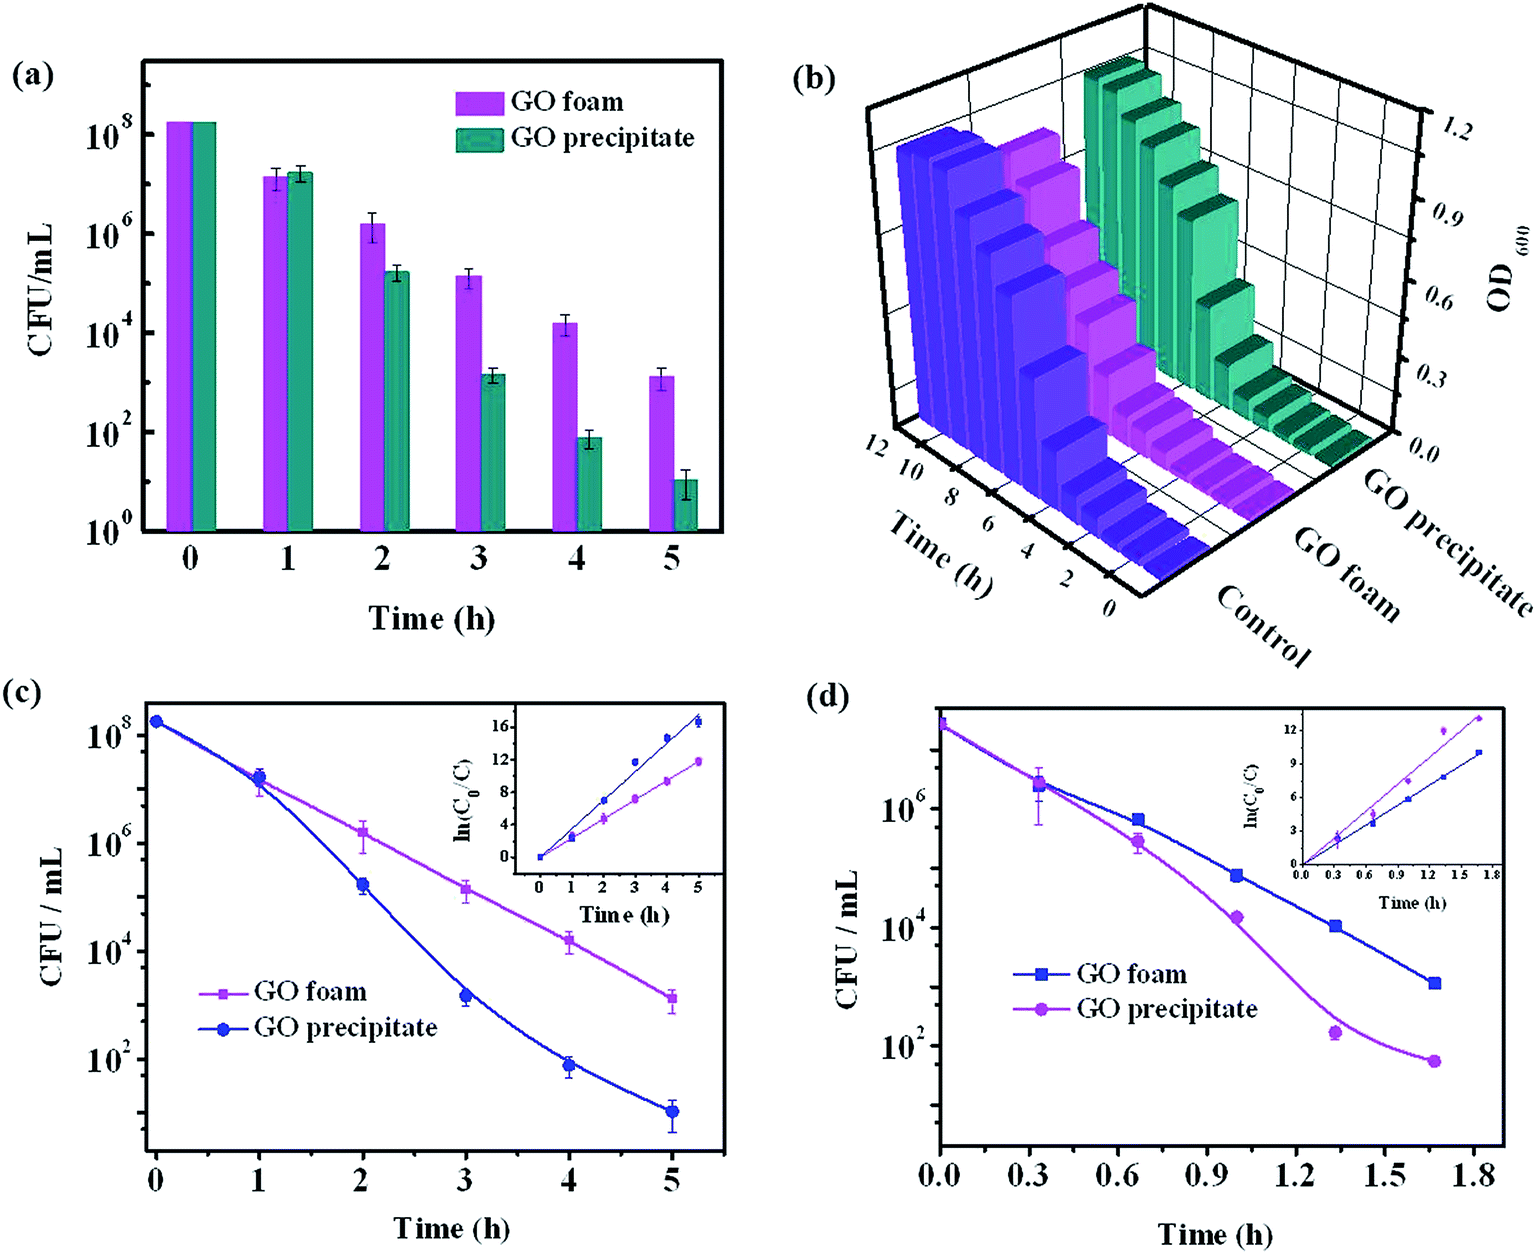 | ||
| Fig. 8 (a) Loss of cell viability of E. coli cells in the presence of GO foam and GO precipitate, (b) growth curve of E. coli bacteria in the absence (control) and presence of GO foam/GO precipitate, (c) and (d) first order kinetic plot for the bacterial degradation of GO materials at different initial concentrations of 1.8 × 10⁸ and 2.7 × 10⁷ CFU mL−1 respectively. GO materials were incubated with E. coli cells (1.8 × 10⁸ CFU mL−1) at 37 °C for 5 h and 12 h for the evaluation of loss of cell viability and growth curves respectively. Concentrations of GO materials used in experiments are 0.1 g L−1. | ||
Fig. 8b depicts the growth curve of E. coli cells in the presence and absence (control) of GO materials. Bacterial growth is monitored by growing the bacterial cells in nutrient broth medium and measuring the optical density value at 600 nm over different time intervals. Growth is observed to be relatively lower in the presence of GO foam compared to GO precipitate and the growth of the cells is almost similar in presence and absence of GO precipitate. This can be due to the aggregation of the GO layers under saline conditions, as the composition of nutrient broth medium consisted of salts. Cations in the salt medium neutralize the negatively charged carboxyl ions on the GO surface leading to the aggregation of GO layers because of π–π interactions. Therefore, GO precipitate is sparingly dispersed in saline solutions when compared to that in the distilled water.47 But in the case of GO foam, comparatively low aggregation is observed because of the random arrangement of GO layers. Moreover, the size of bacteria is observed to be less than 3 μm in one dimension, as shown in the SEM images (Fig. 9a and b). Due to the 3D macroporous nature of GO foams of pore size ranging from few microns to few tens of microns, these foams allow more degree of freedom to the bacteria towards the interior surfaces of GO layers. However, this penetration of bacteria is not possible in the case of GO precipitate as the interlayer spacing is in the range of nanometers. Therefore, in the case of GO precipitate, only outer exposed surfaces are responsible for the bacterial growth inhibition. However, in the case of foam, besides the outer surfaces, inner surfaces of the GO layers embedded in the porous structure also contribute to the inhibition of the bacterial growth. Therefore, 3D macroporous GO foams show better antibacterial activity even under physiological conditions, where the 2D GO layers lose their activity due to the aggregation of layers.
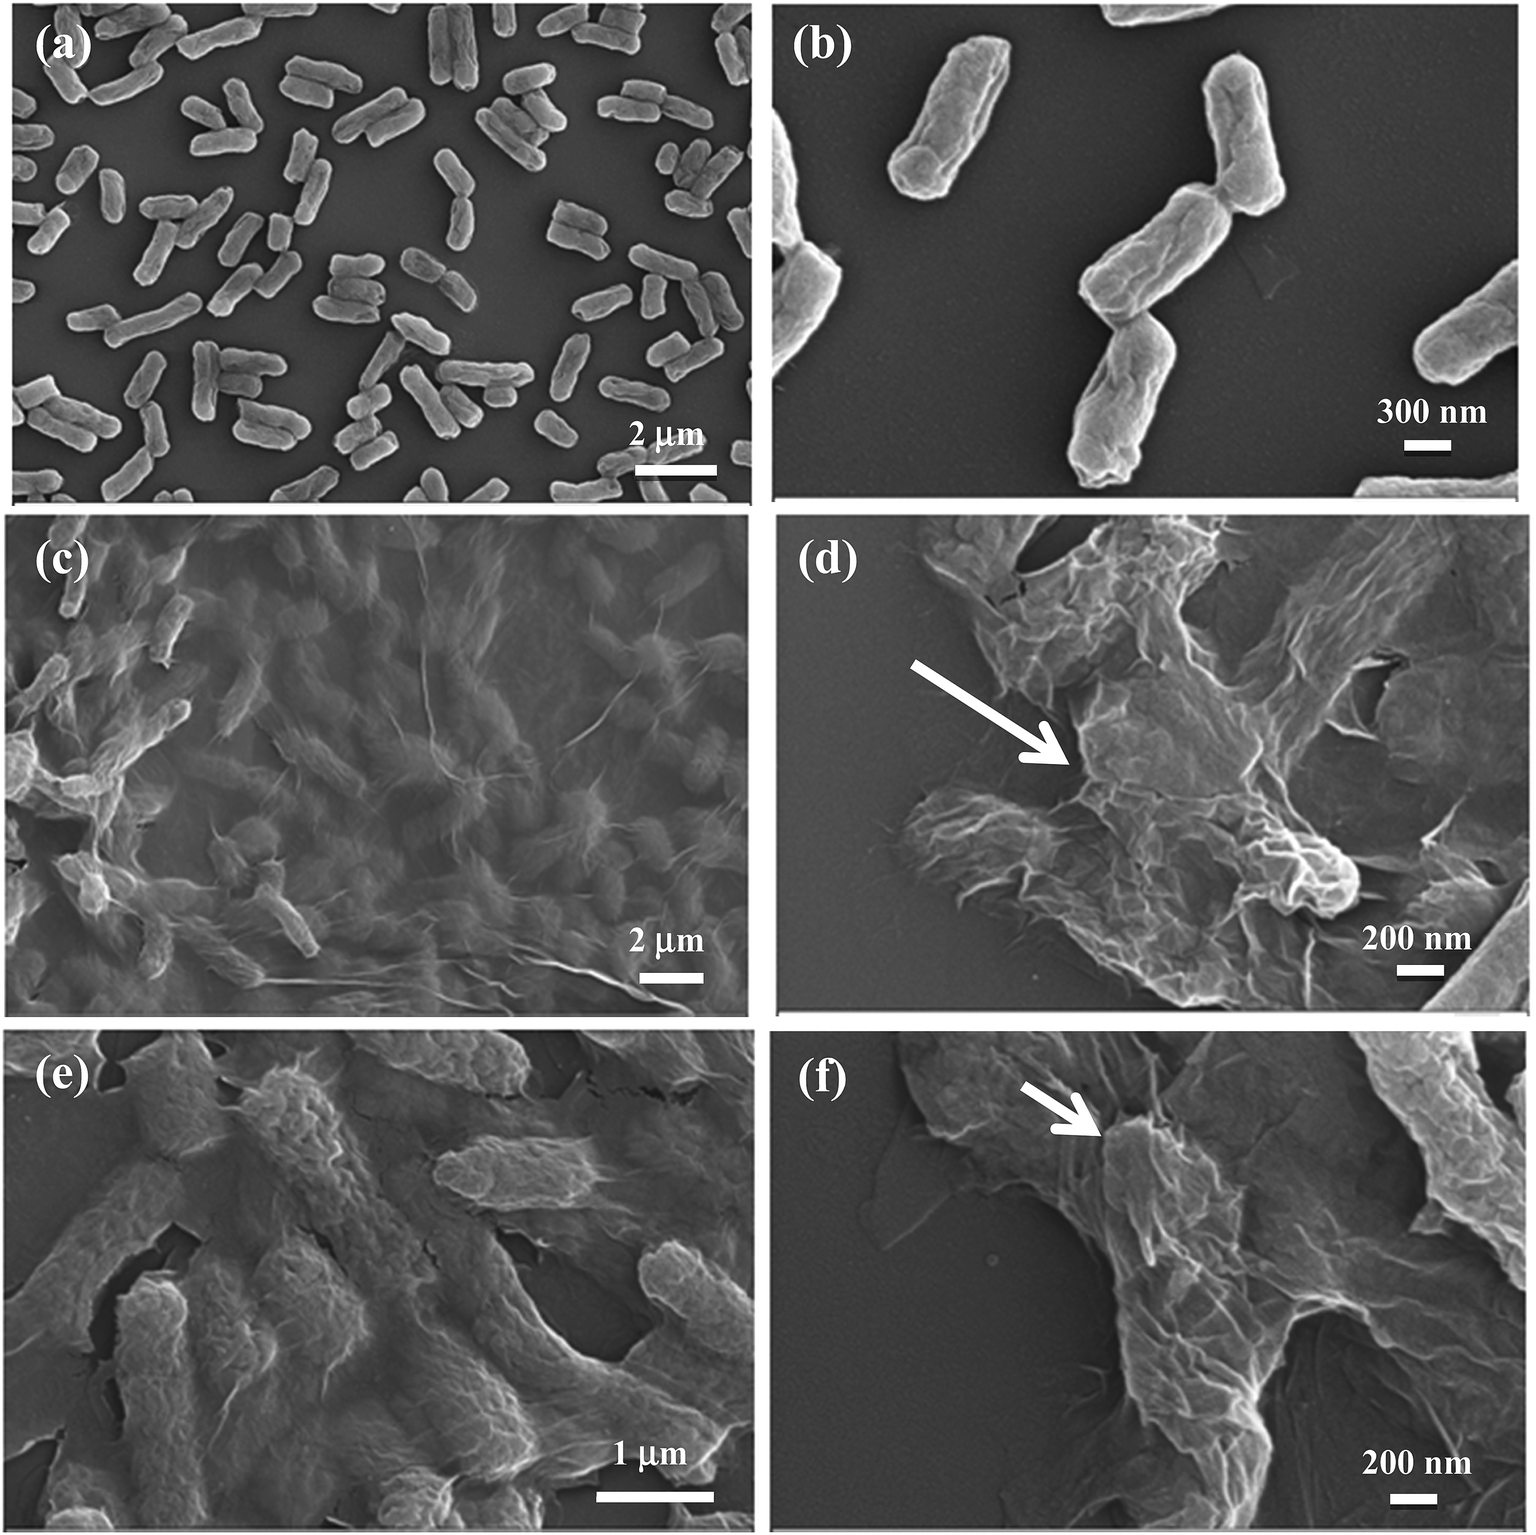 | ||
| Fig. 9 FE-SEM images of E. coli cells in the absence of GO materials (a and b), in the presence of GO precipitate (c and d), in the presence of GO foam (e and f). Arrows in the high magnification images show the disruption of cell membrane of E. coli cells in the presence of GO materials. | ||
Kinetic studies of bacterial degradation by GO foam and GO precipitate are also carried out by measuring the concentration of bacteria degraded at different time intervals for different initial bacterial concentrations. The respective plots are given in the Fig. 8c and d. The experimental data is found to fit with first order kinetic model. The rate constants evaluated for GO foam and GO precipitate are (5.96 ± 0.09) h−1 and (8.03 ± 0.3) h−1 respectively for the initial concentration of 2.7 × 10⁷ CFU mL−1. The values obtained for the initial concentration of 1.8 × 10⁸ CFU mL−1 are (2.40 ± 0.01) h−1 and (3.50 ± 0.12) h−1 respectively. The relatively lower rate of cell viability loss by GO foam is due to reduction in the accessible surface area for bacterial interaction.
3.4. Mechanism of antibacterial activity
Antibacterial mechanism and the interactions of bacterial cells with GO materials are further investigated by SEM analysis. FE-SEM images of E. coli cells before and after exposure to GO materials are shown in the Fig. 9a–f. It is clearly seen from the SEM images that the bacterial cells are intact in the absence of GO materials (Fig. 9a and b), whereas in the presence of either GO foam or GO precipitate, bacterial cells are wrapped by thin GO sheets and cell membranes are collapsed as shown in the Fig. 9c–f. Wrapping of bacterial cells by thin GO sheets isolates the cells from external growth medium interfering with the proton and nutrient uptake and also block the water channels of cells, as GO sheets are impermeable to many molecules.60 This perturbs the membrane potential of bacterial cells that disturbs the cell metabolic activities which eventually disrupts the cell membrane leading to the death of cells.44 It is reported that wrapping of the E. coli bacterial cells by graphene sheets biologically disconnect cells from growth medium preventing the cells to proliferate, resulting in the loss of cell viability.43 It is also known that GO causes oxidative stress on the bacterial cells resulting in the disruption of cell membrane.47,48 Apart from the above mechanisms, bacterial cell death can also be due to the charge transfer from bacteria to sharp edges of the GO and graphene which act as good electron acceptors damaging the cell membrane during the direct contact interactions of bacteria with the graphene materials as reported earlier.50,51SEM images clearly show that the death of bacterial cells is due to the wrapping of cells by thin GO sheets in both the cases of GO foam as well as GO precipitate. The variation in the antibacterial activities of foam and precipitate in different media is attributed to the difference in the exposed surface area of GO materials to bacterial cells. GO foam exhibits antibacterial activity in both aqueous as well as in the nutrient broth medium due to its highly porous 3D structure which retains the GO layers intact even under the saline conditions. Moreover, during water purification after bacterial degradation, GO foam can easily be separated from the respective media without the need of any sophisticated techniques in contrast to GO precipitate. Therefore, these macroporous GO foams pave the way for the future antibacterial applications even under the physiological conditions, where GO precipitate shows lower activities due to aggregation issues.
4. Conclusions
Macroporous, 3D GO foams were prepared by simple lyophilization technique from GO dispersions in water. These foams were further employed in dye adsorption and antibacterial applications. Because of its high surface area, these foams had shown efficient adsorption abilities towards the three cationic dyes such as RB, MG and AF. pH dependent adsorption studies resulted in the different sorption capacities of these foams based on the interactions with dye molecules. These foams also exhibited excellent antibacterial activities towards E. coli cells both in aqueous and saline environment unlike the GO precipitate which loses its activity in the presence of salt ions. The activity of GO foam even under saline conditions can be attributed to the 3D random arrangement of GO layers, which helps in decreasing the aggregation of GO layers. Porous foams have additional advantage over GO precipitate in material recovery processes. Due to 3D porous structure, GO foams can have better applicability in practical applications of water remediation, where most of the water bodies consist of salt ions. Further, the activities of these foams in environmental applications can be improved by tuning the porosity of these foams which is feasible by lyophilization.Acknowledgements
We thank Nanomission projects of the Department of Science and Technology (DST), India for financial support. Authors acknowledge Mr Sachin Kumar of Department of Materials Engineering, IISc for his help in acquiring micro CT images. K. C. acknowledges support from the DST Ramanujan fellowship. The corresponding author thanks DST for J.C. Bose fellowship.References
- P. Janos, Sorption of basic dyes onto iron humate, Environ. Sci. Technol., 2003, 37, 5792–5798 CrossRef CAS PubMed
.
- S. Srivastava, R. Sinha and D. Roy, Toxicological effects of malachite green, Aquat. Toxicol., 2004, 66, 319–329 CrossRef CAS PubMed
- Z. Sun, C. Li and D. Wu, Removal of methylene blue from aqueous solution by adsorption onto zeolite synthesized from coal fly ash and its thermal regeneration, J. Chem. Technol. Biotechnol., 2010, 85, 845–850 CrossRef CAS
- S. B. Wang, C. W. Ng, W. T. Wang, Q. Li and Z. P. Hao, Synergistic and competitive adsorption of organic dyes on multiwalled carbon nanotubes, Chem. Eng. J., 2012, 197, 34–40 CrossRef CAS
- J. Yener, T. Kopac, G. Dogu and T. Dogu, Dynamic analysis of sorption of Methylene Blue dye on granular and powdered activated carbon, Chem. Eng. J., 2008, 144, 400–406 CrossRef CAS
- D. Mahanta, G. Madras, S. Radhakrishnan and S. Patil, Adsorption and desorption kinetics of anionic dyes on doped polyaniline, J. Phys. Chem. B, 2009, 113, 2293–2299 CrossRef CAS PubMed
- K. Y. Ho, G. McKay and K. L. Yeung, Selective adsorbents from ordered mesoporous silica, Langmuir, 2003, 19, 3019–3024 CrossRef CAS
- Z. Wu, H. Joo and K. Lee, Kinetics and thermodynamics of the organic dye adsorption on the mesoporous hybrid, Chem.–Eng. J., 2005, 112, 227–236 CrossRef CAS
- C. H. Wu, Adsorption of reactive dye onto carbon nanotubes: equilibrium, kinetics and thermodynamics, J. Hazard. Mater., 2007, 144, 93–100 CrossRef CAS PubMed
- X. M. Ren, C. L. Chen, M. Nagatsu and X. K. Wang, Carbon nanotubes as adsorbents in environmental pollution management: a review, Chem. Eng. J., 2011, 170(2–3), 395–410 CrossRef CAS
- X. Qu, P. J. J. Alvarez and Q. Li, Applications of nanotechnology in water and wastewater treatment, Water Res., 2013, 47, 3931–3946 CrossRef CAS PubMed
- X. K. Cheng, A. T. Kan and M. B. Tomson, Naphthalene adsorption and desorption from aqueous C60 fullerene, J. Chem. Eng. Data, 2004, 49, 675–683 CrossRef CAS
- M. Kumar and Y. Ando, Chemical vapor deposition of carbon nanotubes: a review on growth mechanism and mass production, J. Nanosci. Nanotechnol., 2010, 10, 3739–3758 CrossRef CAS PubMed
- A. K. Geim and K. S. Novoselov, The rise of graphene, Nat. Mater., 2007, 6, 183–191 CrossRef CAS PubMed
- I. W. Frank, D. M. Tanenbaum, A. M. van der Zande and P. L. McEuen, Mechanical properties of suspended graphene sheets, J. Vac. Sci. Technol., B, 2007, 25, 2558–2561 CAS
- A. A. Balandin, S. Ghosh, W. Bao, I. Calizo, D. Teweldebrhan, F. Miao and C. N. Lau, Superior thermal conductivity of single-layer graphene, Nano Lett., 2008, 8, 902–907 CrossRef CAS PubMed
- T. Kobayashi, N. Kimura, J. Chi, S. Hirata and D. Hobara, Channel-length-dependent field-effect mobility and carrier concentration of reduced graphene oxide thin-film transistors, Small, 2010, 6, 1210–1215 CrossRef CAS PubMed
- F. Schedin, A. K. Geim, S. V. Morozov, E. W. Hill, P. Blake, M. I. Katsnelson and K. S. Novoselov, Detection of individual gas molecules adsorbed on graphene, Nat. Mater., 2007, 6, 9652–9655 CrossRef PubMed
- N. Shang, C. Feng, H. Zhang, S. Gao, R. Tang, C. Wang and Z. Wang, Suzuki–Miyaura reaction catalyzed by graphene oxide supported palladium nanoparticles, Catal. Commun., 2013, 40, 111–115 CrossRef CAS
- S. M. Maliyekkal, T. S. Sreeprasad, D. Krishnan, S. Kouser, A. K. Mishra, U. V. Waghmare and T. Pradeep, Graphene: a reusable substrate for unprecedented adsorption of pesticides, Small, 2013, 9, 273–283 CrossRef CAS PubMed
- S. Kumar, R. R. Nair, P. B. Pillai, S. N. Gupta, M. A. R. Iyengar and A. K. Sood, Graphene oxide–MnFe2O4 magnetic nanohybrids for efficient removal of lead and arsenic from water, ACS Appl. Mater. Interfaces, 2014, 6, 17426–17436 CAS
- G. K. Ramesha, A. V. Kumara, H. B. Muralidhara and S. Sampath, Graphene and graphene oxide as effective adsorbents toward anionic and cationic dyes, J. Colloid Interface Sci., 2011, 361, 270–277 CrossRef CAS PubMed
- S. Bai, X. P. Shen, X. Zhong, Y. Liu, G. X. Zhu, X. Xu and K. M. Chen, One-pot solvothermal preparation of magnetic reduced graphene oxide-ferrite hybrids for organic dye removal, Carbon, 2012, 50, 2337–2346 CrossRef CAS
- X. J. Bian, X. F. Lu, Y. P. Xue, C. C. Zhang, L. R. Kong and C. Wang, A facile one-pot hydrothermal method to produce SnS2/reduced graphene oxide with flake-on-sheet structures and their application in the removal of dyes from aqueous solution, J. Colloid Interface Sci., 2013, 406, 37–43 CrossRef CAS PubMed
- B. Li, H. Cao, J. Yin, Y. A. Wu and J. H. Warner, Synthesis and separation of dyes via Ni@reduced graphene oxide nanostructures, J. Mater. Chem., 2012, 22, 1876–1883 RSC
- S. S. Gupta, T. S. Sreeprasad, S. M. Maliyekkal, S. K. Das and T. Pradeep, Graphene from sugar and its application in water purification, ACS Appl. Mater. Interfaces, 2012, 4, 4156–4163 CAS
- H. Sun, L. Cao and L. Lu, Magnetite/reduced graphene oxide nanocomposites: one step solvothermal synthesis and use as a novel platform for removal of dye pollutants, Nano Res., 2011, 4, 550–562 CrossRef CAS
- Z. Geng, Y. Lin, X. Yu, Q. Shen, L. Ma, Z. Li, N. Pan and X. Wang, Highly efficient dye adsorption and removal: a functional hybrid of reduced graphene oxide–Fe3O4 nanoparticles as an easily regenerative adsorbent, J. Mater. Chem., 2012, 22, 3527–3535 RSC
- J. Y. Chen, Y. M. Hao, Y. Liu and J. J. Gou, Magnetic graphene oxides as highly effective adsorbents for rapid removal of a cationic dye rhodamine B from aqueous solutions, RSC Adv., 2013, 3, 7254–7258 RSC
- W. Gao, M. Majumder, L. B. Alemany, T. N. Narayanan, M. A. Ibarra, B. K. Pradhan and P. M. Ajayan, Engineered graphite oxide materials for application in water purification, ACS Appl. Mater. Interfaces, 2011, 3, 1821–1826 CAS
- M. A. Worsley, P. J. Pauzauskie, T. Y. Olson, J. Biener, J. H. Satcher and T. F. Baumann, Synthesis of graphene aerogel with high electrical conductivity, J. Am. Chem. Soc., 2010, 132, 14067–14069 CrossRef CAS PubMed
- Y. Zhao, C. Hu, Y. Hu, H. Cheng, G. Q. Shi and L. T. Qu, A versatile, ultralight, nitrogen-doped graphene framework, Angew. Chem., Int. Ed., 2012, 51, 11371–11375 CrossRef CAS PubMed
- X. Y. Xiao, T. E. Beechem, M. T. Brumbach, T. N. Lambert, D. J. Davis, J. R. Michael, C. M. Washburn, J. Wang, S. M. Brozik, D. R. Wheeler, D. B. Burckel and R. Polsky, Lithographically patterned 3D graphene structures, ACS Nano, 2012, 6, 3573–3579 CrossRef CAS PubMed
- F. Yavari, Z. Chen, A. V. Thomas, W. Ren, H.-M. Cheng and N. Koratkar, High sensitivity gas detection using a macroscopic three-dimensional graphene foam network, Sci. Rep., 2011, 1, 166 Search PubMed
- X. Lu, A. Wei, Q. Fan, L. Wang, P. Chen, X. Dong and W. Huang, Macroporous foam of reduced graphene oxides prepared by lyophilization, Mater. Res. Bull., 2012, 47, 4335–4339 CrossRef CAS
- F. Liu, S. Chung, G. Oh and T. S. Seo, Three-dimensional graphene oxide nanostructure for fast and efficient water-soluble dye removal, ACS Appl. Mater. Interfaces, 2012, 4, 922–927 CAS
- Z.-Y. Sui, Y. Cui, J.-H. Zhu and B.-H. Han, Preparation of three-dimensional graphene oxide–polyethylenimine porous materials as dye and gas adsorbents, ACS Appl. Mater. Interfaces, 2013, 5(18), 9172–9179 CAS
- J. P. Zhao, W. C. Ren and H. M. Cheng, Graphene sponge for efficient and repeatable adsorption and desorption of water contaminations, J. Mater. Chem., 2012, 22, 20197–20202 RSC
- L. F. Melo and T. R. Bott, Biofouling in water systems, Exp. Therm. Fluid Sci., 1997, 14, 375–381 CrossRef CAS
- B. J. Little, J. S. Lee and R. I. Ray, Stainless steel electrochemical corrosion behaviors induced by sulphate-reducing bacteria in different aerated conditions, Electrochim. Acta, 2008, 54, 2–7 CrossRef CAS
- I. K. Konstantinou and T. A. Albanis, Worldwide occurrence and effects of antifouling paint booster biocides in the aquatic environment: a review, Environ. Int., 2004, 30, 235–248 CrossRef CAS PubMed
- S. Kumar, S. Raj, E. Kolanthai, A. K. Sood, S. Sampath and K. Chatterjee, Chemical functionalization of graphene to augment stem cell osteogenesis and inhibit biofilm formation on polymer composites for orthopedic applications, ACS Appl. Mater. Interfaces, 2015, 7, 3237–3252 CAS
- O. Akhavan, E. Ghaderi and A. Esfandiar, Wrapping bacteria by graphene nanosheets for isolation from environment, reactivation by sonication, and inactivation by near-infrared irradiation, J. Phys. Chem. B, 2011, 115, 6279–6288 CrossRef CAS PubMed
- J. Chen, H. Peng, X. Wang, F. Shao, Z. Yuan and H. Han, Graphene oxide exhibits broad-spectrum antimicrobial activity against bacterial phytopathogens and fungal conidia by intertwining and membrane perturbation, Nanoscale, 2014, 6, 1879–1889 RSC
- V. C. Sanchez, A. Jachak, R. H. Hurt and A. B. Kane, Biological interactions of graphene-family nanomaterials: an interdisciplinary review, Chem. Res. Toxicol., 2012, 25, 15–34 CrossRef CAS PubMed
- N. M. Huang, H. N. Lim, C. H. Chia, M. A. Yarmo and M. R. Muhamad, Simple room-temperature preparation of high-yield large-area graphene oxide, Int. J. Nanomed., 2011, 6, 3443–3448 CrossRef CAS PubMed
- S. Liu, T. H. Zeng, M. Hofmann, E. Burcombe, J. Wei, R. Jiang, J. Kong and Y. Chen, Antibacterial activity of graphite, graphite oxide, graphene oxide, and reduced graphene oxide: membrane and oxidative stress, ACS Nano, 2011, 5, 6971–6980 CrossRef CAS PubMed
- S. Gurunathan, J. W. Han, A. A. Dayem, V. Eppakayala and J. H. Kim, Oxidative stress-mediated antibacterial activity of graphene oxide and reduced graphene oxide in Pseudomonas aeruginosa, Int. J. Nanomed., 2012, 7, 5901–5914 CrossRef CAS PubMed
- S. Liu, M. Hu, T. H. Zeng, R. Wu, R. Jiang, J. Wei, L. Wang, J. Kong and Y. Chen, Lateral dimension-dependent antibacterial activity of graphene oxide sheets, Langmuir, 2012, 28, 12364–12372 CrossRef CAS PubMed
- O. Akhavan and E. Ghaderi, Toxicity of graphene and graphene oxide nanowalls against bacteria, ACS Nano, 2010, 4, 5731–5736 CrossRef CAS PubMed
- J. Li, G. Wang, H. Zhu, M. Zhang, X. Zheng, Z. Di, X. Liu and X. Wang, Antibacterial activity of large-area monolayer graphene film manipulated by charge transfer, Sci. Rep., 2014, 4, 4359–4366 Search PubMed
- R. Wang, Y. Wang, C. Xu, J. Sun and L. Gao, Facile one-step hydrazine-assisted solvothermal synthesis of nitrogen-doped reduced graphene oxide: reduction effect and mechanisms, RSC Adv., 2013, 3, 1194–1200 RSC
- G. Wang, J. Yang, J. Park, X. Gou, B. Wang, H. Liu and J. Yao, Facile synthesis and characterization of graphene nanosheets, J. Phys. Chem. C, 2008, 112, 8192–8195 CAS
- G. P. Jeppu and T. P. Clement, A modified Langmuir–Freundlich isotherm model for simulating pH-dependent adsorption effects, J. Contam. Hydrol., 2012, 129, 46–53 CrossRef PubMed
- B. H. Hameed and M. I. El-Khaiary, Equilibrium, kinetics and mechanism of malachite green adsorption on activated carbon prepared from bamboo by K2CO3 activation and subsequent gasification with CO2, J. Hazard. Mater., 2008, 157, 344–351 CrossRef CAS PubMed
- R. Vinu, S. U. Akki and G. Madras, Investigation of dye functional group on the photocatalytic degradation of dyes by nano-TiO2, J. Hazard. Mater., 2010, 176, 765–773 CrossRef CAS PubMed
- G. Jiang, Z. Lin, C. Chen, L. Zhu, Q. Chang, N. Wang, W. Wei and H. Tang, TiO2 nanoparticles assembled on graphene oxide nanosheets with high photocatalytic activity for removal of pollutants, Carbon, 2011, 49, 2693–2701 CrossRef CAS
- B. Das, R. Voggu, C. S. Rout and C. N. R. Rao, Changes in the electronic structure and properties of graphene induced by molecular charge-transfer, Chem. Commun., 2008, 5155–5157 RSC
- F. Wang, J. J. H. Haftka, T. L. Sinnige, J. L. M. Hermens and W. Chen, Adsorption of polar, nonpolar, and substituted aromatics to colloidal graphene oxide nanoparticles, Environ. Pollut., 2014, 186, 226–233 CrossRef CAS PubMed
- J. S. Bunch, S. S. Verbridge, J. S. Alden, A. M. van der Zande, J. M. Parpia, H. G. Craighead and P. L. McEuen, Impermeable atomic membranes from graphene sheets, Nano Lett., 2008, 8, 2458–2462 CrossRef CAS PubMed
Footnote |
| † Electronic supplementary information (ESI) available: (1) Structure of the dyes (Fig. S1), (2) (a) FT-IR spectrum and (b) XRD spectrum of GO foam (Fig. S2), (3) comparison plot of adsorption isotherms of (a) MG and (b) AF on GO foam and GO precipitate (Fig. S3), (4) photographs displaying the complete adsorption of RB dye on GO foam and GO precipitate. Concentration of the dye solution is 5 ppm and the amount of the material used is 6 mg (Fig. S4), (5) point of zero charge plot of GO foam under different pH conditions (Fig. S5), (6) UV-Vis spectra of GO foam before and after interactions with RB, MG and AF dye molecules (Fig. S6), (7) FT-IR spectrum of GO foam adsorbed with AF molecules under alkaline conditions (Fig. S7). See DOI: 10.1039/c5ra19925e |
| This journal is © The Royal Society of Chemistry 2016 |