Kinetic, isotherm and thermodynamic studies of adsorption behaviour of CNT/CuO nanocomposite for the removal of As(III) and As(V) from water

Devendra Kumar Singh, Sweta Mohan, Vijay Kumar and Syed Hadi Hasan*
Department of Chemistry, Indian Institute of Technology (Banaras Hindu University), Varanasi-221005, India. E-mail: shhasan.apc@itbhu.ac.in; dksingh.rs.apc@itbhu.ac.in; Fax: +91-5422368428; Tel: +91-5426702861 Tel: +91-9839089919

Received 5th October 2015 , Accepted 7th December 2015

First published on 9th December 2015


Abstract

A CNT/CuO nanocomposite prepared by precipitation method was characterized through FT-IR, XRD, SEM, TGA, BET and Raman spectroscopy and utilized as a nanoadsorbent for the adsorption of As(III)/As(V) from water where maximum uptake capacities of 2267 μg g−1 for As(III) and 2395 μg g−1 for As(V) were achieved. This CNT/CuO nanocomposite is a better alternative to known conventional adsorbents because it has a high surface area (480 m2 g−1) and maximum uptake capacities were achieved at ambient temperature (30 °C) and near neutral pH (pH 7 for As(III) and 5 for As(V)). Kinetic studies indicated that a pseudo-second-order kinetic model described the kinetic data. The mass transfer and intraparticle diffusion studies suggested that both external mass transfer and intraparticle diffusion steps contributed to the rate controlling step. The Boyd model suggested that intraparticle diffusion was the main rate controlling step. Isotherm studies were conducted and it was found that the equilibrium data followed the Langmuir isotherm which indicated that the adsorption was a monolayer and all the binding sites were energetically equivalent. The D–R isotherm revealed that the adsorption was chemisorption. The thermodynamic studies revealed that the adsorption was spontaneous because ΔG0 was negative and the reaction was endothermic due to the positive value of ΔH0. XPS analysis revealed that CNT/CuO not only adsorbed As(III)/As(V) but also oxidized highly toxic As(III) to less toxic As(V) which is an added advantage of CNT/CuO as an adsorbent.

1. Introduction

The worldwide occurrence of arsenic contamination in ground water as well as surface water has been considered as one of the most serious global problems.1 Arsenic contamination find its path to natural water bodies by mineral leaching and anthropogenic activities.2 Arsenic is a highly toxic element even at very low concentration because it can accumulate in living tissues. More importantly, inorganic arsenic mainly exists in two oxidation states i.e. As(III) and As(V). As(III) has more toxicity than As(V) due to its facile intake by living cells and strong bonding affinity with proteins.3,4 Long-term intake of arsenic [As(III) & As(V)] through food or drinking water causes various consequences to human health such as circulatory and nervous disorders, skin lesions, gangrene, Bowen's disease and cancer of different organs.5–7 Several methods such as electrodialysis, precipitation,8 osmosis,9 ultrafiltration,10 ion-exchange,11 reverse osmosis,12 coagulation13 and adsorption14 have been reported for the removal of arsenic from water. Despite the availability of the above technologies, their ability to remove arsenic is limited. Amongst the available processes, adsorption has been found to be an efficient and economically viable process which allows recovery of the metal.14,15 But due to the lack of suitable adsorbents of high adsorption capacity, the adsorption process could not achieve commercial status.16 The commonly available adsorbents for arsenic removal including activated carbon,17 anaerobic biomass,18 granular ferric hydroxide,19 iron-oxide coated sand20 and biochars derived from rice husk, organic solid wastes and sewage sludge21 suffer from low efficiency in terms of adsorption capacity. Therefore, the development of new adsorbents, processes and services are a present challenge after researchers which if achieved, can deliver a considerable economic and environmental benefit.

Since last two decades, nanotechnology has successfully emerged in almost all the disciplines of science with unique results. An increase in surface area with decrease in size of particles up to nanoscale is one of main aspect of nanotechnology which is an important factor for the adsorption performance of any adsorbent.22,23 Therefore, the development of new adsorbent is not deprived from the nanotechnology. Several nanoadsorbents based on metal oxides have been synthesized and employed as an adsorbent for the removal of arsenic from water.24–28 Earlier, it was reported that both As(III) and As(V) can be removed from water by cupric oxide nanoparticles (CuONPs). Further, it was investigated that CuONPs adsorb arsenic effectively in presence of competing anions such as phosphate, silicate and sulphate.29 However, nanoadsorbents are not easy to use in batch system as well as continuous flow system because after adsorption process its separation becomes a difficult task.30 To overcome these limitations the few attempts have been made by researchers to combine metal nanoparticles with the carbon nanotubes (CNTs).30,31 The CNTs provide adequate surface to support metallic adsorbents.32,33 Even though numerous nanoadsorbents have been developed for the removal of heavy metals from water but a big gap still exists between laboratory experiments and field applications. This is due to the lack of complete kinetic, isotherm and thermodynamic studies in previously reported works. These studies are essential to design the continuous column studies for the treatment of contaminated water. In the present work a detailed kinetic, isotherm and thermodynamic studies were conducted to evaluate the behaviour and adsorption mechanism of As(III) and As(V) on the surface of CNTs/CuONPs (CNT/CuO) nanocomposite. The CuONPs were decorated on the surface of CNTs. Prepared CNT/CuO nanocomposite was characterized using physical and chemical characterization techniques. CNT/CuO nanocomposite was used as a nanoadsorbent for the removal of As(III) and As(V) from water. The effect of various factors such as contact time, initial arsenic concentration, pH, CNT/CuO dose and temperature on the adsorption performance of the CNT/CuO nanocomposites was investigated.

2. Materials method

2.1 Materials

Copper(II) acetate monohydrate [Cu(CO2CH3)2·H2O], arsenic trioxide (As2O3), sodium arsenate heptahydrate (Na2HAsO4·7H2O) and sodium chloride (NaCl) were procured from Sigma Aldrich with a purity higher than 98%. Glacial acetic acid, NaOH and HNO3 were of AR grade and purchased from SD Fine-Chem Ltd. All the solutions were prepared in deionized double distilled water throughout the experiments. 100 mL 0.005 M solution of Cu(CO2CH3)2·H2O was prepared by dissolving 12.48 g of Cu(CO2CH3)2·H2O in 100 mL water. The stock solution containing 1000 mg L−1 of As(III) was prepared by dissolving 1.32 g of As2O3 in 10 mL of 5 N NaOH solutions. It was neutralized by 1 N HNO3 and the volume was made up to 1000 mL with water. The standard stock solution of strength 1000 mg L−1 As(V) was prepared by dissolving 4.164 g Na2HAsO4·7H2O in 1000 mL water. The working solutions were prepared from the stock solution as per the requirement for each experimental run. 0.01 N NaOH and 0.01 N HCl were used for the adjustment of pH.

2.2 Preparation CNT/CuO nanocomposite

CNTs used in current study were synthesized by an arc discharge method. In order to make the composite of CuO with CNTs the decoration of CuO nanoparticles over the surface of CNTs was performed through precipitation method. In a typical process, 0.158 g Cu(CO2CH3)2·H2O was dissolved in 250 mL flask containing 50 mL of water and subsequently 1 mL of glacial acetic acid was added. Then the CNTs suspension was added into the Cu(CO2CH3)2·H2O solution with continuous stirring. After 10 min of stirring 0.8 g of NaOH was added to the reaction mixture. The resulting mixture was then refluxed at 90 °C for 2 h with vigorous stirring. Thereafter, reaction mixture was cooled at room temperature. The product was separated as a black mass from reaction mixture by centrifuging at 8000 rpm for 10 min. The collected black mass which is expected to be CNT/CuO nanocomposite was washed by deionized double distilled water. Finally, dried CNT/CuO nanocomposite was characterized and stored for further use in As(III) and As(V) adsorption experiments.

2.3 Characterization of prepared nanocomposite of CNT/CuO

The microstructure, morphology and elemental analysis of the CNTs and CNT/CuO nanocomposite were observed using Field Emission-Scanning Electron Microscopy (SEM) equipped with Energy-Dispersive X-ray Spectroscopy (EDS) using Quanta 200 F. The structural phase and crystalline size of prepared nanocomposite were obtained by X-ray diffraction (XRD) pattern over the 2θ range of 20–80° using Rigaku Miniflex II X-ray diffractometer with Cu Kα (λ = 1.5406 Å) radiation and Ni filter. The X-ray diffractometer was operated at 30 kV and 30 mA with scan rate of 4° min−1 and step size of 0.02°. Type of bonding present in the prepared CNT/CuO nanocomposite were analyzed by Fourier Transform-Infra Red (FT-IR) spectroscopy which was recorded using Spectrum100, PerkinElmer spectrometer in the range of 4000–400 cm−1 in transmittance mode with KBr pellets. The specific surface area (SSA) of CNTs and CNT/CuO nanocomposite was measured by Brunauer–Emmett–Teller (BET) method. The surface area analyzer Micrometrics, USA, ASAP 2020 Model was used to obtain BET adsorption desorption isotherm. X-Ray Photoelectron Spectroscopy (XPS) was conducted for the speciation of elements on the surface of CNT/CuO after adsorption of arsenic. The XPS spectra were recorded in the AMICUS, Kratos Analytical, A Shimadzu with Mg Kα (1253.6 eV) radiation as X-ray source. Thermo Gravimetric Analysis/Differential Scanning Calorimetry (TGA/DSC) analysis was conducted with STA 6000 PerkinElmer, to examine the stability of CNT/CuO against temperature.

2.4 Determination of pHzpc

The charge on adsorbent surface as a function of pH has been investigated through the pHzpc determination. To determine the pHzpc, 10 mL (0.01 N) NaCl solution was taken into six 100 mL Erlenmeyer flasks. The initial pH (pHi) of the solutions was adjusted between 2 to 12 by adding 0.1 N HCl/NaOH solutions as required. Thereafter, 0.03 g CNT/CuO was added into the each flask and capped immediately. The suspensions thus formed were kept under gentle shaking for 12 h at room temperature. Afterward, the suspensions were filtered to remove the CNT/CuO and filtrate was collected for measurement of final pH (pHf).

2.5 Batch adsorption studies

A series of batch adsorption experiments were conducted in 250 mL Erlenmeyer flasks with 25 mL working solution of desired concentration of As(III)/As(V) to establish the range of process parameters which affect the uptake capacity of CNT/CuO for As(III)/As(V). The calculated amount of CNT/CuO was added in As(III)/As(V) containing flasks and well sealed. Then the flasks were shaken on thermostatic orbital shaker at 100 rpm for the fixed time. After the adsorption the CNT/CuO was separated by centrifugation at 4000 rpm and supernatants were collected for the analysis of residual As(III)/As(V).

The uptake capacity (q) of CNT/CuO for As(III)/As(V) was calculated using following equation.34

 
image file: c5ra20601d-t1.tif(1)
where Ci is the initial metal ion concentration in (μg L−1), Ct is the residual metal ion concentration (μg L−1) in solution after adsorption, V is the volume of working solution (L) and W is the weight of CNT/CuO added in working solution (g).

Initially the individual effect of process parameters were investigated through varying one parameter at a time such as contact time in the range 0–90 min, initial As(III)/As(V) concentration 200–2000 μg L−1, pH 2.0–10.0, CNT/CuO dose 0.1–1 g L−1 and temperature 20–50 °C while keeping other parameters constant. The experiments were carried out in triplicate and average values of experimental data were used for the calculations. Then only significant range of parameters was discussed in the studies.

2.6 Kinetic studies

Adsorption is a time dependent process which is influenced by the physical/chemical characteristics of the adsorbent materials. The adsorption kinetic studies are important to know the mechanism of adsorption and design the treatment system. In order to predict the adsorption kinetics of As(III)/As(V) on the CNT/CuO the two kinetic models were used viz. pseudo-first order and pseudo-second order.
2.6.1 Pseudo-first order. The linear form of the pseudo-first order equation can be given as:35,36
 
image file: c5ra20601d-t2.tif(2)
where ks is the equilibrium rate constant which can be calculated by the slop of log(qeqt) vs. t (min) plot for As(V)/As(III). The qt and qe are the amount of adsorbate adsorbed on the per unit mass of the adsorbent (μg g−1) at time t and equilibrium respectively.
2.6.2 Pseudo-second order. This model is expressed as follows:35,37
 
image file: c5ra20601d-t3.tif(3)
where k2 is equilibrium rate constant
 
h = k2qe2 (4)

Rate constant k2 and h can be calculated by t/qt vs. t plot.

2.6.3 Mass transfer study. The adsorption process is the transfer of pollutant species from solution phase to solid phase. The mass transfer from former to latter involves four consecutive steps as follows:38

(1) The transport of pollutant species from bulk solution to the boundary film.

(2) Diffusion of pollutant species from boundary film to adsorbent surface i.e. external diffusion.

(3) Transfer of the pollutant species from adsorbent surface to active sites present in interparticle space and pores i.e. intraparticle diffusion.

(4) Adsorption and desorption of pollutant species on the active sites of the adsorbent.

Since, the adsorption process is carried out in hydrodynamic condition which avoids the effect of concentration gradient on the transport of pollutant species that's why step 1 cannot be a rate limiting step. The step 4 is considered as a quasi instantaneous mechanism. In general, the rate of adsorption usually depends on the rate of slowest step which would be either intraparticles diffusion or external diffusion. In order to predict the contribution of these two steps in overall rate constant, the Mckay et al. model has been used in its linear form:39

 
image file: c5ra20601d-t4.tif(5)
where Ct (μg L−1) is the arsenic concentration after time t (min), Ci (μg L−1) denotes the initial arsenic concentration, k is the Langmuir constant obtained by multiplying the Q0 and b, and m the mass of adsorbent per unit volume (g L−1). Ss represents the specific surface area of adsorbent present in the per unit volume of reaction mixture (cm−1). βt is the external mass transfer coefficient (cm2 s−1).

2.6.4 Intraparticle diffusion. During the batch mode adsorption process there was a possibility for slow diffusion of pollutant species into the pores or intraparticle space of adsorbent which often becomes a rate controlling step. To predict the role of intraparticle diffusion on the overall rate of current adsorption process, the Weber–Morris model was used. The Weber–Morris model is expressed as follows:40
 
qt = kidt0.5 + C (6)
where kid represents the intraparticle diffusion rate constant (μg g−1 h−0.5) calculated from slope of plot of qt versus t0.5 and C is the intercept.
2.6.5 Boyd kinetic expression. In order to establish the definite rate determining step a complex mathematical equation of Boyd kinetic model was employed for the current adsorption data. The Boyd expression can be written as follows:41
 
image file: c5ra20601d-t5.tif(7)
where G = qe/qt and Bt is the mathematical function of G which can be calculated for the each value of G by following equation.
 
Bt = −0.4977[thin space (1/6-em)]ln(1 − G) (8)

The calculated values of Bt were plotted against time t and resultant slope was used for the calculation of factor B. The effective diffusion coefficient Di (cm2 s−1) has been calculated using the value of factor B from following equation.

 
image file: c5ra20601d-t6.tif(9)
where adsorbent particles were assumed to be spherical and r is the radius of the adsorbent particles. The obtained values of Di will be thus helpful to distinguish the process whether it is intraparticle diffusion or external diffusion.

2.7 Isotherm studies

At equilibrium, different isotherm models are used to find out the distribution of adsorbate between liquid and solid phase. The isotherm parameters describe the surface properties and affinity of the adsorbent at a fixed temperature and pH. Thus, the effective design of adsorption process essentially requires a correct adsorption isotherm.42 The most commonly used Langmuir, Freundlich and Dubinin–Radushkvich (D–R) isotherm model were used for evaluating the adsorption equilibrium data of current adsorption process.
2.7.1 Langmuir isotherm. This isotherm model assumes that adsorption occurs in monolayer on homogeneous adsorbent surface without any interaction between two adsorbed molecules. The linear form of Langmuir isotherm can be written as follows:36,43
 
image file: c5ra20601d-t7.tif(10)
where Q0 and b are the isotherm constant which can be calculated from the intercept and slope of the plot Ce/qe vs. Ce.
2.7.2 Freundlich isotherm. Freundlich isotherm describe that the adsorption occur in heterogeneous surface. Its linear form is represented as follows:43
 
image file: c5ra20601d-t8.tif(11)
where isotherm constants kf and n were calculated from the intercept and slope of the plot log[thin space (1/6-em)]Ce vs. log[thin space (1/6-em)]qe.
2.7.3 D–R isotherm. Radushkevich (1949) and Dubinin (1965) have reported that the nature of adsorption isotherm depends on the porous structure of adsorbent.32 The nature of adsorption was investigated by applying D–R isotherm into the adsorption equilibrium data. It can be written in their linear form as follows:3
 
ln[thin space (1/6-em)]qe = ln[thin space (1/6-em)]XmβF2 (12)
where Xm and β are the constant calculated from the intercept and slope of the plot of ln[thin space (1/6-em)]qe vs. F2. F (Polany potential) can be calculated from the following equation.
 
image file: c5ra20601d-t9.tif(13)
where R is the gas constant and T is the temperature of adsorption equilibrium.

The isotherm constant β is related to the free energy of adsorption of one mole of adsorbate when it comes from infinite to the adsorbent surface and this energy can be calculated using following relationship.

 
image file: c5ra20601d-t10.tif(14)

The classification of the current adsorption system either physical or chemical was put forth on the basis of adsorption free energy (E) value.

2.8 Thermodynamics studies

Thermodynamic parameters such as change in Gibbs free energy (ΔG0), enthalpy (ΔH0) and entropy (ΔS0) of adsorption were evaluated in temperature range 20 to 30 °C from following equations.44
 
image file: c5ra20601d-t11.tif(15)
 
ΔG = −RT[thin space (1/6-em)]ln[thin space (1/6-em)]kc (16)
 
image file: c5ra20601d-t12.tif(17)
where CAe is the equilibrium concentration of solute on the adsorbent (μg L−1), Ce is the equilibrium concentration of solute in bulk solution (μg L−1), T denotes the absolute temperature (k) and R represents universal gas constant (8.314 J mol−1). The values of (ΔH0) and (ΔS0) were calculated from slope and intercept of the plot ln[thin space (1/6-em)]kc vs. 1000/T.

2.9 Analysis of arsenic in aqueous solution

The residual As(III)/As(V) concentration in the sample was examined by Atomic Absorption Spectrophotometer (AAS, Shimadzu AA-6300). The continuous flow hydride vapour generator (HVG, Shimadzu HVG-1) was connected to the AAS for the conversion of As(III)/As(V) into its hydrides. The hollow cathode lamp was used as light source, set at 12 mA lamp-current and 0.7 nm slit width with 193.47 nm wavelength having deuterium lamp for background correction. Acetylene (98%) was used as a fuel for the generation of flame with the flow rate of 4.0 L min−1 at pressure 0.9 kg cm−2, together with flow rate of 17.5 L min−1 and pressure 3.5 kg cm−2 of highly compressed air. For the purging purpose pure argon gas (99.99%) was used at a flow rate of 70.0 mL min−1 and at 3.2 ± 0.2 kg cm−2 pressure.

3. Result and discussion

3.1 Characterization of CNT/CuO nanocomposite

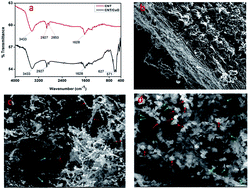
The initial composition of nanocomposite was confirmed by FT-IR analysis. Fig. 1a shows the FT-IR spectra of CNT and CNT/CuO which possess broad peak centred at 3433 cm−1 which corresponded to vibration of hydroxyl groups of adsorbed water on the sample surface. The spectra have characteristic peaks of CNT at 2927 cm−1, 2853 cm−1 and 1628 cm−1. The two peaks at 2927 cm−1 and 2853 cm−1 attributed to the stretching vibration of C–H bond of sp2 and sp3 hybridized carbon of CNT respectively. The peak at 2853 cm−1 was less intense as compared to peak at 2927 cm−1 because the most of the carbon of CNT possesses sp2 hybridization whereas sp3 hybridized carbon are present only on the edge and defective sites. The peak at 1628 cm−1 attributed to the C[double bond, length as m-dash]C stretching vibration which is alternatively present in the CNT walls as building unit. The spectrum of CNT/CuO has two extra stretching vibration peaks of Cu–O bonds at 571 cm−1 and 627 cm−1 which revealed the presence of cupric oxide (CuO) which was expected to be present in synthesized CNT/CuO nanocomposite.
image file: c5ra20601d-f1.tif
Fig. 1 (a) FT-IR spectra of CNT and CNT/CuO (b) SEM image of CNT (c) SEM image of CNT/CuO (d) high magnification of SEM image of CNT/CuO.

Fig. 1b shows the SEM image of as prepared CNTs which was used for the synthesis of CNT/CuO nanocomposite. The SEM image of CNT/CuO nanocomposite prepared by simple solution phase precipitation method is presented in Fig. 1c in which the dark red arrows indicate the flower shape CuO decorated on the surface of CNTs whereas light blue arrows indicate the CuO free part of CNTs which is connecting two part of material to maintain a network like porous structure. High resolution SEM micrograph reveals the flower's petals like CuO nanosheets pointed by green arrows are threatened over the CNTs (Fig. 1d). The bunch of these CuO nanosheets developed the flower shaped structures indicated by the red arrows. The EDS spectra of CNTs and CNT/CuO are presented in the Fig. S1 and S2 respectively which revealed that the CNTs contain only carbon and oxygen whereas the CNT/CuO contain copper, carbon and oxygen.

The crystal structure and phase of CNTs and CNT/CuO nanocomposite were investigated through XRD measurements which are shown in Fig. 2a. The XRD pattern of CNTs as well as CNT/CuO showed characteristic diffraction peak at 2θ = 26.06° which were due to the diffraction from 002 plane of CNTs.45 The other peaks at 2θ = 32.50°, 35.51°, 38.58° and 61.55° well matched with the JCPDS file no. 892529 of monoclinic phase of CuO. Thus, the XRD pattern clearly indicates that the CNT/CuO nanocomposite was consisted of two different solid phase materials viz. CNTs as well as monoclinic CuO and both have dimension in nanoscale. The nitrogen adsorption desorption isotherms obtained at 77 K for CNTs and CNT/CuO are presented in the Fig. 2b. The SSA was found to be 612 for CNT and 480 for CNT/CuO. SSA of CNTs decreased after the decoration of CuO on the surface which might be due to the blockage of CNTs pores at end points or defect points.


image file: c5ra20601d-f2.tif
Fig. 2 (a) XRD pattern of CNT/CuO (b) N2 adsorption desorption isotherm of CNT and CNT/CuO (c) pHzpc of CNT/CuO (d) TGA and DSC curve of CNT/CuO.

The Raman spectra of CNTs and CNT/CuO are presented in the Fig. S3 which has characteristic peaks at 1347, 1578 and 2690 cm−1 correspond to D, G and 2D bands of CNTs. The G band attributed to the E2g symmetric vibrational mode of graphitic structure whereas D and 2D bands were due to the structural disorder in the CNTs.46,47 The ratio of intensity of D band (ID) and intensity of G band (IG) can be used to evaluate the structural change in the CNTs after the formation of CNT/CuO.48 As the ID/IG was fond to be 0.37 for CNTs and 0.78 for CNT/CuO therefore, the structural disorder in the CNTs increased on the formation of CNT/CuO.

3.2 Determination of pHzpc

The pHzpc is the significant electrical charge characteristic for an adsorbent surface. Fig. 2c shows the graph between pHi and pHf having cross point at pH 6.8 which was taken as pHzpc.49 Since a value of 6.8 is very close to the neutral pH of the water therefore, the adsorption of anion on positive surface is favoured by slightly acidic medium and adsorption of cations is favoured by slightly basic medium. Hence, the pHzpc close to the neutral pH make it an excellent adsorbent in the case of heavy metals adsorption in an aqueous medium.

3.3 Stability of CNT/CuO

3.3.1 Thermal stability. The thermal stability of CNT/CuO was investigated through TGA/DSC. Fig. 2d displays the TGA and DSC curves. The heat flow curve indicated that the all thermal events were endothermic in nature. The weight percentage curve has two main weight loss regions. First 5% weight loss between 150 °C to 500 °C attributed to the dehydration of surface adsorbed water and elimination of hydroxyl group present on the CNT. The second rapid weight-loss which started after 500 °C was due to the degradation of CNT. Thus, the CNT/CuO nanocomposite was found to be stable upto 500 °C. As a consequence, this composite can be effectively used for the adsorption purpose because a majority of adsorption experiments are mostly carried out below 50 °C.
3.3.2 pH stability. Prior to use of materials as an adsorbent, the stability of material with pH change must be investigated since the adsorption process depends on the pH of medium. For this reason the suspensions of 0.03 g CNT/CuO were prepared in 10 mL distilled water and pH was adjusted from 1.5 to 12 by the addition of 0.1 N HCl/NaOH. The suspensions were stirred for 3 h. Thereafter the suspensions were centrifuged at 5000 rpm for 10 min. The supernatant thus obtained was analyzed for the presence of Cu2+ through Thermo Orion expandable ionanalyzed EA 940. It was found that the supernatants of suspension of pH ≤ 2 have remarkable concentration of Cu2+ (Fig. S4). The presence of Cu2+ in the supernatant may be due to the dissolution of CuO of CNT/CuO. Therefore, CNT/CuO cannot be used as adsorbent at a pH ≤ 2. Since, the literature survey reveals that the adsorption of As(III)/As(V) occurs near the pHzpc or slightly below pHzpc which is 6.8 for the CNT/CuO therefore, it can be used as adsorbent for the removal of As(III)/As(V).50

3.4 Effect of pH on uptake capacity of CNT/CuO

The effect of pH on the uptake capacity of CNT/CuO for the adsorption of As(III) and As(V) was investigated by varying pH from 3 to 10 at initial As(III)/As(V) concentration 1000 μg L−1, CNT/CuO dose 0.5 g L−1 and temperature 30 °C. The result (Fig. 3a) showed that the uptake capacity for As(III) did not increase significantly on increasing pH from 3 to 5 initially. Thereafter it increased abruptly on further increase in pH and attained maximum of 1866 μg g−1 at pH 7 followed by decrease on further increase in pH above 7. This pattern of uptake capacity can be explained on the basis of aqueous chemistry of As(III) and pHzpc of the CNT/CuO as well. It has been reported that the As(III) exists in non-ionic form H3AsO3 in pH range from 2 to 9 whereas anionic form H2AsO3 dominate at pH > 9.3 The pHzpc of CNT/CuO was found near 7 (6.8) which indicated that the CNT/CuO surface acquires positive charge when pH is below the pHzpc whereas it acquires negative charge when the pH is above the pHzpc. Thus, it could be concluded that when the pH was in the range of 3 to 5 i.e. below pHzpc, the surface of CNT/CuO was highly protonated and it was unfavourable for adsorption of non-ionic species i.e. H3AsO3. Whereas on increasing the pH from 5 to 7 the degree of protonation of CNT/CuO was decreased which resulted into a neutral surface near the pHzpc. The neutral surface thus obtained was favourable for the adsorption of non-ionic species i.e. H3AsO3. Hence, the maximum uptake capacity was achieved at pH 7 due to the adsorption of non-ionic species i.e. H3AsO3. Thereafter, in basic medium (pH 7 to 10) the CNT/CuO acquired negative charge either by adsorbing OH ions from solution or by releasing the H+ ions from hydroxyl groups of CuO. Simultaneously anionic species H2AsO3 also dominated with increase in pH as per the aqueous chemistry of As(III). As a result a repulsive force developed between negatively charged surface of CNT/CuO and H2AsO3 which was responsible for decreased uptake capacity at higher pH.
image file: c5ra20601d-f3.tif
Fig. 3 (a) Effect of pH on uptake capacity of CNT/CuO (b) effect of contact time and CNT/CuO dose on the uptake capacity of CNT/CuO (c) pseudo-first-order kinetic plot at different CNT/CuO dose (d) pseudo-second-order kinetic plot at different CNT/CuO dose.

Similarly, in the case of As(V) adsorption (Fig. 3a) the uptake capacity of CNT/CuO was increased gradually in the initial stages of pH i.e. 3 to 5 and maximum uptake capacity 1934 μg g−1 was achieved at pH 5. Thereafter, the uptake capacity started to decrease on further increase in pH from 5 to 10. It can also be explained on the basis of aqueous chemistry of As(V) and pHzpc of the CNT/CuO. In aqueous solution As(V) exists in anionic form H2AsO4 in the pH range from 2.2 to 6.9 and another anionic form i.e. HAsO42− dominates from pH 6.9 upto 11.51 Actually, in pH range from 3 to 5 which was below pHzpc of the CNT/CuO the surface of CNT/CuO was positively charged due to the protonation which was electrostatically favourable for the adsorption of anionic species i.e. H2AsO4 of As(V). Further increase in pH from 5 to 10 resulted into the deprotonation of CNT/CuO and surface became neutral near the pHzpc (6.8) which was not favourable for the adsorption of anionic species i.e. H2AsO4. When the solution pH increased above 6.8 the neutral surface of CNT/CuO get negatively charged and adsorption capacity decreased again due to the development of repulsive force between CNT/CuO and existing anionic species of As(V) i.e. HAsO42−.3 In addition to this another factor was also responsible for decreasing uptake capacity that was the abundance of OH ion at higher pH which competes with anionic species of arsenic for the binding sites.52

3.5 Effect of contact time and CNT/CuO dose on uptake capacity of CNT/CuO

The effect of contact time was investigated for the adsorption of As(III)/As(V) with varying CNT/CuO dose from 0.3 g L−1 to 0.5 g L−1 at initial As(III)/As(V) concentration 1000 μg L−1, temperature 30 °C and pH 7 for As(III) and pH 5 for As(V). Fig. 3b represents the effect of contact time and CNT/CuO dose on adsorption process which clearly indicated that at the initial phase the adsorption was rapid as all binding sites of adsorbent were free and the concentration gradient of As(III)/As(V) was also very high. The adsorption was progressively decreased with the lapse of time due to the fact that as adsorption proceeds with time the free binding sites and concentration gradient of As(III)/As(V) were decreased.53 It was also found that the equilibrium time was independent from the CNT/CuO dose for both As(III) and As(V). However the equilibrium time for As(III) and As(V) were 60 min and 40 min respectively. The maximum uptake capacity of CNT/CuO for As(III) and As(V) was achieved at CNT/CuO dose of 0.4 g L−1. It is also clear from the Fig. 3b that the uptake capacity for As(III) and As(V) did not change significantly with the increase of CNT/CuO dose from 0.3–0.4 g L−1. However, on further increase in CNT/CuO dose from 0.4–0.5 g L−1 created significant decrease in the uptake capacity from 2267–1866 μg g−1 for As(III) and from 2395–1932 μg g−1 for As(V). It was due to fact that the metal-to-binding sites ratio governs the uptake capacity of adsorbent. Thus, the metal-to-binding sites ratio decreased on increase in CNT/CuO dose. Therefore, the available metal ion became insufficient at higher CNT/CuO dose to cover up the complete binding sites in per unit weight.54

A comparison of CNT/CuO nanocomposite with previously reported different adsorbents for the removal of As(III)/As(V) is presented in the Table 1.

Table 1 Comparison of CNT/CuO nanocomposite with previously reported adsorbents for the removal of As(III) and As(V) in term of uptake capacity
S. no. Adsorbent Uptake capacity (μg g−1) Ion removed Method References
1 Al-HDTMA-sericite 430 As(III) Adsorption 55
852 As(V)
2 Al-AMBA-sericite 338 As(III) Adsorption 55
541 As(V)
3 Mn0.5Cu0.5Fe1.2Al0.8O4 doped polymer nanocomposite 53 As(III) Adsorption 56
4 Fe-MWCNT nanocomposite 1723 As(III) Adsorption 57
189 As(V)
5 CuO incorporated mesoporous alumina 2160 As(III) Adsorption 58
2020 As(V)
6 CNT/CuO nanaocomposite 2267 As(III) Adsorption Present work
2395 As(V)


3.6 Kinetic studies

Various kinetic models have been applied to explain the kinetics and rate controlling step for the adsorption of As(III)/As(V) on the CNT/CuO with obtained experimental data. The kinetic measurements were conducted for varying CNT/CuO doses i.e. 0.3, 0.4 and 0.5 g L−1 at initial As(III)/As(V) concentration 1000 μg L−1, temperature 30 °C and pH 7 for As(III) and pH 5 for As(V). The analyses of applied kinetic models were as follows:
3.6.1 Pseudo-first-order and pseudo-second order kinetic models. The pseudo-first-order kinetic model was analyzed through straight line plot of log(qeqt) vs. t (Fig. 3c). The calculated values of model parameters and correlation coefficient (R2) have been summarized in Table 2. The model parameters and R2 for the straight line fit of pseudo-second-order were calculated from the plot of t/qt vs. t (Fig. 3d) and given in Table 2. The reasonable linearity of plot, high value of R2 and good agreement between calculated and experimental uptake capacity for pseudo-second-order model suggested that the pseudo second-order model was able to elicit better approximation for the kinetics of adsorption of As(III)/As(V) on the CNT/CuO as compare to pseudo-first-order model. Thus the adsorption rate would be proportional to the square of number of free binding sites over the CNT/CuO and metal ion concentration which corresponds to the (qeqt)2 term of the pseudo-second-order model. Moreover, it was found from the Table 2 that the values of rate constants for pseudo-second-order seem to increase with the increase in CNT/CuO dose. This is because of increase in the binding sites on the increase of CNT/CuO dose which lead to the easy availability of binding sites.
Table 2 Kinetic parameters for the adsorption of As(III) and As(V) at different CNT/CuO dose
Model parameters As(III)-0.3 g L−1 As(III)-0.4 g L−1 As(III)-0.5 g L−1 As(V)-0.3 g L−1 As(V)-0.4 g L−1 As(V)-0.5 g L−1
Pseudo-first-order
K1 (min−1) 0.075 0.063 0.071 0.114 0.100 0.112
qe (exp.) (μg g−1) 2170 2267 1866 3296 2395 1932
qe (cal.) (μg g−1) 2884 2564 1250 3250 2951 2360
R2 0.877 0.947 0.938 0.898 0.900 0.921
[thin space (1/6-em)]
Pseudo-second-order
k2 0.064 0.066 0.103 0.115 0.12 0.164
qe (μg g−1) 2624 2324 2105 2717 2688 2100
R2 0.991 0.993 0.997 0.994 0.990 0.993
[thin space (1/6-em)]
Mass transfer
βt × 10−4 (cm2 s−1) 6.01 10.3 9.46 11.34 22.08 18.7
R2 0.943 0.994 0.962 0.946 0.980 0.990
[thin space (1/6-em)]
Interparticles diffusion
kid (μg g−1 min−0.5) 290.49 300.48 242.11 403.16 396.74 320.93
C 50.46 68.57 154.73 −29.85 −10.74 40.87
R2 0.991 0.989 0.956 0.975 0.987 0.980
[thin space (1/6-em)]
Boyd kinetic
B (s−1) 0.0006 0.0005 0.0005 0.0009 0.0008 0.0008
Di × 10−12 (cm2 s−1) 2.07 1.5 1.6 3.13 2.64 2.78
R2 0.982 0.984 0.992 0.991 0.995 0.990


3.6.2 Mass transfer studies. The Fig. 4a shows the Mckay et al. model plot for the mass transfer of As(III)/As(V). The plot represented good linear fit with the experimental data which suggested that the external mass transfer step was present during the adsorption process. The mass transfer coefficients (βt) for the diffusion of As(III)/As(V) from liquid film boundary to CNT/CuO surface have been calculated for different adsorbent dose from the Fig. 4a and given in Table 2. These high values of βt [6.01 × 10⁻⁴, 10.3 × 10⁻⁴, 9.46 × 10⁻⁴ cm2 s−1 for As(III) and 11.34 × 10⁻⁴, 22.08 × 10⁻⁴, 18.7 × 10⁻⁴ cm2 s−1 for As(V)] suggested that the external mass transfer was very rapid, thereby ruling it out to be rate controlling step. Moreover, the values of βt for the CNT/CuO were found to be greater than previously reported adsorbents.3,59 Thus enough rapid external mass transfer makes CNT/CuO an excellent adsorbent for the treatment of arsenic contaminated water.
image file: c5ra20601d-f4.tif
Fig. 4 (a) Mass transfer plot at different CNT/CuO dose (b) intraparticle diffusion plot at different CNT/CuO dose (c) Boyd kinetic plot at different CNT/CuO dose.
3.6.3 Intraparticles diffusion model. Fig. 4b represents the plot of Waber–Morris model for the intraparticle diffusion possibilities during the adsorption of As(III) and As(V) on the CNT/CuO. The plot showed significant linearity with high value of R2 at all CNT/CuO doses. The plot of qt vs. t0.5 possessed straight lines but did not pass through the origin which indicated that the intraparticle diffusion was not the sole rate controlling step. The values of kid were calculated from the plot (Fig. 4b) and given in the Table 2 for different CNT/CuO dose i.e. 0.3, 0.4 and 0.5 g L−1. The intercept of the plot revealed the effect of external mass transfer in the rate determining step. These results indicated that the adsorption of As(III)/As(V) on CNT/CuO followed a complex mechanism and both intraparticle diffusion and external mass transfer participated to the rate determining step.
3.6.4 Boyd kinetic model. As the Waber–Morris model suggested that the mechanism of adsorption of As(III)/As(V) on the CNT/CuO proceeded through a complex mechanism pathway but the rate limiting step remain uncertain. To address the actual rate controlling step the Bt value was calculated for different CNT/CuO doses using Boyd kinetic expression and plotted against t (min) as shown in Fig. 4c. The Boyd kinetic plot (Fig. 4c) shows linearity between Bt and t at all CNT/CuO doses. The factor B was calculated from the slope and used to calculate the effective Di and both are listed in Table 2. The rate determining step dominated by external mass transfer yielded the value of Di in the range of 10−6 to 10−8 cm2 s−1 whereas the value of Di falls in the range of 10−11 to 10−13 cm2 s−1 when dominated by intraparticle diffusion.60 From the Table 2 it has been observed that the values of Di for the adsorption of As(III)/As(V) on the CNT/CuO is 10−12 cm2 s−1 which clearly proposed the intraparticle diffusion step as a rate controlling step.

3.7 Isotherm studies

The isotherm studies were conducted at temperature 20, 30 and 40 °C by varying initial arsenic concentration from 200 to 1000 μg L−1. The experimental data was utilized for the fitting into commonly used Freundlich, Langmuir, and D–R model to find the suitable model for the better approximation of adsorption mechanism that can be used for design the field applications.
3.7.1 Freundlich and Langmuir isotherm. The linear plot of Freundlich isotherm at different temperature for adsorption of As(III)/As(V) on the CNT/CuO is presented in the Fig. 5a. The Freundlich parameters n and kf were calculated from the slope and intercept respectively. In the same way Langmuir parameters b and qm were calculated from intercept and slope of linear plot of it (Fig. 5b). The isotherm parameters and R2 of Freundlich linear plot as well as Langmuir linear plot are listed in Table 3. Based on the observation of Table 3, Langmuir isotherm appears to be a reasonable model for the approximation of adsorption data with the high values of R2 (0.999, 0.997, 0.998, 0.997, 0.996, 0.998) as compare to R2 (0.893, 0.874, 0.885, 0.884, 0.886, 0.910) of Freundlich isotherm. Thus the adsorption was monolayer and all binding sites were energetically equivalent. It is clear from Table 2 that the value of Q0 increased with increase in temperature from 20 °C to 30 °C which indicated that the adsorption of arsenic was favoured by rise in temperature. Further increase in temperature from 30 °C to 40 °C did not support the adsorption significantly because of augment in randomness of As(III)/As(V) species in the solid–liquid interface. Moreover the same trend of change in b with the temperature suggested that the bonding energy of As(III)/As(V) with CNT/CuO increased with increase in temperature therefore, it was endothermic process. The Freundlich constant n ranged between 1 to 10 for all temperatures which suggested that the adsorption of As(III)/As(V) onto CNT/CuO would be beneficial process.34 The increase in kf with increase in temperature from 20 °C to 30 °C also suggested that the adsorption was favoured by increase in temperature but further increase in temperature from 30 °C to 40 °C became unfavourable for the adsorption. Therefore, 30 °C was considered as optimum temperature for the adsorption of As(III)/As(V) onto the CNT/CuO surface.
image file: c5ra20601d-f5.tif
Fig. 5 (a) Freundlich isotherm plot at different temperature (b) Langmuir isotherm plot at different temperature (c) D–R isotherm plot at different temperature (d) Van't Hoff plot for the adsorption of As(III)/As(V) on the CNT/CuO.
Table 3 Parameters of Langmuir, Freundlich and D–R isotherm for the adsorption of As(III) and As(V) at different temperature
Temperature Freundlich parameters Langmuir parameters D–R parameters
kf (μg g−1) n R2 Q0 (μg g−1) b (L μg−1) R2 Xm (μmol g−1) E (kJ mol−1) R2
As(III)
20 °C 270.39 2.56 0.893 1291 0.073 0.999 0.0003 15.62 0.988
30 °C 467.73 2.69 0.874 2421 0.116 0.997 0.0002 15.89 0.986
40 °C 203.70 2.32 0.885 2163 0.029 0.998 0.0003 13.92 0.991
[thin space (1/6-em)]
As(V)
20 °C 281.83 2.28 0.884 2439 0.048 0.997 0.0003 14.49 0.995
30 °C 363.07 1.98 0.886 2832 0.087 0.9962 0.0011 13.29 0.989
40 °C 173.38 1.99 0.910 2498 0.025 0.9984 0.0005 13.38 0.984


The efficiency of process for the adsorption of As(III)/As(V) onto the CNT/CuO was investigated by the application of dimensionless separation factor (RL) which can be expressed as follows.38,39

 
image file: c5ra20601d-t13.tif(18)
where b is the Langmuir constant and C0 represents the initial arsenic concentration.

The value of RL can predict the process of adsorption is whether irreversible (RL = 1), favourable (0 < RL > 1) or unfavourable (RL > 1). The RL was calculated using b at 30 °C and C0 = 1000 μg L−1. The calculated values of RL were found to be 0.9998 for As(III) and 0.9999 for As(V) reaffirming the highly favourable adsorption of both As(III) and As(V) onto the CNT/CuO. It also confirmed the applicability of Langmuir isotherm.39

3.7.2 D–R isotherm. The D–R isotherm plot for the adsorption of As(III)/As(V) on the CNT/CuO as shown in Fig. 5c has significant linearity with the experimental data. The R2 value and free energy of adsorption E (kJ mol−1) calculated from the slope β (mol2 kJ−2) are presented in the Table 3. The high value of R2 at all selected temperatures advocated the applicability of D–R isotherm. Thus the value of E calculated from the D–R model can distinguish the adsorption whether it is physical or chemical in nature. The adsorption is said to be chemical adsorption if the value of E lies between 8 to 16 kJ mol−1. Whereas an E value less than 8 kJ mol−1 suggests the physical adsorption.60,61 It is clear from the Table 3 that the all values of E present in the range of chemical adsorption. Therefore, the adsorption of As(III)/As(V) on the CNT/CuO preceded through chemical adsorption at all selected temperatures.

3.8 Thermodynamics studies

The Vant Hoff plot for the adsorption of As(III)/As(V) is shown in the Fig. 5d. The values of ΔH0 and ΔS0 were calculated from slope and intercept respectively from Fig. 5d and listed in Table 4. The ΔS0 value for As(III)/As(V) was positive. This was due to the fact that most of the adsorbate i.e. As(III)/As(V) is present between adsorbent and adsorbent liquid interface. During adsorption some extent of desorption also occurs. The adsorption and subsequent desorption of As(III)/As(V) on the CNT/CuO surface increased the randomness in the adsorbent liquid interface.62 The positive value of ΔH0 suggested that the adsorption of As(III)/As(V) on the CNT/CuO was endothermic process thus the adsorption can be enhance by raising the temperature. The calculated values of ΔG0 are also listed in Table 4. The negative values of ΔG0 were suggested that the adsorption of As(III)/As(V) on CNT/CuO was spontaneous process. Moreover the degree of spontaneity increased with the increase in temperature.
Table 4 Thermodynamic parameters for the adsorption of As(III) and As(V) on the CNT/CuO
Temperature (°C) ΔG (kJ mol−1) ΔH (kJ mol−1) ΔS (kJ mol−1 K−1)
As(III)
20 −4.36 ± 0.091    
25 −5.88 ± 0.111 104.08 0.37
30 −8.060 ± 0.185    
[thin space (1/6-em)]
As(V)
20 −2.89 ± 0.080    
25 −4.01 ± 0.142 74.119 0.26
30 −5.52 ± 0.138    


3.9 XPS analysis after the adsorption of As(III)/As(V)

The XPS spectra of As(III) adsorbed CNT/CuO [CNT/CuO–As(III)] and As(V) adsorbed CNT/CuO [CNT/CuO–As(V)] were recorded. In both the samples C, O, Cu and As appeared at the surface (Fig. 6a). The detailed spectra of As 3d (Fig. 6b) peak of CNT/CuO–As(V) showed a single peak at 46.1 eV. Thus only As(V) was present on the surface. The spectrum of Cu 2p (Fig. 6c) of CNT/CuO–As(V) showed the peaks at 936.71 and 956.56 eV due to the Cu 2p3/2 and Cu 2p1/2 respectively. These peaks confirmed the presence of single phase CuO which was one of the major constituent of the CNT/CuO. Therefore, no oxidation–reduction reaction occurred during the adsorption of As(V). Here oxidation and reduction were not expected because As and Cu both were present in their higher oxidation state. The As 3d spectrum of CNT/CuO–As(III) is shown in Fig. 6d which exhibited peaks at 45.2 and 46.1 eV advocated the presence of As(III) and As(V). The presence of As(III) was expected as adsorbate was As(III) while As(V) possibly came from the oxidation of As(III) on the surface of CNT/CuO. This explanation gains the evidence from the Cu 2p spectrum (Fig. 6e) of the CNT/CuO–As(III) sample. This spectrum showed the peaks at 935.42 and 955.38 eV for Cu2O 2p3/2 and 2p1/2 and peaks at 936.71 and 956.56 eV for CuO 2p3/2 and 2p1/2. During the adsorption of As(III) on the CNT/CuO the redox reaction occurred between As(III) and Cu2O. The redox reaction can be represent as follows:
2CuO + As(III) → Cu2O + As(V)

image file: c5ra20601d-f6.tif
Fig. 6 XPs spectra (a) wide scan of CNT/CuO–As(III) and CNT/CuO–As(V) (b) As 3d of CNT/CuO–As(V) (c) Cu 2p of CNT/CuO–As(V) (d) As 3d of CNT/CuO–As(III) (e) Cu 2p of CNT/CuO–As(III).

In the Fig. 6e, the peak at 935.42 eV for Cu2O 2p3/2 showed much higher intensity than peak at 936.71 eV of CuO 2p3/2 which suggested that most of the surface CuO reduced into Cu2O and oxidised the more toxic As(III) into low toxic As(V). The Fig. 6d possessed the less intense peak at 45.2 eV for As(III) which revealed that the total adsorbed As(III) was not oxidised into the As(V). Therefore, the adsorption capacity of CNT/CuO was higher than that of capability to oxidise the As(III).

4. Conclusions

A novel CNT/CuO nanocomposite was prepared through simple precipitation method using Cu(CO2CH3)2·H2O and CNTs as starting materials. The prepared CNT/CuO nanocomposite has high surface area (480 m2 g−1), remarkable thermal stability (500 °C) and desirable solution stability for broad pH change (pH 2–12) which makes them promising adsorbent for removal of As(III)/As(V). The maximum uptake capacity of CNT/CuO was 2267 μg g−1 for As(III) at pH 7 and 2395 μg g−1 for As(V) at pH 5. It is interesting to mention that the pH of drinking water normally exist between 6 to 7 therefore; the CNT/CuO can be used as adsorbent for the removal of As(III)/As(V) from drinking water without imparting large scale change in pH of medium. The rate of adsorption was very fast in comparison to other conventional adsorbents and equilibrium time was 40 min for As(V) and 60 min for As(III). The kinetics of adsorption of As(III)/As(V) on the CNT/CuO also supported the above fact because adsorption followed the pseudo-second-order kinetic model. The mass transfer and intraparticle diffusion studies suggested that both intraparticle diffusion and external mass transfer participated in the rate determining step. The Boyd kinetic model suggested that the rate of adsorption mainly depended on the intraparticle diffusion step. The high value of mass transfer coefficient reported that the removal of As(III)/As(V) by CNT/CuO would have been mainly by adsorption process. This is further confirmed by isotherm studies using different isotherm models. The Langmuir isotherm model followed well with high values of R2 which indicated that the removal was through adsorption and it was monolayer. The D–R isotherm model suggested that the adsorption was chemisorptive. The thermodynamic studies indicated that the adsorption was spontaneous and endothermic process. The isotherms and thermodynamic studies revealed that the optimum temperature for the adsorption of As(III)/As(V) was 30 °C which is close to the room temperature. Thus, the process is energy saving and inexpensive. The CNT/CuO not only adsorbed but also converted highly toxic As(III) into less toxic As(V), followed by simultaneous adsorption. These kinetics, isotherms, and thermodynamics data generated from the batch mode experiments and their results will be useful to design the continuous column studies using CNT/CuO as adsorbent for the treatment of arsenic contaminated water. The present approach thus may be applicable for the development of future adsorbents with enhanced adsorption properties.

Acknowledgements

Authors DKS, SM and VK would like to acknowledge the MHRD, New Delhi, India to provide the financial assistance. We are also thankful to Prof. Ranjan Kumar Singh, Department of Physics, Faculty of Science, BHU for providing Raman spectroscopy facility. The authors are also thankful to the Director, Indian Institute of Technology (BHU), Varanasi, India for providing infrastructures and instrumentation facilities.

References

  1. A. Gupta, M. Yunus and N. Sankararamakrishnan, Chemosphere, 2012, 86, 150 CrossRef CAS PubMed.
  2. Z. O. K. Ataklı and Y. Yurum, Chem. Eng. J., 2013, 225, 625 CrossRef.
  3. D. Ranjan, M. Talat and S. H. Hasan, J. Hazard. Mater., 1050, 2009, 166 Search PubMed.
  4. S. Mandal, M. K. Sahu and R. K. Patel, Water Resources and Industry, 2013, 4, 51 CrossRef.
  5. J. P. Wang, L. Qi, M. R. Moore and J. C. Ng, Toxicol. Lett., 2002, 133(1), 17 CrossRef CAS PubMed.
  6. T. Yoshida, H. Yamauchi and G. F. Sun, Toxicol. Appl. Pharmacol., 2004, 198, 243 CrossRef CAS PubMed.
  7. G. S. Murugesan, M. Sathishirkumar and K. Suaminathan, Bioresour. Technol., 2006, 97, 483 CrossRef CAS PubMed.
  8. M. Edwards, J. - Am. Water Works Assoc., 1994, 86, 64 CAS.
  9. L. Cumbal and A. K. SenGupta, Environ. Sci. Technol., 2005, 39, 6508 CrossRef CAS PubMed.
  10. P. Brandhuber and G. Amy, Desalination, 2001, 140, 11 CrossRef.
  11. M. J. Kim, Bull. Environ. Contam. Toxicol., 2001, 67, 46 CrossRef CAS PubMed.
  12. M. Kang, M. Kawasaki, S. Tamada, T. Kamei and Y. Magara, Desalination, 2000, 131, 293 CrossRef CAS.
  13. J. G. Hering, P. Y. Chen, J. A. Wilkie and M. Elimelech, J. - Am. Water Works Assoc., 1996, 88, 155 CAS.
  14. S. H. Hasan, D. Ranjan and M. Talat, Ind. Eng. Chem. Res., 2009, 48, 4194 CrossRef CAS.
  15. G. Zhang, H. Liu, R. Liu and J. Qu, J. Hazard. Mater., 2009, 168, 820 CrossRef CAS PubMed.
  16. I. Ali, Chem. Rev., 2012, 112, 5073 CrossRef CAS PubMed.
  17. X. J. Gong, W. G. Li, D. Y. Zhang, W. B. Fan and X. R. Zhang, Int. Biodeterior. Biodegrad., 2015, 102, 256 CrossRef CAS.
  18. M. R. I. Chowdhury and C. N. Mulligan, J. Hazard. Mater., 2011, 190, 486 CrossRef CAS PubMed.
  19. M. Badruzzaman, P. Westerhoff and D. R. U. Knappe, Water Res., 2004, 38, 4002 CrossRef CAS PubMed.
  20. O. S. Thirunavukkarasu, T. Viraghavan and K. S. Suramanian, Water, Air, Soil Pollut., 2003, 142, 95 CrossRef CAS.
  21. E. Agrafioti, D. Kalderis and E. Diamadopoulos, J. Environ. Manage., 2014, 133, 309 CrossRef CAS PubMed.
  22. D. S. Shirsath and V. S. Shirivastava, Appl. Nanosci., 2015, 5, 927 CrossRef CAS.
  23. P. Wang and I. M. C. Lo, Water Res., 2009, 43, 3727 CrossRef CAS PubMed.
  24. W. Tang, Q. Li, S. Gao and J. K. Shang, J. Hazard. Mater., 2011, 192, 131 CAS.
  25. M. Pena, X. Meng, G. P. Korfiatis and C. Jing, Environ. Sci. Technol., 2006, 40, 1257 CrossRef CAS PubMed.
  26. X. B. Wang, W. P. Cai, Y. X. Lin, G. Z. Wang and C. H. Liang, J. Mater. Chem., 2010, 20, 8582 RSC.
  27. H. Xiao, Z. Ai and L. Zhang, J. Phys. Chem. C, 2009, 113, 16625 CAS.
  28. R. Li, Q. Li, S. Gao and J. K. Shang, Chem. Eng. J., 2012, 185–186, 127 CrossRef CAS.
  29. C. A. Martinson and K. J. Reddy, J. Colloid Interface Sci., 2009, 336, 406 CrossRef CAS PubMed.
  30. J. Ma, F. Yu, Z. Zhu, B. Chen, J. Chen, M. Yang, H. Zhou, C. Li, F. Yu and J. Chen, J. Mater. Chem. A, 2013, 1, 4662 CAS.
  31. B. Chen, Z. Zhu, J. Ma, Y. Qiu and J. Chen, J. Mater. Chem. A, 2013, 1, 11355 CAS.
  32. M. Yin, M. L. Wang, F. Miao, Y. X. Ji, Z. Tian, H. B. Shen and N. Q. Jia, Carbon, 2012, 50, 2162 CrossRef CAS.
  33. Y. J. Fu, L. Y. Zhang and G. Chen, Carbon, 2012, 50, 2563 CrossRef CAS.
  34. S. H. Hasan and D. Ranjan, Ind. Eng. Chem. Res., 2010, 49, 8927 CrossRef CAS.
  35. D. Pokhrel and T. Viraraghavan, J. Hazard. Mater., 2008, 150, 818 CrossRef CAS PubMed.
  36. K. K. Singh, R. Rastogi and S. H. Hasan, J. Colloid Interface Sci., 2005, 290, 61 CrossRef CAS PubMed.
  37. Y. S. Ho and G. McKay, Process Biochem., 1999, 34, 451 CrossRef CAS.
  38. M. N. Sahmoune and N. Ouazene, Environ. Prog. Sustainable Energy, 2012, 31, 597 CrossRef CAS.
  39. T. S. Singh and K. K. Pant, Sep. Purif. Technol., 2004, 36, 139 CrossRef CAS.
  40. N. A. Miranda, S. E. Baltazar, A. García, D. M. Lira, P. Sepúlveda, M. A. Rubio and D. Altbir, J. Hazard. Mater., 2016, 301, 371 CrossRef PubMed.
  41. L. Ai, C. Zhang, F. Liao, Y. Wanga, M. Li, L. Meng and J. Jiang, J. Hazard. Mater., 2011, 198, 282 CrossRef CAS PubMed.
  42. Y. S. Ho, J. F. Porter and G. Mckay, Water, Air, Soil Pollut., 2002, 141, 1 CrossRef CAS.
  43. S. Kundu and A. K. Gupta, Chem. Eng. J., 2006, 122, 93 CrossRef CAS.
  44. S. O. Lesmana, N. Febriana, F. E. Soetaredjo, J. Sunarso and S. Ismadji, Biochem. Eng. J., 2009, 44, 19 CrossRef CAS.
  45. L. Jiang and L. Gao, J. Mater. Chem., 2005, 15, 260 RSC.
  46. M. S. Dresselhaus, G. Dresselhaus, R. Saito and A. Jorio, Phys. Rep., 2005, 409, 47 CrossRef.
  47. S. Osswald, M. Havel and Y. Gogotsi, J. Raman Spectrosc., 2007, 38, 728 CrossRef CAS.
  48. S. Costa, E. Borowiak-Palen, M. Kruszynska, A. Bachmatiuk and R. J. Kalenczuk, Mater. Sci.-Pol., 2008, 26, 433 CAS.
  49. D. Gusain, F. Bux and Y. C. Sharma, J. Mol. Liq., 2014, 197, 131 CrossRef CAS.
  50. X. Gou and F. Chen, Environ. Sci. Technol., 2005, 39, 6808 CrossRef.
  51. Y. Yoon, W. K. Park, T. M. Hwang, D. H. Yoon, W. S. Yang and J. W. Kang, J. Hazard. Mater., 2016, 304, 196 CrossRef CAS PubMed.
  52. M. Tuzen, A. Sari, D. Mendil, O. D. Uluozlu, M. Soylak and M. Dogan, J. Hazard. Mater., 2009, 165, 566 CrossRef CAS PubMed.
  53. M. S. Podder and C. B. Majumder, J. Mol. Liq., 2015, 212, 382 CrossRef CAS.
  54. M. A. Hanif, R. Nadeem, N. Bhatti, N. R. Ahmad and T. M. Ansar, J. Hazard. Mater., 2007, 139, 345 CrossRef CAS PubMed.
  55. D. Tiwari and S. M. Lee, Chem. Eng. J., 2012, 204–206, 23 CrossRef CAS.
  56. M. A. Malana, R. B. Qureshi and M. N. Ashiq, Chem. Eng. J., 2011, 127, 721 CrossRef.
  57. S. A. Ntim and S. Mitra, J. Chem. Eng. Data, 2011, 56, 2077 CrossRef PubMed.
  58. P. Pillewan, S. Mukherjee, T. Roychowdhury, A. Bansiwal, S. Rayalu and S. Das, J. Hazard. Mater., 2011, 186, 367 CrossRef CAS PubMed.
  59. M. Mahramanlioglu and K. Güçlü, Environ. Technol., 2004, 25, 1067 CrossRef CAS PubMed.
  60. P. K. Singh, S. Banerjee, A. L. Srivastava and Y. C. Sharma, RSC Adv., 2015, 5, 35365 RSC.
  61. S. K. Swain, S. Mishra, T. Patnaik, R. K. Patel, U. Jha and R. K. Dey, Chem. Eng. J., 2012, 184, 72 CrossRef CAS.
  62. M. E. Argun, S. Dursun, C. Ozdemir and M. Karatas, J. Hazard. Mater., 2007, 141, 77 CrossRef CAS PubMed.

Footnote

Electronic supplementary information (ESI) available. See DOI: 10.1039/c5ra20601d

This journal is © The Royal Society of Chemistry 2016
Click here to see how this site uses Cookies. View our privacy policy here.