Enhanced transport of novel crystalline calcium-phosphonate scale inhibitor nanomaterials and their long term flow back performance in laboratory squeeze simulation tests

Ping Zhang*a, Amy T. Kana and Mason B. Tomson*ab
aDepartment of Civil and Environmental Engineering, Rice University, Houston, Texas, USA. E-mail: ping.zhang@alumni.rice.edu; mtomson@rice.edu
bNanosystems Engineering Research Center for Nanotechnology-Enabled Water Treatment, Rice University, Houston, Texas

Received 23rd September 2015 , Accepted 6th January 2016

First published on 6th January 2016


Abstract

In this study, novel crystalline phase calcium-phosphonate scale inhibitor nanomaterials were prepared from amorphous silica templated calcium-phosphonate precipitates. The transport of the nanomaterial suspension (nanofluid) was investigated in calcium carbonate and sandstone formation media using laboratory column breakthrough experiments. The nanomaterials were transportable through these formation media and the transport data can be interpreted using an advection–dispersion equation and a classical colloidal filtration theory. By preflushing the formation media prior to nanofluid injection, the nanofluid experienced enhanced migration in the column breakthrough tests. This observation can be explained by the calculation results of interaction energy of the nanomaterials with the formation medium particles by using Derjaguin–Landau–Verwey–Overbeek (DLVO) theory. The long term flow back performance of the crystalline nanomaterials was evaluated in laboratory squeeze simulation tests where the crystalline materials were first attached to the formation medium surfaces and then gradually returned phosphonates into the brine solution during flow back. Due to the low solubility of the crystalline nanomaterials, a long return profile with relatively stable phosphonate return concentrations can be observed in both calcium carbonate and sandstone media, suggesting of the potential advantage of applying these crystalline inhibitor nanomaterials in oilfield operations.

Introduction

As easily accessible hydrocarbons become less available, offshore oil production becomes more and more important. Mineral scale formation is a serious and expensive flow assurance challenge for offshore productions, particularly in deepwater fields. The principle scale deposition mechanisms in offshore productions include: (1) the change in pressure and temperature; (2) the mixing of incompatible fluids and (3) the increase of salt concentration.1–4 Phosphonates are widely used scale inhibitors in the oilfield to prevent scale formation. Conventionally, phosphonate inhibitors are applied in production wells via a squeeze treatment.5,6 In a squeeze treatment, a scale inhibitor solution (pill solution) is injected into a production formation, followed by a brine or diesel overflush to push the inhibitors farther away from the wellbore. The inhibitors are retained by the formation rock surfaces via either sorption or precipitation. During production following the squeeze treatment, the injected inhibitors will be gradually desorbed into the formation brine and flow back at certain concentrations. In many laboratory investigations and field observations,3,7–10 the inhibitor flow back concentration quickly reaches a peak value and declines to a low plateau level for a period of time. An adsorption squeeze is often carried out by injecting a neutralized pill into formation. A precipitation squeeze is performed by delivering an acidic pill into formation to form metal (mainly Ca2+)-phosphonate precipitates.7,10 Generally, the squeeze treatment has proven to be successful in terms of long scale protection time. However, it is observed that7 the acidic pills are mostly precipitated near the wellbore, leading to a limited protection area; the neutralized pills are able to migrate deeper into the formation, but only a small portion of the inhibitors can be retained by the formation medium, a large fraction of the inhibitors being eluted out of the reservoir during the initial return.3,4 Some recent advances in oilfield scale control technologies include the utilization of viscosified fluids and non-aqueous inhibitor solutions.11 Viscosified fluids were investigated to place scale inhibitors into formation via bullheaded application.12,13 Non-aqueous scale inhibitor solutions were developed in order to avoid possible damages induced by the aqueous squeeze treatment.14–16 It would be optimal for most all of the injected inhibitors to flow back at the same controllable concentration, resulting in an extended scale squeeze lifetime (indicating of the amount of produced water protected).17 Moreover, it is desirable to design the squeeze treatment in such a manner that maximum squeeze life can be achieved by forming a low soluble phase in the formation and that the transport distance of the phosphonate inhibitors into the formation can be managed and controlled.3

In our previous studies,18–21 a suspension containing scale inhibitor nanomaterials was prepared to extend their use in the delivery of phosphonate inhibitors into reservoir formation. The nanomaterial suspension (nanofluid) was transportable through calcium carbonate (calcite) and sandstone porous media at typical formation flow velocities. It should be noted that some literatures refer to the nanomaterials as those with a dimension less than 1000 nm; while others restrict this term to less than 100 nm. The flow back performance of the fabricated nanomaterials was evaluated via a laboratory squeeze simulation tests where the nanomaterials gradually released the phosphonates into the brine by a dissolution mechanism. Recently, a scale inhibitor nanofluid containing crystalline silica-based calcium-phosphonate nanomaterials has been prepared by developing the amorphous phase Ca-phosphonate precipitates through a diafiltration treatment.21 The transport experiments were conducted in a series of column flow-through experiments to investigate the migration behavior of the crystalline phase nanofluid in different types of formation media. Moreover, it has been observed that the surfactant preflush could affect the inhibitor return concentrations and a scale inhibitor squeeze modeling study was carried out to simulate such surfactant preflush effect.22

In this study, an enhanced transport performance of the aforementioned crystalline nanofluid in the calcite and sandstone media with a surfactant preflush treatment is reported. Derjaguin–Landau–Verwey–Overbeek (DLVO) theory was utilized to calculate the interaction energy between the nanomaterials and the formation material particles to elucidate the enhanced transport phenomenon. Furthermore, the advantage of the crystalline nanomaterials over the inhibitor pill solution as well as the amorphous nanomaterials was demonstrated in the long term flow back performance of the crystalline solids in a series of laboratory squeeze simulation tests where phosphonates were returned at considerably stable concentrations for thousands of pore volumes, leading to a significantly extended squeeze lifetime.

Experimental section

Chemicals

Commercial grade diethylenetriamine pentakis (methylenephosphonic acid) (DTPMP) with 50% activity was used as the scale inhibitor. Silica nanofluid (30% wt/wt) of 22 nm diameter and 135 m2 g−1 surface area was purchased from Nyacol Inc. (Ashland, MA). Chemicals such as calcium chloride, sodium chloride, nitric acid, sodium hydroxide, piperazine-1,4-bis(2-ethanesulfonic acid) sodium salt (PIPES) and sodium dodecylbenzene sulfonate (SDBS) were reagent grade and purchased from Fisher Scientific. Tritiated water was purchased from Sigma-Aldrich (Amersham Co. Arlington Height, IL). Deionized water (DI water) was prepared by reverse osmosis followed by a four-stage ion exchange water purification process, consisting of a high capacity cation/anion column, two ultra pure ion exchange columns and an organics removal column (Barnstead Internationals, Dubuque, IA).

Silica–calcium–DTPMP nanofluid synthesis

The preparation procedure of silica–calcium–DTPMP nanofluid was reported in a previous study.21 Basically, a Ca–SiO2 suspension was prepared by adding CaCl2 solution to a SiO2 nanofluid at 4.5 pH. Then, a basic DTPMP solution was added dropwise to the Ca–SiO2 mixture while vigorously stirred at 70 °C. The resultant silica–Ca–DTPMP slurry was diafiltered with a brine solution containing 0.8 M sodium chloride, 0.08 M sodium acetate and 0.1 M calcium chloride at 5.5 pH in order to develop the solid into a crystalline phase. Subsequently, the acquired suspension was centrifuged at 8500 rpm for 15 minutes to separate the Si–Ca–DTPMP solids from the liquid suspension. The crystalline nanofluid was acquired by dispersing the resulting crystalline solids by a probe sonicator (Sonics & Materials Inc, Newtown, CT) into an aqueous solution containing SDBS (7 mM) and KCl (13.5 or 33 mM). SDBS was added to control the particle size and KCl to control the solution salinity. The nanofluid was equilibrated by rotation in a tumbler for several days. Before characterization or transport studies, the crystalline silica–calcium–DTPMP (Si–Ca–DTPMP) nanofluid was re-sonicated for 15 minutes. The solid crystalline materials were dried in an oven at 100 °C overnight to remove the interstitial water and then characterized by electron microscopy.

Characterization of the Si–Ca–DTPMP nanomaterials

The scanning electron microscopy (SEM) (FEI Quanta 400 ESEM FEG at 20 keV) was used to study the morphology and the size of the nanomaterials. The electrokinetic characterization of both the nanofluid and the formation materials was similar to that of Tufenkji et al.23 Zeta potential of the nanofluid was measured at 70 °C in KCl solution using a Zeta-PALS instrument (Brookhaven Instruments Corporation, Holtsville, NY). In order to obtain the zeta potential of the formation medium (calcite or sandstone), the medium materials were first sonicated in a KCl solution (13.5 or 33 mM) by the probe sonicator at 100 watt for 30 minutes. After the ultrasonic treatment, the supernatant was diluted with a KCl solution (13.5 or 33 mM), followed by zeta potential measurement. The effect of SDBS on zeta potential of nanomaterials or formation medium was evaluated by diluting the nanofluid or the supernatant of the medium suspension with a KCl solution containing SDBS surfactant. Additionally, the dry Si–Ca–DTPMP solid obtained from centrifugation was characterized by X-ray diffraction (XRD) on a Ragaku D/max Ultra II Powder Diffractometer. The XRD spectra were shown in Fig. SI-2 in the ESI.

Nanomaterials column breakthrough experiments

The experimental setup and procedure of the column breakthrough experiments were similar to those in our previous studies.19–21 Calcite (Iceland spar, Creel Chihuahua, Mexico) and Louise sandstone were utilized as the formation medium materials. Louise sandstone was collected at Louise Well, Frio formation located in Galveston County, TX (9107–9110 ft). Louise sandstone is composed of less than 1% calcite, a small percentage of clay and over 90% of quartz.8 A non-reactive tracer (tritiated water, 3H2O) test was carried out to measure the dispersion coefficient of the packed column. Following the tracer test, Si–Ca–DTPMP nanofluid transport experiments were conducted by pumping several pore volumes (PV) of the inhibitor nanofluid through the column packed with formation medium. For a piece of core material, PV is the void space volume of the core, calculated as the total volume subtracted by the core material volume. PV is the volume fluids can occupy. The effect of SDBS preflush on the transport of nanomaterials in the column breakthrough experiments was investigated by flushing the formation medium with a solution containing 0.75% SDBS and 0.25% KCl prior to the loading of the nanofluid. The phosphonate concentrations in the inhibitor nanofluid for transport experiments were between 0.2 and 0.3% (wt/wt).

Laboratory squeeze simulation tests

The laboratory squeeze simulation tests of nanofluid in formation materials were conducted in a manner similar to the procedure of the previous studies using totally contained squeeze simulation apparatus.7,8,18,19 Briefly, a column (7 cm length, 0.66 cm ID) packed with Louise sandstone materials (approximately 3.8 g) was pre-saturated with a solution composed of 1 M NaCl and 0.01 M NaHCO3. Subsequently, half of a PV of the prepared Si–Ca–DTPMP nanofluid was injected into the column, followed by 0.5 PV overflush by 1 M NaCl solution. Upon completion of the overflush treatment, the column was shut-in for 24 h to allow the delivered nanomaterials to attach to the surfaces of the formation materials (calcite or sandstone). Subsequently, the column was eluted with a synthetic brine solution (0.025 M CaCl2, 0.015 M NaHCO3 and 1 M NaCl, sparged with 100% CO2) from an opposite direction under 75 psi pressure. The prepared synthetic brine was in equilibrium with respect to calcite to simulate the flow back of connate fluids in the field following a squeeze treatment. The column experiments were conducted at 70 °C with interstitial flow velocity of 45 m per day. The effluent solution was collected and analyzed for DTPMP concentration to establish the flow back return curve. A similar squeeze simulation test was carried out in a calcite (Iceland spar) medium as comparison.

Analytical methods

Calcium, silica and DTPMP concentrations were analyzed by inductively coupled plasma-optical emission spectrometer (ICP-OES) (Optima 4300 Dv, Perkin Elmer). The wavelengths for calcium, silica and phosphorus measurements are 317.933, 251.611 and 213.617 nm, respectively. A solution containing 5 mg L−1 yttrium (371.029 nm) was utilized as internal standard solution. Each sample measurement was repeated for five times and the mean value of these measurements was reported. The standard deviation for every sample measurement was less than 0.5%.

Results and discussion

Nanomaterials and formation medium characterization

In this study, KCl salt was employed as the background electrolyte in the course of transport studies to prevent clay swelling by maintaining the ion exchange selectivity and the mineral permeability.24 DTPMP is a common phosphonate scale inhibitor used in the oilfield for scale control. The effect of KCl electrolyte concentration on zeta potential and particle size of the synthesized Si–Ca–DTPMP nanomaterials was investigated at 70 °C and 6.7 pH in the presence of 7 mM SDBS (Table 1). The Si–Ca–DTPMP particles were negatively charged and the salt concentrations of interest appeared to have a negligible impact on either zeta potential or the particle size. Moreover, the SEM micrographs (Fig. 1) of the Si–Ca–DTPMP particles confirmed that the morphology and the particle size were not significantly altered by varying the KCl concentration, which is probably due to the presence of SDBS surfactant as a surface coating agent.
Table 1 Effect of KCl concentration on zeta potential and particle size of the Si–Ca–DTPMP nanomaterials at 70 °C and 6.7 pH
Added KCl concentration Zeta potential (mV) Particle sizea (nm)
a The reported particle size is the length of the cross sectional area of the prepared nanomaterials, as shown in Fig. 1.
13.5 mM KCl −61.46 ± 6.97 480 ± 150
33 mM KCl −51.27 ± 15.65 524 ± 111


image file: c5ra19618c-f1.tif
Fig. 1 SEM micrographs of the Si–Ca–DTPMP nanomaterials with KCl concentrations of (a) 13.5 mM and (b) 33 mM. The micrograph (b) was adopted from a previous study.21

The zeta potential of the formation materials was investigated at 70 °C and 6.7 pH in the presence and absence of 7 mM SDBS surfactant. Table 2 summarizes the effect of SDBS and KCl on the zeta potential of the medium materials (calcite and sandstone). In general, within the range of KCl concentrations considered, KCl did not play a notable role in determining the zeta potential of either calcite or sandstone materials. It was observed that, compared with divalent cations, the monovalent cations have a less pronounced effect on zeta potential of the dolomitic solids25 and sepiolite26 in that they were adsorbed to these mineral surfaces via simple electrostatic attraction forces and accumulated as counterions in the electrical double layer, instead of being adsorbed specifically into the surfaces, potentially causing a charge reversal. On the other hand, the addition of anionic SDBS surfactant exhibited a more notable effect. The presence of SDBS in calcite and sandstone showed a similar trend that the addition of SDBS resulted in more negative zeta potential values. Such an observation is in agreement with the experimental results of the anionic surfactant on zeta potential of kaolinite, montmorillonite and quartz powder in the presence of monovalent alkali salt ions,27 which can be explained in terms of ion-exchange: the hydroxyl group on the mineral surfaces exchanged the anionic part of the surfactant, leading to the formation of additional hydrogen bonds between the minerals and the surfactants.27 Another possible explanation is that electrostatic bridges between the anionic part of surfactants and the surface of mineral particles can be created by the presence of cations, leading to more negative zeta potential values.28 The measured zeta potential values of both the nanomaterials and the formation media are employed in the following surface interaction energy calculations.

Table 2 Effect of the presence of 7 mM SDBS on the zeta potential of the formation media particles at 70 °C and 6.7 pH
Added KCl concentration Zeta potential (mV) in calcite medium Zeta potential (mV) in sandstone medium
No SDBS With SDBS No SDBS With SDBS
13.5 mM KCl −9.78 ± 2.18 −25.96 ± 3.84 −38.97 ± 5.08 −55.38 ± 4.79
33 mM KCl −8.58 ± 0.75 −27.47 ± 1.38 −35.45 ± 4.89 −65.31 ± 5.45


Enhanced transport of nanomaterials through formation media

In the beginning, similar to the previous study,19 the hydrodynamic dispersion coefficients in calcite and Louise sandstone media were acquired by fitting the 1-D advection–dispersion equation (ADE) to the tracer breakthrough data via CXTFIT code29 (details in the ESI). The transport of Si–Ca–DTPMP nanomaterials through the formation medium can be described by the ADE with an additional term (Jd) representing the first-order removal.30–32 A retardation factor (R) was included to account for the sorption of nanomaterials to the medium surfaces. Retardation factor describes how much slower the nanomaterials transport in formation medium than water. Alternatively, from the perspective of classical colloidal filtration theory (CFT), the removal of colloidal particles by the formation medium can be characterized by the attachment efficiency (α) and the removal efficiency (η0) terms to account for the collision of nanomaterials with the medium surface and the attachment of the particles to the surface, respectively (details in the ESI). A decrease of α value suggests of a reduction of attachment of nanomaterials to formation medium surface. A series of laboratory column flow-through tests were conducted to investigate the surfactant preflush effect on the migration of inhibitor nanomaterials in the formation media. The Si–Ca–DTPMP nanofluid was loaded into columns packed with either calcite or sandstone in the absence or presence of SDBS preflush (Fig. 2). The flow rates and breakthrough levels of the column transport tests are summarized in Table 3. In calcite medium, without a SDBS preflush, the breakthrough level was determined to be 0.89 at interstitial velocity of 3.07 cm min−1; while with surfactant preflush, the preflush improved the breakthrough level to 0.97, leading to 4.05 times reduction of the α value. Similarly, in Louise sandstone medium the breakthrough level was elevated by surfactant preflushing from 0.89 to 0.96 at the interstitial velocity of approximately 0.4 cm min−1, resulting in the decrease of α value by a factor of 5.15.
image file: c5ra19618c-f2.tif
Fig. 2 Breakthrough curves of nanomaterials in (a) calcite and (b) sandstone media. Curves are CXTFIT modeling results.
Table 3 Summary of the nanofluid breakthrough experimentsa
Formation medium Condition Q (mL min−1) v (cm min−1) C/Co Jd (min−1) R η0 (×10−2) α (×10−2)
a Q is the volumetric flow rate in mL min−1; v is the linear flow rate in cm min−1; C/Co is the ratio of the steady-state effluent concentration and influent concentration of the nanomaterials; Jd is the first-order removal rate coefficient; R is the retardation factor; η0 is particle removal efficiency and α is the attachment efficiency.
Calcite Preflush 0.47 3.07 0.97 0.0066 1.04 ± 0.025 0.93 0.76
No preflush 0.47 3.07 0.89 0.051 1.03 ± 0.029 0.93 3.08
Louise sandstone Preflush 0.067 0.43 0.96 0.0023 1.03 ± 0.032 3.96 0.24
No preflush 0.064 0.41 0.89 0.0064 1.05 ± 0.033 3.96 1.23


In order to gain insight into the surfactant preflush effect on the nanomaterials transport in formation medium, DLVO theory was utilized to calculate the total interaction energy between the nanomaterials and the formation medium particles in the presence and absence of surfactant preflush.33,34 DLVO theory considers the interaction energy between two particles as the sum of two operative factors: the electric double layer (EDL) repulsion energy and London–van der Waals (VDW) attraction energy.24,35,36 The calculation of the EDL repulsion energy (EEDL) follows the Hogg equation:37

 
image file: c5ra19618c-t1.tif(1)
where ε0 is the vacuum permittivity (8.85 × 10⁻¹² F m−1); εr is the relative dielectric constant of water at 70 °C with value of 65; ap is the average radius of the nanomaterials (250 nm in this case); d (m) is the separation distance of nanomaterials with the formation medium surfaces and φp (volt) and φc (volt) are the surface potentials of nanomaterials and the formation medium particles, respectively. The surface potential that governs the electrostatic repulsion forces was taken to be equal to the measured zeta potential (Tables 1 and 2). It should be noted that zeta potential is different from surface potential. Surface potential, which cannot be measured experimentally, is the electric potential difference between the fluid bulk and the surface.38 Zeta potential is the electric potential difference between the fluid bulk and the slipping (shear plane). Thus, typically zeta potential is lower than the surface potential and the distance between the surface and the slipping (shear) plan cannot be rigorously defined.24 κ (m−1) is the inverse Debye–Huckel length, given by
 
image file: c5ra19618c-t2.tif(2)
where NA is the Avogadro number (6.022 × 10²³ mol−1); Ic (M) is the ionic strength (IS); kB is Boltzmann constant (1.38 × 10⁻²³ J K−1); T (K) is the absolute temperature (70 °C in this study), e is the electron charge (1.6 × 10⁻¹⁹ C). Note that in this study, the nanofluid is prepared by dispersing the crystalline solids after diafiltration by a probe sonicator in a KCl–SDBS solution. The solution IS of the prepared nanofluid is determined by the ionic composition of 13.5 mM or 33 mM KCl and 7 mM SDBS.

On the other hand, the VDW attraction energy (EVDW) was calculated as:39,40

 
image file: c5ra19618c-t3.tif(3)
where λ is the characteristic wavelength of the interaction (assumed to be 100 nm (ref. 41)) and A (J) is the Hamaker constant of the nanomaterials-water-formation medium system. Because the necessary optical data for Si–Ca–DTPMP nanomaterials are not available, for simplicity, the Hamaker constant for hydroxyapatite was adopted in the calculation. Since Louise sandstone is composed primarily of silica (>90%), the Hamaker constant for silica was used in the calculation. The approach of calculating Hamaker constant introduced by Israelachvili and Tabor42 and Valtiner et al.43 has been followed:
 
image file: c5ra19618c-t4.tif(4a)
 
image file: c5ra19618c-t5.tif(4b)
where h is the Plank constant; n1 and ν1 refer to the refractive index and absorption frequency of nanomaterials (hydroxyapatite), respectively; ν2 to the absorption frequency of the formation material; n3 to the refractive index of the medium (water in this case); and ε1, ε2, ε3 stand for the static dielectric constants of nanomaterials (hydroxyapatite), formation material and water, respectively. Hamaker constant is calculated to be 2.66 × 10⁻²¹ J and 6.05 × 10⁻²¹ J in calcite and sandstone media (silica), respectively. Hence, the total interaction energy (EI) between the nanomaterials and the formation particles can be expressed as:
 
image file: c5ra19618c-t6.tif(5)

On the basis of the experimentally acquired zeta potential values of the formation materials and the nanomaterials, EI was calculated in each medium at different KCl concentrations (Table 4). Fig. 3 and 4 also illustrate the calculated the interaction energy (in the unit of kBT) as a function of the separation distance between nanomaterials and formation medium surface. According to DLVO calculations, the increase of ionic strength reduced the height of energy barrier. In both formation media of calcite and sandstone, sizable repulsive energy barrier existed between the nanomaterials and medium particles. The presence of anionic SDBS surfactant enhanced the energy barrier at both KCl concentrations of 13.5 mM and 33 mM, due to the more negative zeta potential of the medium particles (Table 2). The substantially increased energy barrier in the presence of the SDBS surfactant inhibited the deposition of Si–Ca–DTPMP nanomaterials to medium surface, which explained the improved breakthrough level and correspondingly, the reduced attachment efficiency observed in the transport studies. Similar phenomenon was observed in the study of the transport of cryptosporidium oocyst to the ultrapure quartz surfaces.44 It was observed that bacteria, with less negative zeta potential, showed a higher deposition kinetics to the surfaces, compared to the bacteria with more negative zeta potential. Additionally, this study also predicted the interaction energy at the condition of 2 M IS, which can be encountered in oilfield productions. The ionic compositions and corresponding ionic strength of a formation water can vary significantly from region to region and from time to time over the vast periods of geologic time.1,24 The formation water chemistry is ultimately determined by the impacting formation mineral compositions and the geochemistry history wherein the biodegradation process and aqueous percolation through various minerals produced formation waters with different compositions.45 The formation water ionic concentrations can vary from as low as a thousand mg L−1 to over hundreds of thousands of mg L−1. On the other hand, in an oilfield squeeze treatment, the scale inhibitor pill solution can be of varied ionic strength, depending on the composition of the inhibitor product and field application environment.

Table 4 Calculated interaction energy (EI) of nanomaterials with formation medium at primary energy barrier and the secondary minimum
Formation medium Condition v (cm min−1) KCl = 13.5 mM KCl = 33 mM
Primary EIa (kBT)c Secondary EIb (kBT) Primary EI (kBT) Secondary EI (kBT)
a Primary EI stands for the interaction energy at the primary energy barrier.b Secondary EI stands for the interaction energy at the secondary minimum.c Interaction energy is reported in the unit of kBT, the product of Boltzmann constant (kB) with absolute temperature (T).
Calcite Preflush 3.07 197.34 −0.27 190.58 −0.55
No preflush 3.07 26.87 −0.34 15.77 −0.77
Louise sandstone Preflush 0.43 662.96 −0.25 607.26 −0.51
No preflush 0.41 400.49 −0.27 282.61 −0.58


image file: c5ra19618c-f3.tif
Fig. 3 Interaction energy between the nanomaterials and calcite medium particles as a function of the distance of nanomaterials with medium surfaces. (a) In the absence of SDBS preflush and (b) in the presence of SDBS preflush. The inset shows the secondary minimum attractive region. Interaction energy is reported in the unit of kBT, the product of Boltzmann constant (kB) with absolute temperature (T).

image file: c5ra19618c-f4.tif
Fig. 4 Interaction energy between the nanomaterials and Louise sandstone medium particles as a function of the distance of nanomaterials with medium surfaces. (a) In the absence of SDBS preflush and (b) in the presence of SDBS preflush. The inset shows the secondary minimum attractive region. Interaction energy is reported in the unit of kBT, the product of Boltzmann constant (kB) with absolute temperature (T).

The calculation effort in this study shows that with 2 M IS, the EDL energy profiles approached the surface and VDW attractive forces dominated both in calcite and sandstone media with and without SDBS presence (Fig. 3 and 4). In other words, the energy barrier between nanomaterials and medium particles disappears at 2 M IS. As pointed out by Hahn et al.,46 the increase in ionic strength will change the deposition from secondary minima to primary minima and eventually the energy barrier disappears, leading to particle aggregation and precipitation. The predicted reduction in interaction energy for nanomaterials-formation medium at 2 M IS illustrates one of the major challenges for application of nanomaterials in oilfield productions. On the other hand, it is worth mentioning that the understanding of the static interaction forces in aqueous solution under a high IS condition can be complicated by the observed effect due to ion-correlation mediated adhesion between the colloidal particles, which can deviate from the classical DLVO theory considerably.47,48 Future studies should address the stability of the nanofluid at high salinity system conditions. Additionally, Kar et al.49 elaborated that three boundary conditions can be specified while calculating the interaction energy: constant potential condition, constant charge density condition and thirdly, the mix of these two, i.e., one type of particles with a constant surface potential and the other type with a constant surface charge density. Constant potential conditions were assumed in most studies, especially for colloids such as mineral oxides and insoluble inorganic salts. In this study electrical double layer interactions are calculated by assuming constant potential boundary conditions. This is mainly due to the consideration that an electrochemical equilibrium has been established between the nanomaterials and the bulk solution during electrostatic interaction, partially attributable to the potential determining SDBS surfactant.49

Laboratory inhibitor nanofluid squeeze simulation

In order to evaluate the flow back performance of the crystalline Si–Ca–DTPMP nanomaterials and to simulate the nanomaterials-formation interaction at reservoir conditions, several laboratory squeeze simulation tests were conducted by injecting the Si–Ca–DTPMP nanofluid into Louise sandstone and calcite columns via totally contained squeeze protocol.7,8 During the 24 hour column shut-in period, the nanomaterials were allowed to adhere to the surfaces of the formation materials via either sorption or surface complexation mechanism. Subsequently, the column was eluted with a synthetic brine in the reverse direction to simulate the oilfield production process with connate fluids flowing back.3,7 An inhibitor return curve is plotted in Fig. 5 as the change of the effluent DTPMP concentrations verse the volume of returned brine, normalized by the column pore volume.
image file: c5ra19618c-f5.tif
Fig. 5 The long term flow back performance of the crystalline Si–Ca–DTPMP nanofluid in squeeze simulation test in Louise sandstone. Three returns curves were from a crystalline nanofluid in this study, an acidic pill solution and an amorphous nanomaterial fluid in a previous study.18 The insert shows the DTPMP return concentrations within the first 1000 PVs of in the four studies. The dashed line represents 0.5 mg L−1 of DTPMP.

Table 5 summarizes the physiochemical conditions of squeeze simulation tests of the crystalline phase Si–Ca–DTPMP material in this study and for comparison, one amorphous Ca–DTPMP nanomaterial and one acidic DTPMP pill from a previous study,18 all tested in columns packed with Louise sandstone medium. These three return experiments were conducted all by injecting half a PV of inhibitor slurry (or solution) into sandstone medium with active DTPMP concentrations of 0.8%. Fig. 5 displays the return curves of these three squeeze simulation tests at comparable experimental conditions. The return test with an acidic pill solution showed that the DTPMP return concentrations were as high as a thousand mg L−1 or higher in the initial several pore volumes, followed by a gradual decline to sub mg L−1 level within a few hundred PVs. The retention mechanism of the phosphonate inhibitors in calcite-bearing formation materials is proposed to be the precipitation and retention of calcium-phosphonate salt when a considerable amount of phosphonate pill solution was injected into the formation materials.7,8 The precipitated calcium-phosphonate salt was initially in amorphous (or microcrystalline) phase. Similar to the conventional acidic pill squeeze, the return curve of the amorphous phase Ca–DTPMP nanomaterials exhibited a similar pattern as that of the acid pill. As indicated in Table 6, in these two scenarios, 80% of the injected inhibitors flushed out at 47 PV and 200 PV, respectively, with an inhibitor return volume (squeeze lifetime) less than 1500 PV. In light of the above arguments, it can be concluded that the return behavior of the amorphous Ca–DTPMP nanomaterials were similar to that of the acidic pill solution, where DTPMP inhibitors were released in a large quantity in the first few hundreds of PVs, leading to a limited squeeze lifetime (Fig. 5). Such a return profile is characteristic of the returns of various types of phosphonates in carbonate-bearing formation materials, as encountered in field observations or in the laboratory investigations at similar physiochemical and fluid dynamic conditions.3,7,8

Table 5 Physiochemical conditions of each squeeze simulation test
Experiment Formation medium Ca2+a (M) Flow rate (mL h−1) Solution pH Temperature (°C) PV (mL) DTPMP injected (mg)
a The listed Ca2+ concentrations are the Ca2+ concentrations in the stock synthetic brine solutions.
Amorphous nanofluid (Shen et al.18) Sandstone 0.1 90 5.5 70 8 32
Acidic pill (Shen et al.18) Sandstone 0.1 90 5.5 70 8 32
Nanofluid (this study) Sandstone 0.1 90 5.5 70 1 4.1
Nanofluid (this study) Calcite 0.1 90 5.5 70 1 3.9


Table 6 Summary of the experimental results of each squeeze simulation test
Experiment Formation medium DTPMP injected (mg) Total volume returned (PV) V30a (PV) V80a (PV) Percent of inhibitor returnedb NSL (bbl kg−1)
a V30 and V80” denote the PVs of brine returned when 30% and 80% of the total inhibitors were flushed out.b “Percent of inhibitor returned” indicates the ratio of the amount of inhibitor returned in the squeeze test to the mass of inhibitor injected.
Amorphous nanofluid (Shen et al.18) Sandstone 32 1440 14.8 200 79 2270
Acidic pill (Shen et al.18) Sandstone 32 870 2.8 47 87 1370
Nanofluid (this study) Sandstone 4.1 3940 820 2670 80 6000
Nanofluid (this study) Calcite 3.9 5915 2141 4587 85 9500


The flow back performance of the developed crystalline phase Si–Ca–DTPMP nanomaterials in sandstone medium (Fig. 5) displayed a totally different return profile: the DTPMP return concentrations varied from 50 to 1 mg L−1 for the first several PVs, representing the initial return of the aqueous phosphonates inside the column. Subsequently, Si–Ca–DTPMP materials returned DTPMP at relatively stable concentrations between 0.5 and 1 mg L−1 for as long as 4000 PVs until the end of return test, wherein the majority of injected DTPMP inhibitors were flushed out of the column. Table 6 shows that 30% and 80% of the injected DTPMP returned at 820 PV and 2670 PV, respectively; while as for the case of the acidic pill, these two figures were only 2.8 and 47 PVs. To the best of our knowledge, it is the first time such long term inhibitor flow back performance with stable return concentrations is reported.

The inhibitor return profile is a function of temperature, ionic strength, brine pH, Ca2+ concentration and the pill acidity and concentration.50 The release of phosphonate inhibitors from metal-phosphonate precipitates in various laboratory and field studies is assumed to be dominated by the dissolution of the metal-phosphonate precipitates from the surfaces of the formation materials into the production brine.51 With respect to the Ca–DTPMP solids of interest in this study, considering the stoichiometry of the solid of Ca3H4DTPMP, the corresponding negative logarithm of ion activity product (pIAP) is in the form of:21

 
pIAP = −log10[(Ca2+)3{H+}4(DTPMP10−)] (6)
where parentheses refer to molar concentration and braces for activity. The free calcium ion (Ca2+) and DTPMP10− species concentrations were obtained from the total aqueous phase DTPMP concentrations through a speciation model, which considers the acid/base and complex solution chemistry as a function of pH, temperature and ionic strength.50 It has been confirmed that51 this model can be utilized to predict the field phosphonate return concentrations observed from several oil and gas wells with wide ranges of production conditions and they reported the negative logarithm of solubility product (pKsp) of crystalline phase Ca–DTPMP precipitate with value of 54.0 ± 0.26, obtained at a similar experimental condition (1 M NaCl, 5.5 pH and 70 °C). Fig. 5 plots the calculated pIAP of the nanomaterials return study as a function of the flushing brine volume. During the squeeze simulation, the calculated pIAP values changed insignificantly, indicating that the injected Ca–DTPMP solids were maintained as crystalline phase solids till the end of the return experiment. The average of the experimentally obtained pIAP values after 4000 PVs was 53.7 ± 0.20, which is comparable to the reported crystalline phase solid pKsp value of 54.0 ± 0.26.51 This phenomenon revealed that the effluent solution of this squeeze simulation study was in equilibrium (saturated) with the crystalline phase Ca–DTPMP solid.24,52 Evidently, the long term flow back performance of the developed crystalline Si–Ca–DTPMP nanomaterials with stable inhibitor return concentrations is attributable to the release of DTPMP from the crystalline Ca–DTPMP solid, governed by its low solubility in brine solutions. The development of the nanomaterials into their crystalline phase regulated the phosphonate return concentrations, leading to a considerably enhanced squeeze lifetime.

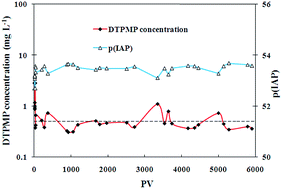
Similarly, a squeeze simulation test using crystalline Si–Ca–DTPMP nanomaterials was performed in a column packed with calcite (Iceland spar) (Fig. 6), since calcite is the primary formation material responsible for phosphonate retention.8 Similar to the long term return profile in Louise sandstone column, the Si–Ca–DTPMP nanomaterials returned DTPMP at a relatively stable concentration around 0.5 mg L−1 for nearly 6000 PV, which is due to the slow dissolution of the crystalline phase Ca–DTPMP solid. The calculated pIAP values were essentially constant with an average of 53.59 ± 0.14 (Fig. 6). Table 6 suggests that the squeeze lifetime was shorter in sandstone medium (3940 PV) than in the calcite medium (5900 PV) by comparing these two nanomaterial squeeze simulations. This might be attributed to the fact that calcite is the primary formation mineral to retain phosphonates and Louise sandstone medium has a lower calcite content than the pure calcite medium. The DTPMP return concentration by the end of the squeeze simulation in calcite medium was 0.36 mg L−1, which is commonly encountered in the oilfield.51 The effectiveness of 0.36 mg L−1 DTPMP scale inhibitor for barium sulfate and calcium carbonate scale control can be evaluated via a simple calculation effort using ScaleSoftPitzer software.53,54 The calculation was carried out by choosing the brine with compositions and field production conditions as list in Table SI-2 in the ESI. It was found that with 0.36 mg L−1 DTPMP presence, at the outlined conditions, barium sulfate scale can be inhibited up to 1.23 SI units and calcium carbonate scale up to 0.53 SI unit, where SI standards for saturation index and is defined as the logarithm of the saturation ratio.4


image file: c5ra19618c-f6.tif
Fig. 6 The long term flow back performance of the crystalline Si–Ca–DTPMP nanofluid in calcite (Iceland spar) medium. The dashed line represents 0.5 mg L−1 of DTPMP.

The concept of a “normalized squeeze lifetime (NSL)” can be employed to better illustrate the potential application of the prepared nanomaterials in oilfield operations.55 A NSL can be calculated from the ratio of effective return volumes and the mass of inhibitors injected, as defined in the literature.55 Since the total return volume is 5915 PV (Table 6) with 1 PV being 1 mL (Table 5) for the squeeze study in calcite medium, the total return volume of brine is about 5.9 liter. Recognizing the mass of DTPMP injected was 3.9 mg (Table 6), thus NSL from the nanomaterial squeeze simulation in calcite medium can be calculated as:

 
image file: c5ra19618c-t7.tif(7)
which indicates that in an inhibitor field application, scale control of the produced water with volume up to 9500 barrels can be managed by injecting a dose of crystalline phase nanofluid containing 1 kg of active DTPMP component. The obtained NSL value in this study is considerably extended over the conventional squeeze simulation results (summarized in Table 6). Similarly, a protection time (PT) can be calculated to illustrate the scale protection time from a single squeeze treatment. In a squeeze treatment in calcite medium, a brine production rate of 1000 bbl per day and a formation pore volume equivalent of 200 bbl were assumed for a production well. Recognizing a total return volume of 5900 PV (Table 6), the PT can be calculated as:
 
image file: c5ra19618c-t8.tif(8)
which indicates that the protection time from a single treatment using Si–Ca–DTPMP nanomaterials might last as long as 3.2 years for a well with a production rate of 1000 bbl per day. Normally, a conventional scale squeeze treatment by injection a volume of inhibitor pill solution typically lasts for about a few months to less than a year.17

Conclusions

In the present study, the enhanced migration of the crystalline Si–Ca–DTPMP nanomaterials in calcite and Louise sandstone formation media can be achieved via a surfactant preflush treatment and such phenomenon can be mechanistically understood by calculating the interaction energy of the nanomaterials with the formation medium particles. The laboratory squeeze simulation tests of such nanomaterials show that the developed crystalline Ca–DTPMP solid returned DTPMP inhibitors at a relatively constant concentration for thousands of PVs, which is of considerable advantage over the conventional inhibitor pill solutions. The long term flow back performance of the crystalline nanomaterials can be explained by their fixed low solubility in brine solution. Compared with the conventional treatment, the calculated NSL and PT values of the Si–Ca–DTPMP nanomaterials in calcite medium were also improved, suggesting of the potential advantage of utilizing these novel inhibitor nanomaterials for oilfield scale control applications. The inhibitor return concentration can be controlled by manipulating the morphological structure and solubility property of the applied nanomaterials.

Acknowledgements

The authors would like to acknowledge the financial support by Brine Chemistry Consortium including Baker Hughes, BWA, CARBO, Cenovus, Chevron, ConocoPhillips, Dow, EOG Resources, GE, Hess, Halliburton, Italmatch, Kemira, Kinder Morgan, Lubrizol, Marathon Oil, NALCO Champion, Occidental, Petrobras, RSI, Saudi Aramco, Schlumberger, Shell, SNF, Statoil and Total. “This work was supported by the NSF Nanosystems Engineering Research Center for Nanotechnology-Enabled Water Treatment (ERC-1449500)”.

Notes and references

  1. M. A. Kelland, Production Chemicals for the Oil and Gas Industry, CRC Press, Boca Raton, FL, 2nd edn, 2014 Search PubMed.
  2. P. Zhang, K. Allan and H. Bourne, Selection of Calcium Carbonate Scale Critical Values for Deepwater Production, SPE 173747, in SPE International Symposium on Oilfield Chemistry, The Woodlands, Texas, 2015 Search PubMed.
  3. M. B. Tomson, A. T. Kan, G. Fu, D. Shen, H. A. Nasr-El-Din, H. Al-Saiari and M. Al-Thubaiti, Mechanistic Understanding of Rock/Phosphonate Interactions and the Effect of Metal Ions on Inhibitor Retention, SPE J., 2008, 13, 325 CrossRef.
  4. M. B. Tomson, G. Fu, M. A. Watson and A. T. Kan, Mechanisms of Mineral Scale Inhibition, SPE Prod. Facil., 2003, 18, 192 CrossRef.
  5. A. G. Ostroff, Introduction to oilfield water technology, National Association of Corrosion Engineers, Houston, Texas, 2nd edn, 1979 Search PubMed.
  6. J. C. Cowan and D. J. Weintritt, Water-formed Scale Deposits, Gulf Publishing Company, Houston, Texas, 1976 Search PubMed.
  7. M. B. Tomson, A. T. Kan and G. Fu, Control of Inhibitor Squeeze via Mechanistic Understanding of Inhibitor Chemistry, SPE J., 2006, 11, 283–293 CrossRef.
  8. A. T. Kan, G. Fu and M. B. Tomson, Prediction of Scale Inhibitor Squeeze and Return in Calcite-Bearing Formation, SPE 93265, in SPE International Symposium on Oilfield Chemistry, The Woodlands, Texas, 2005 Search PubMed.
  9. A. Malandrino, M. D. Yuan, K. S. Sorbie and M. M. Jordan, Mechanistic Study and Modelling of Precipitation Scale Inhibitor Squeeze Processes, SPE 29001, in SPE International Symposium on Oilfield Chemistry, San Antonio, Texas, 1995 Search PubMed.
  10. M. M. Jordan, K. S. Sorbie, P. Griffin, S. Hennessey, K. E. Hourston and P. Waterhouse, Scale Inhibitor Adsorption/Desorption vs. Precipitation: The Potential for Extending Squeeze Life While Minimising Formation Damage, SPE 30106, in SPE European Formation Damage Conference, The Hague, Netherlands, 1995 Search PubMed.
  11. M. D. Yuan, The latest developments in scale control in oilfield, in The Science and Technology of Industrial Water Treatment, ed. Z. Amjad, CRC Press, Brecksville, Ohio, USA, 2010 Search PubMed.
  12. R. Stalker, G. M. Graham, D. Oliphant and M. Smillie, Potential Application of Viscosified Treatments for Improved Bullhead Scale Inhibitor Placement in Long Horizontal Wells – A Theoretical and Laboratory Examination, SPE 87439, in SPE International Symposium on Oilfield Scale, Aberdeen, UK, 2004 Search PubMed.
  13. J. S. James, D. M. Frigo, M. M. Townsend, G. M. Graham, F. Wahid and S. M. Heath, Application of a Fully Viscosified Scale Squeeze for Improved Placement in Horizontal Wells, SPE 94593, in SPE International Symposium on Oilfield Scale, Aberdeen, UK, 2005 Search PubMed.
  14. A. F. Miles, O. Vikane, D. S. Healey, I. R. Collins, J. Saeten, H. M. Bourne and H. M. Smith, Field Experiences Using ‘Oil Soluble’ Non-Aqueous Scale Inhibitor Delivery Systems, SPE 87431, in SPE International Symposium on Oilfield Scale, Aberdeen, UK, 2004 Search PubMed.
  15. H. Guan, K. S. Sorbie, M. Yuan and K. Smith, Non-Aqueous Squeeze Treatments in Sandstones: Core Flood Studies and Modeling, NACE 04386, in Corrosion, New Orleans, LA, 2004 Search PubMed.
  16. M. Jordan, E. Sørhaug, M. Elrick and D. Marlow, The Development of a Scale Management and Monitoring Program for a High-Temperature Oil Field During the Production-Decline Phase of the Life Cycle, SPE 106134, in SPE International Symposium on Oilfield Chemistry, Houston, Texas, 2007 Search PubMed.
  17. P. Zhang, A. T. Kan and M. B. Tomson, Oil Field Mineral Scale Control, in Mineral Scales and Deposits: Scientific and Technological Approaches, ed. Z. Amjad and K. Demadis, Elsevier Publishing, 2015 Search PubMed.
  18. D. Shen, P. Zhang, A. T. Kan, G. Fu, J. Farrell, and M. B. Tomson, Control Placement of Scale Inhibitors in the Formation With Stable Ca-DTPMP Nanoparticle Suspension and its Transport in Porous Media, in SPE International Oilfield Scale Conference, Aberdeen, UK, 2008 Search PubMed.
  19. P. Zhang, D. Shen, C. Fan, A. T. Kan and M. B. Tomson, Surfactant-Assisted Synthesis of Metal Phosphonate Inhibitor Nanoparticles and their Transport in Porous Media, SPE J., 2010, 15, 610–617 CrossRef.
  20. P. Zhang, A. T. Kan, C. Fan, S. Work, J. Yu, H. Lu, H. A. Al-Saiari and M. B. Tomson, Silica-templated synthesis of zinc-DTPMP nanoparticles, their transport in carbonate and sandstone porous media and scale inhibition, SPE J., 2011, 16, 662–671 CrossRef.
  21. P. Zhang, C. Fan, H. Lu, A. T. Kan and M. B. Tomson, Synthesis of the crystalline phase silica-based Ca-phosphonate nanomaterials and their transport in carbonate and sandstone porous media, Ind. Eng. Chem. Res., 2011, 50, 1819–1830 CrossRef CAS.
  22. O. Vazquez, E. J. Mackay, K. H. Al Shuaili, K. S. Sorbie and M. M. Jordan, Modeling a Surfactant Preflush with Non-Aqueous and Aqueous Scale Inhibitor Squeeze Treatments, SPE 113212, in Europec/EAGE Conference and Exhibition, Rome, Italy, 2008 Search PubMed.
  23. N. Tufenkji and M. Elimelech, Deviation from the Classical Colloid Filtration Theory in the Presence of Repulsive DLVO Interactions, Langmuir, 2004, 20, 10818–10828 CrossRef CAS PubMed.
  24. W. Stumm and J. J. Morgan, Aquatic Chemistry, Wiley-Interscience, 3rd edn, 1996 Search PubMed.
  25. R. Marouf, K. Marouf-Khelifa, J. Schott and A. Khelifa, Zeta potential study of thermally treated dolomite samples in electrolyte solutions, Microporous Mesoporous Mater., 2009, 122, 99–104 CrossRef CAS.
  26. M. Alkan, Ö. Demirbaş and M. Doğan, Electrokinetic properties of sepiolite suspensions in different electrolyte media, J. Colloid Interface Sci., 2005, 281, 240–248 CrossRef CAS PubMed.
  27. A. Kaya and Y. Yukselen, Zeta potential of soils with surfactants and its relevance to electrokinetic remediation, J. Hazard. Mater., 2005, 120, 119–126 CrossRef CAS PubMed.
  28. T. Yalçın, A. Alemdar, Ö. I. Ece and N. Güngör, The viscosity and zeta potential of bentonite dispersions in presence of anionic surfactants, Mater. Lett., 2002, 57, 420–424 CrossRef.
  29. J. B. Kool, J. C. Parker and M. T. van Genuchten, Parameter estimation for unsaturated flow and transport models – A review, J. Hydrol., 1987, 91, 255–293 CrossRef CAS.
  30. Y. Chu, Y. Jin and M. V. Yates, Virus Transport through Saturated Sand Columns as Affected by Different Buffer Solutions, J. Environ. Qual., 2000, 29, 1103–1110 CrossRef CAS.
  31. F. He, D. Zhao, J. Liu and C. B. Roberts, Stabilization of Fe–Pd nanoparticles with sodium carboxymethyl cellulose for enhanced transport and dechlorination of trichloroethylene in soil and groundwater, Ind. Eng. Chem. Res., 2007, 46, 29–34 CrossRef CAS.
  32. Y. Jin, M. V. Yates, S. S. Thompson and M. A. Jury, Sorption of Viruses during Flow through Saturated Sand Columns, Environ. Sci. Technol., 1997, 31, 548–555 CrossRef CAS.
  33. M. Elimelech, J. Gregory, X. Jia and R. Williams, Particle Deposition & Aggregation: Measurement, Modelling and Simulation, Butterworth-Heinemann, 2009 Search PubMed.
  34. E. J. W. Verwey, Theory of the Stability of Lyophobic Colloids, J. Phys. Chem., 1947, 51, 631–636 CrossRef CAS PubMed.
  35. A. W. Adamson and A. P. Gast, Physical Chemistry of Surfaces, Wiley-Interscience, 6th edn, 1997 Search PubMed.
  36. R. J. Hunter, Foundations of colloid science, Oxford University Press, 2nd edn, 2001 Search PubMed.
  37. R. Hogg, T. W. Healy and D. W. Fuerstenau, Mutual coagulation of colloidal dispersions, Trans. Faraday Soc., 1966, 62, 1638–1651 RSC.
  38. K. S. Birdi, Handbook of surface and colloid chemistry, CRC Press, Florida, 3rd edn, 2008 Search PubMed.
  39. M. Elimelech and C. R. O'Melia, Effect of Particle Size on Collision Efficiency in the Deposition of Brownian Particles with Electrostatic Energy Barriers, Langmuir, 1990, 6, 1153–1163 CrossRef CAS.
  40. J. Gregory, Approximate expressions for retarded van der Waals interaction, J. Colloid Interface Sci., 1981, 83, 138–145 CrossRef CAS.
  41. J. H. Schenkel and J. A. Kitchener, A test of the Derjaguin–Verwey–Overbeek theory with a colloidal suspension, Trans. Faraday Soc., 1960, 56, 161–173 RSC.
  42. J. N. Israelachvili and D. Tabor, The measurement of van der Waals dispersion forces in the range of 1.5 to 130 nm, Proc. R. Soc. London, 1972, 331, 19–38 CrossRef CAS.
  43. M. Valtiner, X. Banquy, K. Kristiansen, G. W. Greene and J. N. Israelachvili, The Electrochemical Surface Forces Apparatus: The Effect of Surface Roughness, Electrostatic Surface Potentials, and Anodic Oxide Growth on Interaction Forces, and Friction between Dissimilar Surfaces in Aqueous Solutions, Langmuir, 2012, 28, 13080–13093 CrossRef CAS PubMed.
  44. Z. A. Kuznar and M. Elimelech, Adhesion kinetics of viable Cryptosporidium parvum oocysts to quartz surfaces, Environ. Sci. Technol., 2004, 38, 6839–6845 CrossRef CAS PubMed.
  45. J. B. Becker, Corrosion and Scale Handbook, PennWell, Oklahoma, 1999 Search PubMed.
  46. M. W. Hahn, D. Abadzic and C. R. O'Melia, Aquasols: On the Role of Secondary Minima, Environ. Sci. Technol., 2004, 38, 5915–5924 CrossRef CAS PubMed.
  47. T. Baimpos, B. R. Shrestha, S. Raman and M. Valtiner, Effect of Interfacial Ion Structuring on Range and Magnitude of Electric Double Layer, Hydration, and Adhesive Interactions between Mica Surfaces in 0.05–3 M Li+ and Cs+ Electrolyte Solutions, Langmuir, 2014, 30, 4322–4332 CrossRef CAS PubMed.
  48. R. M. Espinosa-Marzal, T. Drobek, T. Balmer and M. P. Heuberger, Hydrated-ion ordering in electrical double layers, Phys. Chem. Chem. Phys., 2012, 14, 6085–6093 RSC.
  49. G. Kar, S. Chander and T. S. Mika, The Potential Energy of Interaction Between Dissimilar Electrical Double Layers, J. Colloid Interface Sci., 1973, 44, 347–355 CrossRef CAS.
  50. M. B. Tomson, A. T. Kan and J. E. Oddo, Acid/Base and Metal Complex Solution Chemistry of the Polyphosphonate DTPMP versus Temperature and Ionic Strength, Langmuir, 1994, 10, 1442–1449 CrossRef CAS.
  51. A. T. Kan, J. E. Oddo and M. B. Tomson, Formation of Two Calcium Diethylenetriaminepentakis(methylene phosphonic acid) Precipitates and Their Physical Chemical Properties, Langmuir, 1994, 10, 1450–1455 CrossRef CAS.
  52. A. Lasaga, Kinetic Theory in the Earth Sciences, Princeton University Press, 1998 Search PubMed.
  53. A. T. Kan, X. Wu, G. Fu and M. B. Tomson, Validation of Scale Prediction Algorithms at Oilfield Conditions, SPE 93264, in SPE International Symposium on Oilfield Chemistry, The Woodlands, 2005 Search PubMed.
  54. A. T. Kan and M. B. Tomson, Scale prediction for oil and gas production, SPE J., 2012, 17, 362–378 CrossRef CAS.
  55. A. T. Kan, G. Fu, D. Shen, H. Al-Saiari and M. B. Tomson, Enhanced Scale-Inhibitor Treatments With the Addition of Zinc, SPE J., 2009, 14, 617–626 CrossRef CAS.

Footnote

Electronic supplementary information (ESI) available. See DOI: 10.1039/c5ra19618c

This journal is © The Royal Society of Chemistry 2016
Click here to see how this site uses Cookies. View our privacy policy here.