Tuning dielectric transitions by B′-site mixing in hybrid double perovskite crystals (CH3NH3)2[K1−xRbxCo(CN)6] (x = 0.23–0.62)†
Chao
Shi
,
Xiang-Bin
Han
,
Ya
Wang
and
Wen
Zhang
 *
*
Ordered Matter Science Research Center, Southeast University, Nanjing 211189, China. E-mail: zhangwen@seu.edu.cn
First published on 13th October 2016
Abstract
Mixing of the B′-site alkali metals in the hybrid double perovskite crystals (CH3NH3)2[K1−xRbxCo(CN)6] (x = 0.23–0.62) results in a fine tuning of the phase transition temperatures and therefore the switchable dielectric constant properties. The correlations among the phase transition temperature Tc, radius of the B′-site metal ion rB′, molar ratio x and extended tolerance factor t are established as rB′ = (1 − x)rK + xrRb, x = −13.2 + 0.645Tc1/2, rB′ = −32.4 + 9.02Tc1/2 and t = 513/(14x + 616). These findings indicate the efficiency and practicability of the B′-site mixing method for tuning the phase transition-related properties of the hybrid perovskites.
Introduction
Phase transitions in solid-state materials are often accompanied by properties that are switchable between at least two different states because of local structure rearrangements.1,2 This leads to a large variety of stimuli-responsive materials such as ferroelectrics, spin crossover compounds and switchable dielectrics.3–9 To improve the performances of the materials, the most convenient and efficient approach is the doping/mixing method that has been widely employed. By mixing with similar atoms, ions, groups or molecules, the responsive properties of the materials can be finely tuned.10,11For phase transition-triggered switchable materials, the phase transition temperature (Tc) is one of the key parameters defining the corresponding switchable property. It can be readily tuned by the mixing method. For example, the paraelectric-ferroelectric Tc of ceramic BaTiO3 shifts to a lower temperature region upon doping with Sr ions at the Ba site.5a,b For the molecule-based ferroelectric compound (NH2NH3)[Mn(HCOO)3], the Tc (355 K) is tuned by mixing the cation with the similar CH3NH3 cation. The resulting mixed compounds [(NH2NH3)x(CH3NH3)1−x][Mn(HCOO)3] (x = 1.00–0.67) show a downward shift of the Tc with a decrease of x.7e For (CH3NH3)5Bi2Cl11(1−x)Br11x, varying the ratio of the Cl and Br ions causes changes in the dielectric properties and Tc.12
In previous studies, we reported switchable dielectric constants in a series of typical hybrid organic–inorganic double perovskite compounds A2[B′B′′(CN)6]. This type of structure can be seen as an expansion of the well known perovskite-type structure ABO3 by replacing the A-site metal ion with a molecular cation, the B-site metal ion with two different metal ions and the O ion with an anionic CN bridging ligand.6,13 The polar A cations, confined in cage-like anionic cavities, are found to undergo order-disorder transitions in the crystals. The dynamic changes of the cations are responsible for the switchable dielectric constant, i.e., a dielectric transition between high- and low-dielectric states.
A recent study on (MA)2[B′Co(CN)6] (MA = the methylammonium cation; B′ = Na, K, Rb) shows that the three compounds undergo dielectric transitions at different temperatures. A relationship between the radius of the B′ ion (rB′) and Tc was established to explain the experimental result, i.e. the larger the radius of the B′ ion, the higher the Tc.6f As a continuation of this work, here we report a detailed B′-site mixing study of the (MA)2[K1−xRbxCo(CN)6] (x = 0.23–0.62) series. The phase and dielectric transitions of the mixed crystals (MA)2[K1−xRbxCo(CN)6] (x = 0.23, 0.31, 0.34, 0.44, 0.62) are readily tuned, showing a linear relationship between x and Tc1/2.
Experimental
Measurements
Elemental analysis (EA) for C, H and N was performed on a Vario MICRO analyzer. A Nicolet 5700 spectrometer was used to obtain the infrared (IR) spectra. Powder X-ray diffraction (PXRD) patterns were recorded by a Rigaku SmartLab X-ray diffraction instrument. Thermal gravimetric analysis (TGA) was carried out on a TA Instruments Q500 at a rate of 10 K min−1 in air flow. Differential scanning calorimetry (DSC) measurements were performed on a NETZSCH DSC 200F3 under nitrogen at atmospheric pressure with a heating/cooling rate of 10 K min−1 between 293 and 520 K. The averaged temperature of the peak temperatures upon heating and cooling is used as the Tc. Dielectric constant curves were measured on powdered samples by a Tonghui TH2828A impedance analyzer in the frequency range from 500 Hz to 1 MHz with an applied electric field of 1.0 V.Synthetic procedures
Crystals of (MA)2[K1−xRbxCo(CN)6] (x = 0.23–0.62) were prepared in the same way as reported previously,6f but with different molar ratios of the starting materials (MA)Cl, K3[Co(CN)6] and Rb3[Co(CN)6]. Pale-yellow block crystals were obtained after slow evaporation of the aqueous solutions at room temperature. The yields of the samples were above 80%, based on K3[Co(CN)6]. IR spectra of the samples show the typical vibrational peaks of CN groups at 2125 cm−1 (Fig. S1†). Elemental analysis calcd (%) for C8H12CoN8K0.38Rb0.62: C 27.68, H 3.49, N 32.29; found: C 27.81, H 3.42, N 32.16. C8H12CoN8K0.56Rb0.44: C 28.29, H 3.57, N 33.0; found: C 28.43, H 3.52, N 32.94. C8H12CoN8K0.66Rb0.34: C 28.76, H 3.63, N 33.55; found: C 28.86, H 3.56, N 33.40. C8H12CoN8K0.69Rb0.31: C 28.86, H 3.64, N 33.67; found: C 28.94, H 3.59, N 33.58. C8H12CoN8K0.77Rb0.23: C 29.43, H 3.68, N 34.07; found: C 29.44, H 3.63, N 34.06.Single-crystal X-ray crystallography
Single-crystal diffraction data of (MA)2[K1−xRbxCo(CN)6] (x = 0.23–0.62) were collected on a Rigaku Saturn 724+ diffractometer using Mo-Kα (λ = 0.71073 Å) radiation from a graphite monochromator. The CrystalClear software package was used in data processing. The structures were solved by direct methods and successive Fourier synthesis and then refined by full-matrix least-squares refinements on F2 using the SHELXTL software package. For the room-temperature structures, all non-hydrogen atoms were refined anisotropically and the positions of all hydrogen atoms were generated geometrically. For the high-temperature structure, all non-hydrogen atoms were refined anisotropically, the indistinguishable C and N atoms of the disordered MA cation were refined as C atoms and no hydrogen atoms were added. Crystallographic data and structural refinement details for (MA)2[K1−xRbxCo(CN)6] (x = 0.23–0.62) are listed in Table 1.| a R 1 = ∑||Fo| − |Fc||/|Fo|. b wR2 = [∑w(Fo2 − Fc2)2]/[∑w(Fo2)2]1/2. c Maximum and minimum residual electron density. | ||||||
|---|---|---|---|---|---|---|
| x | 0.23 | 0.23 | 0.32 | 0.34 | 0.4 | 0.62 |
| T/K | 293 K | 460 K | 293 K | 293 K | 293 K | 293 K |
| Formula weight | 328.95 | 328.95 | 332.66 | 334.05 | 338.69 | 347.04 |
| Crystal system | Monoclinic | Cubic | Monoclinic | Monoclinic | Monoclinic | Monoclinic |
| Space group | C2/c |
Fm![[3 with combining macron]](https://www.rsc.org/images/entities/char_0033_0304.gif) m m |
C2/c | C2/c | C2/c | C2/c |
| a/Å | 13.698(3) | 11.466(5) | 13.711(3) | 13.720(3) | 13.754(3) | 13.781(3) |
| b/Å | 7.864(2) | 11.466(5) | 7.889(2) | 7.901(2) | 7.884(2) | 7.899(2) |
| c/Å | 13.681(3) | 11.466(5) | 13.717(3) | 13.729(3) | 13.749(3) | 13.776(3) |
| α/° | 90.00 | 90.00 | 90.00 | 90.00 | 90.00 | 90.00 |
| β/° | 108.65(3) | 90.00 | 108.73(3) | 108.63(3) | 108.47(3) | 108.34(3) |
| γ/° | 90.00 | 90.00 | 90.00 | 90.00 | 90.00 | 90.00 |
| V/Å3 | 1396.29 | 1507.43 | 1404.96 | 1410.14 | 1413.94 | 1423.27 |
| Z | 4 | 4 | 4 | 4 | 4 | 4 |
| D calc/g cm−3 | 1.565 | 1.399 | 1.573 | 1.574 | 1.591 | 1.620 |
| μ/mm−1 | 2.251 | 2.084 | 2.489 | 2.574 | 2.879 | 3.419 |
| F(000) | 664.6 | 617.5 | 670.3 | 672.5 | 679.7 | 692.6 |
| θ range/° | 3.03–27.49 | 3.08–27.30 | 3.02–27.48 | 3.02–27.45 | 3.02–27.48 | 3.01–27.49 |
| Reflns collected | 4749 | 4020 | 4754 | 4726 | 4808 | 4832 |
| Independent reflns (Rint) | 1597 (0.0540) | 118 (0.0669) | 1606 (0.0521) | 1608 (0.0423) | 1616 (0.0432) | 1630 (0.0728) |
| No. of parameters | 87 | 15 | 87 | 87 | 87 | 87 |
R
1![[thin space (1/6-em)]](https://www.rsc.org/images/entities/char_2009.gif) a, wR2 a, wR2 ![[thin space (1/6-em)]](https://www.rsc.org/images/entities/char_2009.gif) b [I > 2σ(I)] b [I > 2σ(I)] |
0.0301,0.0755 | 0.0929, 0.2401 | 0.0571, 0.1694 | 0.0547, 0.1678 | 0.0478, 0.1545 | 0.0506, 0.1385 |
| R 1, wR2 [all data] | 0.0358, 0.0770 | 0.0928, 0.2400 | 0.0614,0.1727 | 0.0602,0.1710 | 0.0520,0.1574 | 0.0582,0.1418 |
| GOF | 1.085 | 1.254 | 1.104 | 1.124 | 1.187 | 1.070 |
| Δρc/e Å−3 | 0.478, −0.640 | 0.705, −0.750 | 0.796, −1.913 | 0.716, −2.035 | 1.213, −0.613 | 0.665, −1.450 |
Results and discussion
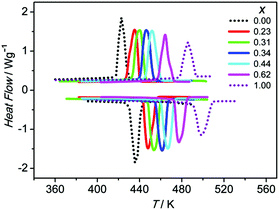
The (MA)2[K1−xRbxCo(CN)6] series was prepared with five ratios of K/Rb. The x value was determined by averaging the EA results of three measurements for each batch of the samples. All of the following measurements were performed on a sample in the same batch. The phase purities of the samples were verified by the PXRD patterns (Fig. S2†). Their thermal stabilities below 530 K were verified by TGA measurements (Fig. S3†).The phase transitions in (MA)2[K1−xRbxCo(CN)6] were firstly checked by DSC measurement. The pure compounds, i.e., (MA)2[KCo(CN)6] (x = 0) and (MA)2[RbCo(CN)6] (x = 1), show reversible phase transitions at 423 K and 485 K, respectively.6f For the doped compounds with x increasing from 0.23 to 0.62, the Tc continues to increase from 435 K to 464 K, i.e., the greater the value of x, the higher the Tc (Fig. 1). The corresponding entropy changes during the phase transitions are calculated giving values varying between 42.56 and 45.32 J mol−1 K−1, indicating a similar phase transition mechanism to the pure compounds.
As stated above, the phase transitions in (MA)2[K1−xRbxCo(CN)6] cause striking dielectric transitions between low- and high-dielectric states at different temperatures. The temperature dependence of ε′ (the real part of ε, ε = ε′ − iε′′) for (MA)2[K1−xRbxCo(CN)6] is shown in Fig. 2 and S4. At 1 MHz, the Tc/ε′max/x values are 435 K/14.5/0.23, 440 K/14.0/0.31, 446 K/13.0/0.34, 452 K/12.5/0.44 and 464 K/12.0/0.62. The switching temperatures are consistent with the Tc values measured in the DSC curves. The characteristics of switchable dielectric constants are evident in the series. They have the same ε′ value of about 5.0 in the low-dielectric state and vary between 12 and 15 in the high-dielectric state. It is clear that by mixing the B′-site ions, the dielectric transitions of the (MA)2[K1−xRbxCo(CN)6] series are systematically tuned between 423 K and 485 K.
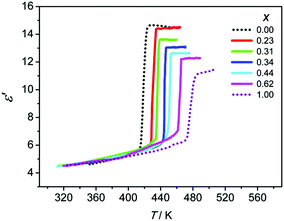 | ||
| Fig. 2 Temperature dependence of the real part of the dielectric constant ε′ of (MA)2[K1−xRbxCo(CN)6] measured at 1 MHz. | ||
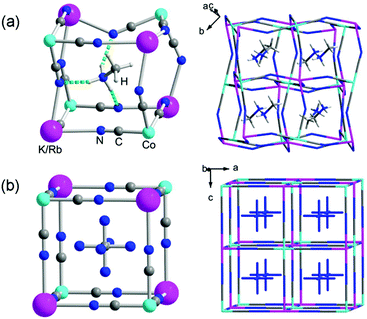
Structural changes in the (MA)2[K1−xRbxCo(CN)6] series were studied by single-crystal X-ray diffraction (Fig. 3 and Table 1). Taking (MA)2[K0.77Rb0.23Co(CN)6] as an example, in the low-temperature phase (293 K), it crystallizes in the monoclinic space group C2/c with a = 13.698(3) Å, b = 7.864(2) Å, c = 13.681(3) Å and β = 108.65(3)°, which are nearly equal to the values for x = 0. The anionic cage is highly irregular due to tilting of the [Co(CN)6] octahedra (Fig. 3a). The Co⋯B′ distances are between 5.411 and 5.802 Å and the C![[triple bond, length as m-dash]](https://www.rsc.org/images/entities/char_e002.gif) N–B′ angles are between 133.49 and 152.78°. As a result, the coordination environment of the alkali metal ion (B′N6) is a completely distorted octahedron. The corresponding B′–N distances vary in the range 2.851–2.915 Å, and the N–B′–N angles vary in the ranges 79.39–113.17° (cis) and 153.04–169.63° (trans). The MA cation, remaining in a completely ordered state, is anchored in the anionic cage by weak hydrogen bonds between the –NH3 and –CN groups with N⋯N distances of 2.965–3.225 Å.
N–B′ angles are between 133.49 and 152.78°. As a result, the coordination environment of the alkali metal ion (B′N6) is a completely distorted octahedron. The corresponding B′–N distances vary in the range 2.851–2.915 Å, and the N–B′–N angles vary in the ranges 79.39–113.17° (cis) and 153.04–169.63° (trans). The MA cation, remaining in a completely ordered state, is anchored in the anionic cage by weak hydrogen bonds between the –NH3 and –CN groups with N⋯N distances of 2.965–3.225 Å.
In the high-temperature phase (463 K), the crystal undergoes a dramatic structure change and crystallizes in the cubic Fm![[3 with combining macron]](https://www.rsc.org/images/entities/char_0033_0304.gif) m space group with cell parameters of a = b = c = 11.466(5) Å, slightly longer than the value of 11.454(6) Å for x = 0 at 463 K (Fig. 3b). The tilting of the [Co(CN)6] octahedron disappears due to highly symmetric thermal vibrations of the CN groups. The B′ metal ion seems to show a regular octahedral coordination geometry with six adjacent cyanide N atoms. In the anionic cage, the B′–N distance is 2.683 Å and the edge (Co–C
m space group with cell parameters of a = b = c = 11.466(5) Å, slightly longer than the value of 11.454(6) Å for x = 0 at 463 K (Fig. 3b). The tilting of the [Co(CN)6] octahedron disappears due to highly symmetric thermal vibrations of the CN groups. The B′ metal ion seems to show a regular octahedral coordination geometry with six adjacent cyanide N atoms. In the anionic cage, the B′–N distance is 2.683 Å and the edge (Co–C![[triple bond, length as m-dash]](https://www.rsc.org/images/entities/char_e002.gif) N–B′) has a length of 5.733 Å. The MA cation resides in the cage and shows a high degree of orientational disorder. It is thought that the relatively labile coordination geometry of the alkali metal ion may leave much room for the drastic structure change of the anionic framework between the regular cube and heavily distorted cage, which contributes to the occurrence of the structure’s phase transition.
N–B′) has a length of 5.733 Å. The MA cation resides in the cage and shows a high degree of orientational disorder. It is thought that the relatively labile coordination geometry of the alkali metal ion may leave much room for the drastic structure change of the anionic framework between the regular cube and heavily distorted cage, which contributes to the occurrence of the structure’s phase transition.
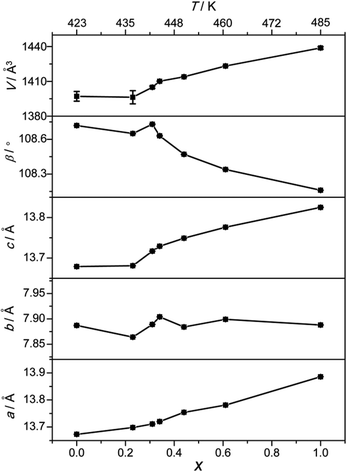
The room-temperature structures of the (MA)2[K1−xRbxCo(CN)6] series are thoroughly compared to reveal mixing effects. All of them are isostructural, with the same space group, C2/c, and very similar cell parameters. This fact is common in perovskites, i.e., upon mixing, the compounds show similar PXRD patterns and cell parameters, indicating no large structural changes occured. For the (MA)2[K1−xRbxCo(CN)6] series, with an increase in x, the a and c axes increase, β decreases and the b axis changes little (Fig. 4). As a result, the V increases with the increase in x. The changes in the series are thought to come from the different ionic radii of the B′ ions, though the difference between K (1.38 Å) and Rb (1.52 Å) is small.
It has been reported that, in (MA)2[B′Co(CN)6] (B′ = Na, K and Rb), the Tc is effectively tuned by the B′ metal ions.6f The relationship between rB′ and Tc is found to be rB′ = −19.53 + 8.39Tc1/2, meaning rB′ ∝ Tc1/2. For the doped (MA)2[K1−xRbxCo(CN)6] series, the relationship between Tc and x can be established by using the averaged rB′ = (1 − x)rK + xrRb. The fitted equation is expressed as x = −13.2 + 0.645Tc1/2 (R = 0.987) and further rB′ = −32.4 + 9.02Tc1/2 (R = 0.987) (Fig. 5a and Table S1†). This fact indicates that the switching temperatures of (MA)2[K1−xRbxCo(CN)6] can be readily tuned by variation of the B′ components in the host structures.
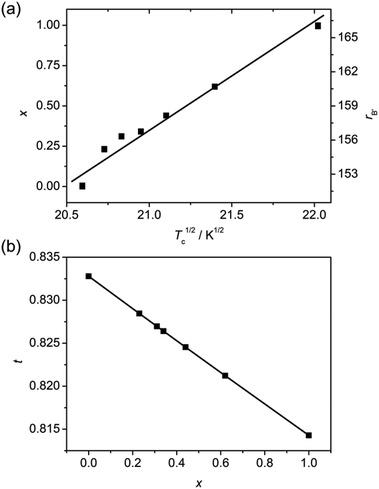 | ||
| Fig. 5 Relationships of (a) Tc1/2versus x (the line represents a fit to the data points) and (b) x versus t (the line is a guide for the eye) in the (MA)2[KxRb1−xCo(CN)6] series. | ||
As mentioned before, the dielectric transitions in (MA)2[B′Co(CN)6] (B′ = Na, K and Rb) are triggered by the instability of the ideal cubic phases which can be readily described by the extended Goldschmidt tolerance factor (t),6f,14,15i.e., t = 513/(rB′ + 464). The effective radii of the organic cation and cylinder-like anion are adopted from the data estimated by Kieslich and Cheetham et al.15a In this case, the relationship between t and x can be described by t = 513/(14x + 616) (Fig. 5b). For the mixed crystals, t decreases with increasing x. Its value lies between 0.814 and 0.833, corresponding to the Tc range between 424 and 485 K. Based on these results, it is found that the greater the x, the higher the Tc and the smaller the t. These findings establish a clear relationship among the components, structures and phase transition temperatures, indicating the efficiency and practicability of the B′-site mixing method for tuning the phase transition-related properties of the hybrid perovskites.
Conclusions
In summary, a series of B′-site doped hybrid double perovskite-type compounds (MA)2[K1−xRbxCo(CN)6] (x = 0.23–0.62) were synthesized. With the increase in x from 0.23 to 0.62, the phase transition temperature Tc continues to increase from 435 K to 464 K, i.e., the greater the x, the higher the Tc. The characteristic dielectric transitions between the high- and low-dielectric states are consistent with the phase transition behaviors. The correlations among the Tc, radius of the B′-site metal ion rB′, molar ratio x and extended tolerance factor t are established as rB′ = (1 − x)rK + xrRb, x = −13.2 + 0.645Tc1/2, rB′ = −32.4 + 9.02Tc1/2 and t = 513/(14x + 616). These findings indicate the efficiency and practicability of the B′-site mixing method for tuning the phase transition-related properties of the hybrid perovskites. The tunable dielectric transitions above room temperature in the (MA)2[K1−xRbxCo(CN)6] series make them applicable switchable dielectric materials.Acknowledgements
This work was financially supported by NSFC (Grant No. 21225102).Notes and references
- P. Theato, B. S. Sumerlin, R. K. O'Reilly and T. H. Epps III, Chem. Soc. Rev., 2013, 42, 7055 RSC.
- O. Kahn and C. J. Martinez, Science, 1998, 279, 44 CrossRef CAS.
- (a) B. Kundys, A. Lappas, M. Viret, V. Kapustianyk, V. Rudyk, S. Semak, C. Simon and I. Bakaimi, Phys. Rev. B: Condens. Matter, 2010, 81, 224434 CrossRef; (b) A. O. Polyakov, A. H. Arkenbout, J. Baas, G. R. Blake, A. Meetsma, A. Caretta, P. H. M. van Loosdrecht and T. T. M. Palstra, Chem. Mater., 2012, 24, 133 CrossRef CAS.
- O. Sato, J. Tao and Y.-Z. Zhang, Angew. Chem., Int. Ed., 2007, 46, 2152 CrossRef CAS PubMed.
- (a) F. Jona and G. Shirane, Ferroelectric Crystals, Pergamon Press, Oxford, 1962 Search PubMed; (b) M. E. Lines and A. M. Glass, Principles and Applications of Ferroelectrics and Related Materials, Clarendon Press, Oxford, UK, 1977 Search PubMed; (c) S. Horiuchi and Y. Tokura, Nat. Mater., 2008, 7, 357 CrossRef CAS PubMed.
- (a) W. Zhang, Y. Cai, R.-G. Xiong, H. Yoshikawa and K. Awaga, Angew. Chem., Int. Ed., 2010, 49, 6608 CrossRef CAS PubMed; (b) W. Zhang, H.-Y. Ye, R. Graf, H. W. Spiess, Y.-F. Yao, R.-Q. Zhu and R.-G. Xiong, J. Am. Chem. Soc., 2013, 135, 5230 CrossRef CAS PubMed; (c) X. Zhang, X.-D. Shao, S.-C. Li, Y. Cai, Y.-F. Yao, R.-G. Xiong and W. Zhang, Chem. Commun., 2015, 51, 4568 RSC; (d) C. Shi, X. Zhang, Y. Cai, Y.-F. Yao and W. Zhang, Angew. Chem., Int. Ed., 2015, 54, 6206 CrossRef CAS PubMed; (e) X.-D. Shao, X. Zhang, C. Shi, Y.-F. Yao and W. Zhang, Adv. Sci., 2015, 2, 1500029 CrossRef; (f) C. Shi, C.-H. Yu and W. Zhang, Angew. Chem., Int. Ed., 2016, 55, 5798 CrossRef CAS PubMed.
- (a) B. Liu, R. Shang, K.-L. Hu, Z.-M. Wang and S. Gao, Inorg. Chem., 2012, 51, 13363 CrossRef CAS PubMed; (b) S. Chen, R. Shang, K. L. Hu, Z.-M. Wang and S. Gao, Inorg. Chem. Front., 2014, 1, 83 RSC; (c) R. Shang, S. Chen, Z.-M. Wang and S. Gao, Chem. – Eur. J., 2014, 20, 15872 CrossRef CAS PubMed; (d) R. Shang, Z.-M. Wang and S. Gao, Angew. Chem., Int. Ed., 2015, 54, 2534 CrossRef CAS PubMed; (e) S. Chen, R. Shang, B.-W. Wang, Z.-M. Wang and S. Gao, Angew. Chem., Int. Ed., 2015, 54, 11093 CrossRef CAS PubMed.
- (a) H.-Y. Ye, W.-Q. Liao, C.-L. Hu, Y. Zhang, Y.-M. You, J.-G. Mao, P.-F. Li and R.-G. Xiong, Adv. Mater., 2016, 28, 2579 CrossRef CAS PubMed; (b) Y. Zhang, W.-Q. Liao, D.-W. Fu, H.-Y. Ye, Z.-N. Chen and R.-G. Xiong, J. Am.Chem. Soc., 2015, 137, 4928 CrossRef CAS PubMed; (c) Y. Zhang, W.-Q. Liao, D.-W. Fu, H.-Y. Ye, C.-M. Liu, Z.-N. Chen and R.-G. Xiong, Adv. Mater., 2015, 27, 3942 CrossRef CAS PubMed.
- (a) C.-M. Ji, Z.-H. Sun, S.-Q. Zhang, T.-L. Chen, P. Zhou and J.-H. Luo, J. Mater. Chem. C, 2014, 2, 567 RSC; (b) W.-J. Xu, S.-L. Chen, Z.-T. Hu, R.-B. Lin, Y.-J. Su, W.-X. Zhang and X.-M. Chen, Dalton Trans., 2016, 45, 4224 RSC.
- J. Mróz and R. Jakubas, Ferroelectrics, 1996, 189, 173 CrossRef.
- (a) M. Mączka, A. Pietraszko, L. Macalik, A. Sieradzki, J. Trzmiel and A. Pikul, Dalton Trans., 2014, 43, 17075 RSC; (b) A. Plutecka and U. Rychlewska, Acta Crystallogr., Sect. C: Cryst. Struct. Commun., 2009, 65, m75 CAS.
- G. Bator and M. Wojtaś, Ferroelectrics, 2003, 295, 77 CAS.
- S. Vasala and M. Karppinen, Prog. Solid State Chem., 2015, 43, 1 CrossRef CAS.
- D. B. Mitzi, J. Chem. Soc., Dalton Trans., 2001, 1 RSC.
- (a) G. Kieslich, S. Sun and A. K. Cheetham, Chem. Sci., 2014, 5, 4712 RSC; (b) G. Kieslich, S. Sun and A. K. Cheetham, Chem. Sci., 2015, 6, 3430 RSC.
Footnote |
| † Electronic supplementary information (ESI) available: IR spectrum, PXRD pattern, TGA spectrum, and dielectric constants measured at different frequencies for these crystal structures. CCDC 1500800–1500805. For ESI and crystallographic data in CIF or other electronic format see DOI: 10.1039/c6qi00347h |
| This journal is © the Partner Organisations 2016 |

