Monomer sequence determination in the living anionic copolymerization of styrene and asymmetric bi-functionalized 1,1-diphenylethylene derivatives†
Wei
Sang‡
,
Hongwei
Ma‡
,
Qiuyun
Wang
,
Xinyu
Hao
,
Yubin
Zheng
,
Yurong
Wang
and
Yang
Li
*
Liaoning Key Laboratory of Polymer Science and Engineering, Department of Polymer Science and Engineering, State Key Laboratory of Fine Chemicals, School of Chemical Engineering, Dalian University of Technology, Dalian 116024, China. E-mail: mahw@dlut.edu.cn; liyang@dlut.edu.cn
First published on 20th October 2015
Abstract
Due to their distinct steric hindrance, 1,1-diphenylethylene (DPE) and its derivatives cannot homopolymerize via living anionic polymerization and thus are advantageous for investigating the sequence structure of the corresponding copolymers. The substitution of functional groups on the benzene rings of DPE derivatives can be used to adjust the reactivity ratios for the copolymerization of styrene and the DPE derivatives. Two types of DPE derivatives, DPE-SiH/OMe and DPE-SiH/NMe2, were designed and prepared in this work. An electron withdrawing substituent and an electron donating substituent are simultaneously present at the para positions of the two phenyl rings of DPE. These derivatives were copolymerized with styrene under Schlenk conditions via living anionic polymerization. The statistical in-chain functionalized copolymers were prepared, and the corresponding average reactivity ratios were 1.42 for DPE-SiH/OMe and 1.79 for DPE-SiH/NMe2. Additionally, a time sampling strategy under high vacuum conditions was used during the copolymerization of the two systems (styrene with DPE-SiH/OMe and styrene with DPE-SiH/NMe2) with [MS]0/[MD]0 = 4. The propagation rate constants and statistical sequence structures were analyzed by 1H NMR spectroscopy, SEC and MALDI-TOF MS, and the average sequential arrangements of the corresponding copolymers were determined. The critical conditions for preparing copolymers with alternating structures were determined and implemented, and the monomer unit ratios were both nearly 1![[thin space (1/6-em)]](https://www.rsc.org/images/entities/char_2009.gif) :
:![[thin space (1/6-em)]](https://www.rsc.org/images/entities/char_2009.gif) 1.
1.
Introduction
Sequence-controlled (or sequence specifically arranged) macromolecules, such as RNA and DNA, have essential roles in life and in conveying information.1–3 For instance, the sequence variations of RNA and DNA underlie the diversity of life forms. Thus, the synthesis of polymers with controlled sequences has become an important topic in the field of polymer science. To achieve this objective, living controlled polymerization (LCP) has attracted considerable attention from polymer chemists. LCP has been used to prepare sequence-controlled polymers because molecular weight can be easily adjusted and controlled, and multiple stepwise feedings maintain the living propagation domain by domain. To control the polymeric sequential arrangement, the LCP system must fulfill certain kinetic requirements for binary copolymerization, e.g., one of the monomers may have a low tendency to homopolymerization, but both monomers highly favor cross-propagation with each other4 (i.e., r1 × r2 ≈ 0). The copolymerization systems of maleic anhydride (MAH)/styrene and maleimide (MI)/styrene are of interest because MAH and MI have strong tendencies toward cross-propagation with styrene. Lutz et al.4,5 used the N-substituted MI/styrene copolymerization system and successfully prepared a series of sequence-controlled multiblock copolymers with ultra-precise statistical and alternating arrangement depending on the time multi-feed strategy (Table 1) via controlled radical chain-growth polymerizations (CRP). In addition, N-substituted MIs can graft various functional groups, which are considered information points, and introduce them into the chains of the corresponding sequence as the unsubstituted MI.4 Thus, the corresponding functional information site can be “written” into the polymer chains accurately and sequentially.6Not only CRP but also many controlled polymerization strategies are good at preparing sequence controllable polymers,7–13 with living anionic polymerization (LAP) being the most important one among them.14,15 Because of its steric hindrance, 1,1-diphenylethene (DPE) has an rD (the reactivity ratio of DPE to other comonomers) of 0 when it undergoes copolymerization with the common monomer via LAP,16e.g., styrene,17–19 butadiene,20 isoprene,21 and methacrylate.22 Thus, DPE and its derivatives have significant advantages in the synthesis of in-chain/chain-end functionalized polymers that have sequence characteristics. First, DPE and its derivatives are hardly able to form dimers or trimers,23 so they are typically used as either initiators or end-capping agents to synthesize the telechelic copolymers15,24 and complex topology copolymers25–35 conveniently and effectively. Furthermore, DPE derivatives can carry functional groups, and there are multiple sites in the DPE structure for polymer functionalization. The sequence-controlled functionalized polymers can be used to store or transfer information.1,2,36 Thus, the amount of information carried by the multi-functional (either symmetric or asymmetric) DPE derivatives should be considerably greater than that carried by monofunctional comonomers. More importantly, the sequential structures of the copolymers can be adjusted by the feed ratio37 and the reactivity ratio of styrene to DPE (rS).18,37,38 In that case, the feed ratio of comonomers can be designed freely. According to its definition,39 the reactivity ratio is determined by the reaction rate constant (kSS/kSD = rS), and k is influenced by the substituent effects.40,41 That is, k can be adjusted by varying the type (electron withdrawing or donating) and quantity of functional groups as well as the substituted positions on the phenyl rings of DPE.42 Therefore, the copolymerization system of styrene and DPE derivatives can easily synthesize polymers with strictly controlled sequences and arrangements. In addition, the design of DPE is the first and most important step in polymeric sequence control.
Many DPE derivatives with multiple or diverse functional groups have been synthesized and used to prepare in-chain functionalized copolymers. There are common features among these derivatives: only one functional substituent38,43–45 or two symmetric functional substituents,46 which only can be thought of as a “doubled single functional group”, are substituted on the DPE. As noted above, DPE derivatives with functional substituent groups play important roles in polymers. Through the introduction of asymmetric multi-functional groups, DPE derivatives with multi-functional substituents based on relatively simple structures can be synthesized, and copolymers with in-chain multi-functional groups can be one-pot synthesized. The advantage of this method is that the sequence structure of binary copolymers synthesized from bi-functionalized DPE derivatives is controlled more easily and distinctly than that of the ternary copolymers synthesized from monofunctionalized DPE derivatives. Furthermore, DPE derivatives with precisely designed reactivity ratios can be obtained42 by varying the types of functional substituents and their position on benzyl rings using the Hammett equation.47
Two types of asymmetric bi-functionalized DPE derivatives, DPE-SiH/OMe and DPE-SiH/NMe2, were designed and synthesized. The same electron withdrawing substituent (dimethylsilane groups) and different electron donating substituents (methoxyl and dimethylamino group) were simultaneously substituted at the para positions of the DPE's two phenyl rings. To prepare in-chain functionalized copolymers, these DPE derivatives were copolymerized with styrene via LAP. The influence of the monomer feed ratios and reactivity ratio on the sequence structures in the corresponding copolymer chains was investigated. Additionally, the time sampling strategy under high vacuum conditions was used to investigate the precise sequential arrangements of the corresponding copolymers. In this work, sequence determination in the copolymerization of styrene and DPE derivatives was established, which can be used to synthesize and characterize the reactivity characteristic of functionalized copolymers via LAP.
Experimental
Materials
All reagents were purchased from Sinopharm Chemical Reagent Company (Shanghai, China) and used as received unless otherwise stated.Tetrahydrofuran (THF) was dried by reflux over a Na-benzophenone complex under an argon atmosphere and then distilled. Dimethylchlorosilane (Aldrich, 98.0%) was dried by reflux over CaH2 under an argon atmosphere and then distilled. Methyltriphenylphosphonium bromide (Energy Chemical, 98.0%), potassium tert-butoxide (Energy Chemical, 98.0%), magnesium turnings for Grignard's (J&K, 99.8%), 4-bromobenzoyl chloride (Energy Chemical, 98.0%), anisole (Energy Chemical, 99.0%), 4-bromo-N,N-dimethylaniline (Energy Chemical, 98.0%) and 4-bromobenzonitrile (Energy Chemical, 98.0%) were used as received.
The process used to purify styrene and benzene was the same as that in the literature.45sec-BuLi was prepared using 2-chlorobutane and lithium metal in benzene under high vacuum conditions. The reaction procedures and apparatus used were the same as in the literature.45 The product sec-BuLi was 0.38 mol L−1, as determined by double titration.
Methods
1H NMR (5 wt%, CDCl3) spectra and 13C NMR spectra were recorded on a Bruker Avance II 400M NMR spectrometer with tetramethylsilane (TMS) as the internal standard. Size exclusion chromatographic (SEC) analyses of the copolymers were performed on a Waters HPLC component system (2414 refractive index detector) at a flow rate of 1.0 mL min−1 in THF at 30 °C after calibration using polystyrene standard polymers. The glass transition temperatures (Tg) of the polymers were measured under a nitrogen atmosphere using a TA Instruments Universal Analysis 2000 differential scanning calorimeter (DSC) from 0 to 200 °C at a heating rate of 10.0 °C min−1. The sample sizes were 5 mg, and the samples were investigated under a nitrogen atmosphere. MALDI-TOF MS analysis was carried out on a Waters MALDI micro MX mass spectrometer, linear mode, DCTB, viz., 2-[(2E)-3-(4-tert-butylphenyl)-2-methylprop-2-enylidene]malonitrile (Aldrich, ≥99.0% (HPLC) (Fluka)), sodium trifluoroacetate (Aldrich, ≥98.0% (HPLC) (Sigma)), and the details of the sample preparation are provided in previous studies.48Synthesis of the monomers of 1-(4-methyloxyphenyl)-1′-(4-dimethylsilanephenyl)ethylene (DPE-SiH/OMe) and 1-(4-dimethylamino)-1′-(4-dimethylsilanephenyl)ethylene (DPE-SiH/NMe2)
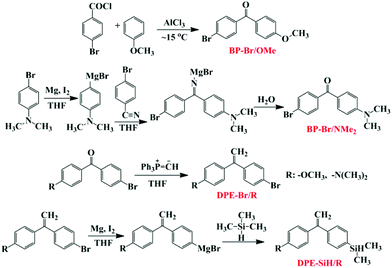
The experimental operations of the synthesis precursor have been reported in the literature.49,50 DPE-SiH/NMe2 were prepared in a similar manner to DPE-SiH/OMe.51 The detailed synthetic process for DPE-SiH/OMe and DPE-SiH/NMe2 is shown in the ESI,† and the synthetic route for DPE-SiH/OMe and DPE-SiH/NMe2 is shown in Scheme 1. The purities of the products were all greater than 99.5%, as identified by HPLC, and can be used for anionic polymerization.Synthesis of the copolymers of styrene and DPE-SiH/R (P(St-co-DPE-SiH/OMe) and P(St-co-DPE-SiH/NMe2)) via anionic polymerization
Copolymerization of styrene and DPE-SiH/R was carried out using sec-BuLi as the initiator in benzene under Schlenk conditions. O1 in Table 2 is taken as an example for illustration: 30 mL of benzene and 0.59 g (0.0022 mol) of DPE-SiH/OMe were added to the Schlenk ampoule under an argon atmosphere, and then, 1.9 mL (0.38 mol L−1, 0.00072 mol) of sec-BuLi was added. The characteristic red wine color of the Si–H group substituted 1,1-diphenylalkyllithium anion appeared immediately. The solution was stirred for 15 min to ensure that the corresponding 1,1-diphenylalkyllithium was initiated sufficiently. Then, 2.5 mL (0.022 mol) of styrene was added and reacted at 25 °C for 24 h. The products were precipitated with excess methanol and subsequently dissolved in toluene, which was repeated twice until the residual DPE-SiH/OMe monomer was completely removed. If the DPE derivative was fed excessively, the unreacted DPE derivative monomer was removed by flash column chromatography (hexane/ethyl acetate 9![[thin space (1/6-em)]](https://www.rsc.org/images/entities/char_2009.gif) :
:![[thin space (1/6-em)]](https://www.rsc.org/images/entities/char_2009.gif) 1 v/v). Then, the product was flushed with pure ethyl acetate, precipitated with excess methanol and dried to a constant weight in a vacuum oven.
1 v/v). Then, the product was flushed with pure ethyl acetate, precipitated with excess methanol and dried to a constant weight in a vacuum oven.
| No.a | [MS]0/[MD]0![[thin space (1/6-em)]](https://www.rsc.org/images/entities/char_2009.gif) b b |
N
S/ND![[thin space (1/6-em)]](https://www.rsc.org/images/entities/char_2009.gif) c c |
M
n![[thin space (1/6-em)]](https://www.rsc.org/images/entities/char_2009.gif) d (kg mol−1) d (kg mol−1) |
PDId |
N
D![[thin space (1/6-em)]](https://www.rsc.org/images/entities/char_2009.gif) e e |
T
g![[thin space (1/6-em)]](https://www.rsc.org/images/entities/char_2009.gif) f (°C) f (°C) |
Conv.DPE![[thin space (1/6-em)]](https://www.rsc.org/images/entities/char_2009.gif) g (%) g (%) |
E
DPE![[thin space (1/6-em)]](https://www.rsc.org/images/entities/char_2009.gif) h (%) h (%) |
r
S![[thin space (1/6-em)]](https://www.rsc.org/images/entities/char_2009.gif) i i |
|---|---|---|---|---|---|---|---|---|---|
| a P(St-co-DPE-SiH/OMe) (O1–O7) were synthesized at 25 °C for 24 h, [MS]0/[I] was designed to be 30, and styrene monomer was consumed completely. b The monomer molar feed ratio of styrene and DPE-SiH/OMe. c The ratio of the two monomer units in the final copolymer, calculated from the 1H NMR spectra of the copolymers using eqn (1). d Determined by SEC. e The average number of DPE in each chain, calculated from the 1H NMR spectra using eqn (3). f Glass transition temperature, characterized by DSC. g The conversion ratio of DPE-SiH/OMe, calculated using eqn (4). h The end-capped ratio of DPE-SiH/OMe, calculated using eqn (5). i The reactivity ratio of styrene to DPE-SiH/OMe, calculated from the 1H NMR spectra of the copolymers using eqn (8). All above equations were listed in Table 1S in the ESI. | |||||||||
| O1 | 10.0 | 10.6 | 4.6 | 1.30 | 3.3 | 100 | 94.3 | 44.3 | 1.74 |
| O2 | 8.0 | 8.6 | 4.8 | 1.29 | 4.1 | 104 | 93.0 | 45.1 | 1.72 |
| O3 | 6.0 | 6.3 | 5.4 | 1.30 | 5.8 | 109 | 95.2 | 67.3 | 1.41 |
| O4 | 4.0 | 4.2 | 5.9 | 1.24 | 8.3 | 121 | 95.2 | >99.9 | 1.17 |
| O5 | 3.0 | 3.2 | 6.2 | 1.18 | 10.2 | 125 | 93.8 | >99.9 | 1.06 |
| O6 | 2.0 | 2.2 | 6.9 | 1.16 | 13.7 | 135 | 90.9 | >99.9 | N/A |
| O7 | 1.0 | 1.5 | 7.7 | 1.12 | 18.0 | 146 | 66.7 | >99.9 | N/A |
Sequence determination for the copolymers of styrene and DPE-SiH/R by time sampling
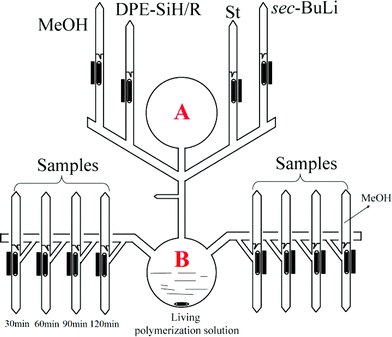
Copolymerization of styrene and DPE-SiH/R was carried out under high vacuum conditions. The apparatus is shown in Fig. 1. I in Table 4 is taken as an example for illustration: it was equipped and evacuated for 4 h to high vacuum, and then, 150 mL of dry benzene was distilled into A. The apparatus was then flame sealed from the vacuum line. DPE-SiH/OMe (5.88 g, 0.022 mol) was dissolved, and 7.5 mL of sec-BuLi (0.38 mol L−1, 0.0029 mol) was added through break seals. The colorless transparent solution immediately turned a red wine color. After 15 min, the apparatus was turned over. Styrene (10.1 mL, 0.088 mol) was added and stirred strongly in B. After 3 min, the solution was evenly poured into 12 ampoules, and approximately 10 mL of the solution was retained in B. These ampoules were immediately flame sealed from the apparatus. These reactions were allowed to react at 25 °C and were terminated with methanol every 30 min. Then, the products were precipitated in methanol. The residual monomers of DPE-SiH/OMe were removed by flash column chromatography (hexane/ethyl acetate 9![[thin space (1/6-em)]](https://www.rsc.org/images/entities/char_2009.gif) :
:![[thin space (1/6-em)]](https://www.rsc.org/images/entities/char_2009.gif) 1 v/v). Then, the product was flushed with ethyl acetate, precipitated with excess methanol and dried in a vacuum oven to a constant weight.
1 v/v). Then, the product was flushed with ethyl acetate, precipitated with excess methanol and dried in a vacuum oven to a constant weight.
| No.a | [MS]0/[MD]0![[thin space (1/6-em)]](https://www.rsc.org/images/entities/char_2009.gif) b b |
N
S/ND![[thin space (1/6-em)]](https://www.rsc.org/images/entities/char_2009.gif) c c |
M
n![[thin space (1/6-em)]](https://www.rsc.org/images/entities/char_2009.gif) d (kg mol−1) d (kg mol−1) |
PDId |
N
D![[thin space (1/6-em)]](https://www.rsc.org/images/entities/char_2009.gif) e e |
T
g![[thin space (1/6-em)]](https://www.rsc.org/images/entities/char_2009.gif) f (°C) f (°C) |
Conv.DPE![[thin space (1/6-em)]](https://www.rsc.org/images/entities/char_2009.gif) g (%) g (%) |
E
DPE![[thin space (1/6-em)]](https://www.rsc.org/images/entities/char_2009.gif) h (%) h (%) |
r
S![[thin space (1/6-em)]](https://www.rsc.org/images/entities/char_2009.gif) i i |
|---|---|---|---|---|---|---|---|---|---|
| a P(St-co-DPE-SiH/NMe2) (N1–N7) were synthesized at 25 °C for 24 h, [MS]0/[I] was designed to be 30, and styrene monomer was consumed completely. b The monomer molar feed ratio of styrene and DPE-SiH/NMe2. c The ratio of the two monomer units in the final copolymer, calculated from the 1H NMR spectra of the copolymers using eqn (2). d Determined by SEC. e The average number of DPE in each chain, calculated from the 1H NMR spectra using eqn (3). f Glass transition temperature, characterized by DSC. g The conversion ratio of DPE-SiH/NMe2, calculated using eqn (4). h The end-capped ratio of DPE-SiH/NMe2 could not be calculated from the corresponding 1H NMR spectra. i The reactivity ratio of styrene to DPE-SiH/NMe2, calculated from the 1H NMR spectra of the copolymers using eqn (8). All above equations were listed in Table 1S in the ESI. | |||||||||
| N1 | 10.0 | 11.1 | 4.5 | 1.32 | 3.1 | 102 | 90.1 | N/A | 2.06 |
| N2 | 8.0 | 9.0 | 4.7 | 1.32 | 3.8 | 107 | 88.9 | N/A | 2.00 |
| N3 | 6.0 | 6.6 | 5.4 | 1.30 | 5.5 | 113 | 90.9 | N/A | 1.68 |
| N4 | 4.0 | 4.4 | 5.9 | 1.22 | 7.9 | 127 | 90.9 | N/A | 1.40 |
| N5 | 3.0 | 3.5 | 6.5 | 1.17 | 10.0 | 133 | 85.7 | N/A | N/A |
| N6 | 2.0 | 2.5 | 7.5 | 1.13 | 13.8 | 145 | 80.0 | N/A | N/A |
| N7 | 1.0 | 1.8 | 7.9 | 1.10 | 16.8 | 157 | 55.6 | N/A | N/A |
| Samplea | Time (min) |
M
n![[thin space (1/6-em)]](https://www.rsc.org/images/entities/char_2009.gif) b (kg mol−1) b (kg mol−1) |
PDIb |
N
S/ND![[thin space (1/6-em)]](https://www.rsc.org/images/entities/char_2009.gif) c c |
N
S![[thin space (1/6-em)]](https://www.rsc.org/images/entities/char_2009.gif) d d |
Conv.St![[thin space (1/6-em)]](https://www.rsc.org/images/entities/char_2009.gif) e (%) e (%) |
N
D![[thin space (1/6-em)]](https://www.rsc.org/images/entities/char_2009.gif) f f |
Conv.DPE![[thin space (1/6-em)]](https://www.rsc.org/images/entities/char_2009.gif) g (%) g (%) |
E
DPE![[thin space (1/6-em)]](https://www.rsc.org/images/entities/char_2009.gif) h (%) h (%) |
|---|---|---|---|---|---|---|---|---|---|
| a P(St-co-DPE-SiH/OMe) (I), P(St-co-DPE-SiH/NMe2) (II) are copolymerized at 25 °C, the monomer molar feed ratio [MS]0/[MD]0 = 4, and [MS]0/[I] is set to 30. b Determined by SEC. c The ratio of the two monomer units in the final copolymer, calculated from the 1H NMR spectra of the copolymers using eqn (1) and (2). d The average number of styrene units in each chain is calculated from the 1H NMR spectra. e The relative conversion of styrene. f The average number of DPE in each chain is calculated from the 1H NMR spectra using eqn (3). g The relative conversion of DPE. h The end-capped ratio of DPE-SiH/OMe is calculated using eqn (5). The end-capped ratio of DPE-SiH/NMe2 could not be calculated from the corresponding 1H NMR spectra. All above equations were listed in Table 1S in the ESI. | |||||||||
| I | 30 | 2.9 | 1.10 | 4.5 | 17.4 | 48.5 | 3.9 | 43.3 | 96.1 |
| 60 | 4.4 | 1.13 | 4.4 | 26.3 | 73.3 | 6.0 | 66.7 | 92.3 | |
| 90 | 5.0 | 1.15 | 4.4 | 29.9 | 83.3 | 6.8 | 75.6 | 96.8 | |
| 120 | 5.3 | 1.15 | 4.3 | 31.6 | 88.0 | 7.3 | 81.1 | 94.1 | |
| 180 | 5.7 | 1.16 | 4.2 | 33.6 | 93.6 | 8.0 | 88.9 | >99.9 | |
| 300 | 6.0 | 1.18 | 4.2 | 35.5 | 98.9 | 8.4 | 93.3 | 99.3 | |
| 420 | 6.1 | 1.18 | 4.2 | 35.9 | 100.0 | 8.6 | 95.6 | >99.9 | |
| II | 30 | 2.1 | 1.19 | 4.9 | 12.7 | 36.2 | 2.6 | 29.5 | N/A |
| 60 | 2.8 | 1.23 | 4.6 | 16.6 | 47.3 | 3.6 | 40.9 | N/A | |
| 90 | 3.5 | 1.24 | 4.5 | 20.7 | 59.0 | 4.6 | 52.3 | N/A | |
| 120 | 4.2 | 1.24 | 4.4 | 24.7 | 70.4 | 5.6 | 63.6 | N/A | |
| 180 | 4.9 | 1.25 | 4.4 | 28.8 | 82.1 | 6.6 | 75.0 | N/A | |
| 300 | 5.9 | 1.25 | 4.3 | 34.5 | 98.3 | 8.0 | 90.9 | N/A | |
| 420 | 6.0 | 1.25 | 4.3 | 35.1 | 100.0 | 8.2 | 93.2 | N/A | |
Synthesis of alternating copolymers of styrene and DPE-SiH/R (P(St-alt-DPE-SiH/OMe) and P(St-alt-DPE-SiH/NMe2))
Under Schlenk conditions, the monomer molar feed ratios shown in Table 6 were used. The reaction and post-treatment procedures are the same as those used to synthesize the copolymers of styrene and DPE-SiH/R.| Sample |
r
S![[thin space (1/6-em)]](https://www.rsc.org/images/entities/char_2009.gif) a a |
[I]0 (mol L−1) | k SS (L1/2 mol−1/2 min−1) | k SD (L−1/2 mol−1/2 min−1) | k DS (L−1/2 mol−1/2 min−1) |
|---|---|---|---|---|---|
| a The reactivity ratio of styrene to the corresponding DPE derivatives, calculated from the 1H NMR spectra of the copolymers using eqn (8). | |||||
| I | 1.17 | 0.0154 | 0.5536 | 0.4732 | 0.0210 |
| II | 1.29 | 0.0156 | 0.3344 | 0.2592 | 0.0020 |
| No.a | DPE-SiH/R | [MS]0/[MD]0![[thin space (1/6-em)]](https://www.rsc.org/images/entities/char_2009.gif) b b |
N
S/ND![[thin space (1/6-em)]](https://www.rsc.org/images/entities/char_2009.gif) c c |
M
n![[thin space (1/6-em)]](https://www.rsc.org/images/entities/char_2009.gif) d (kg mol−1) d (kg mol−1) |
PDId |
N
D![[thin space (1/6-em)]](https://www.rsc.org/images/entities/char_2009.gif) e e |
T
g![[thin space (1/6-em)]](https://www.rsc.org/images/entities/char_2009.gif) f (°C) f (°C) |
T
thg![[thin space (1/6-em)]](https://www.rsc.org/images/entities/char_2009.gif) g (°C) g (°C) |
|---|---|---|---|---|---|---|---|---|
| a Polystyrene (PS), P(St-alt-DPE-SiH/OMe) (AO1–AO3), and P(St-alt-DPE-SiH/NMe2) (AN1–AN3) were polymerized at 25 °C for 24 h, [MS]0/[I] of PS was set to 50, any other [MS]0/[I] was set to 15, and the styrene monomer was consumed completely. b The monomer molar feed ratio of styrene and the corresponding DPE derivative. c The ratio of the two monomer units in the final copolymer, calculated from the 1H NMR spectra of the copolymers using eqn (1) and (2). d Determined by SEC. e The average number of DPE in each chain, calculated from the 1H NMR spectra using eqn (3). f The glass transition temperature, characterized by DSC. g The theoretical value of the glass transition temperature for homopolymers of the corresponding DPE derivatives, calculated using eqn (16). All above equations were listed in Table 1S in the ESI. | ||||||||
| PS | — | — | — | 5.1 | 1.04 | — | 86 | — |
| AO1 | OMe | 0.50 | 1.11 | 4.7 | 1.10 | 12.0 | 141 | 199 |
| AO2 | OMe | 0.33 | 1.04 | 4.4 | 1.11 | 11.5 | 139 | 191 |
| AO3 | OMe | 0.25 | 1.03 | 4.4 | 1.11 | 11.5 | 138 | 187 |
| AN1 | NMe2 | 0.50 | 1.24 | 4.3 | 1.10 | 10.3 | 149 | 237 |
| AN2 | NMe2 | 0.33 | 1.14 | 3.8 | 1.11 | 9.3 | 148 | 230 |
| AN3 | NMe2 | 0.25 | 1.06 | 4.0 | 1.09 | 10.0 | 149 | 221 |
Results and discussion
Synthesis of P(St-co-DPE-SiH/OMe) and P(St-co-DPE-SiH/NMe2)
DPE derivatives that possess abundant functional groups are often used to copolymerize via LAP, e.g., the DPE derivatives are substituted by dimethylsilane (Si–H) groups,52–54 dimethylamine (NMe2) groups,37,38,46,55 and methoxyl (OMe) groups.42 In addition, they are widely used for the synthesis of functionalized polymers.45,53,56–58 However, there are few investigations into the accurate sequential arrangement for these DPE derivative units in chains.The reactivity ratio is an essential parameter for the calculation of the copolymer composition and is also used to intuitively estimate the copolymerization tendency of two monomers according to its value. The hydrogen atoms in the two phenyl rings of DPE can be substituted by one or more functional groups; thus, the rS of DPE derivatives can be changed by altering the substituent types. Furthermore, the copolymer structures may be controlled by changing the rS of the DPE derivatives. For DPE derivative monomers, an electron donating substituent increases the electron density on the double bond and makes an attack by the carbanionic chain-end less likely, and the effect is the opposite for an electron withdrawing substituent. DPE-NMe2 (1-(4-dimethylaminophenyl)-1-phenylethylene, rS = 5.6),38 DPE-(NMe2)2 (1,1-bis(4-dimethylaminophenyl)ethylene, rS = 53.7),37 and DPE-(OMe)2 (1,1-bis(4-methoxylphenyl)ethylene, kSD = 0.06 L1/2 mol−1/2 min−1)42 reduced the likelihood of introduction into the polystyrene main chains due to the strong electron donating substituent and large rS, although corresponding functional groups play significant roles in UV absorption.59 However, on the poly(DPE)lithium (propagating DPE chain end), a strong electron withdrawing substituent (e.g., cyano group, –CN) may activate the DPE monomer but will deactivate the DPE propagating species so that kDS decreased obviously and only oligomers are formed after 24 h.60,61 Therefore, a weak electron withdrawing substituent, the Si–H group, is introduced into one of the DPE phenyl rings to reduce the reactivity ratio and increase the DPE derivative contents in the corresponding copolymers. Furthermore, according to the general anionic functionalization method (GFM), which was proposed by Quirk et al.,39 Si–H functionalized polymers are sufficiently active in the post-functionalization to efficiently and conveniently link with a variety of functional moieties.45,53 Therefore, the sequence determination in the copolymerization of styrene and DPE-SiH/OMe or DPE-SiH/NMe2 is very important for subsequent investigations into the functionalization.
To investigate the possibility of introducing functional groups quantitatively into the polymer backbone – so-called in-chain functionalization – the copolymerization of styrene and functionalized DPE derivatives with various comonomer feed ratios was carried out. These copolymers were collected and characterized by SEC and 1H NMR, and the results are presented in Tables 2 and 3.
In the SEC curves of the copolymers (Fig. 2), single narrow peaks were observed in each copolymer. These peaks indicate that all of the copolymerizations in the styrene and DPE derivative system, which are initiated by alkyllithium in hydrocarbon solvents, exhibited typical characteristics of living anionic chain propagation. Furthermore, comparing O1–O7 (Table 2) and N1–N7 (Table 3), in the case of approximate molecular weights, the molecular weight distribution is narrowed after the amount of DPE derivative increased in the corresponding polymers. According to a previous study,18 the crossover propagation must occur predominantly if the reaction rate constant k22 is sufficiently small; k11, k12 and k21 are quite different. The PDIs likely become wider with increasing styrene feed, because there were two living species generated during the propagation, PDIs became wider with more styrene mole fraction due to the frequent crossover of living species. In our previous work,45 when excess DPE derivatives were fed and alternating chain propagation only existed, narrow PDIs were observed.
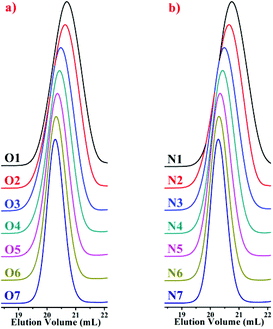 | ||
| Fig. 2 SEC curves of the copolymers: (a) P(St-co-DPE-SiH/OMe), O1–O7 in Table 2; (b) P(St-co-DPE-SiH/NMe2), N1–N7 in Table 3. | ||
The 1H NMR spectra of copolymers O1–O7 in Table 2 and N1–N7 in Table 3 are compared in Fig. 3, and the corresponding attributions are also shown. The characteristic vinyl  peak (δ 5.3 ppm) of the DPE derivative monomer disappeared completely in the copolymers. δ 3.6–3.8 ppm can be attributed to the protons of the methoxy groups
  in copolymers O1–O7, and δ 2.7–3.0 ppm are the protons of the dimethylamino groups
  in copolymers N1–N7. The peaks of δ 0.2–0.4 ppm and δ 4.3–4.5 ppm can represent protons of the silylmethyl
  and silylhydride
  in dimethylsilane groups, respectively. The common characteristic peaks in the 1H NMR spectra of these products prove that these products are the copolymers of styrene and the corresponding DPE derivatives.
 | ||
| Fig. 3 1H NMR spectra (in CDCl3) of the copolymers: (a) P(St-co-DPE-SiH/OMe), O1–O7 in Table 2; (b) P(St-co-DPE-SiH/NMe2), N1–N7 in Table 3. | ||
The ratio of the two monomer units in the final copolymer, NS/ND, was determined using 1H NMR as well as eqn (1) for P(St-co-DPE-SiH/OMe) and eqn (2) for P(St-co-DPE-SiH/NMe2) in Table 1S in the ESI.† The average number of DPE derivative units in each polymer chain was calculated using eqn (3) in Table 1S.† The value of the conversion rate (Conv.DPE) for the DPE derivative can be obtained from 1H NMR using eqn (4) in Table 1S,† and the value of the end-capped ratio (EDPE) for DPE-SiH/OMe can be obtained from δ 2.87 ppm in the corresponding 1H NMR spectra using eqn (5) in Table 1S.† The end-capped ratio of DPE-SiH/NMe2 cannot be calculated from the corresponding 1H NMR spectra due to the interference of the dimethylamino groups in the range of δ 2.7–3.0 ppm.
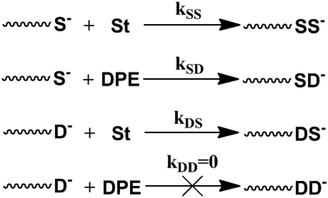
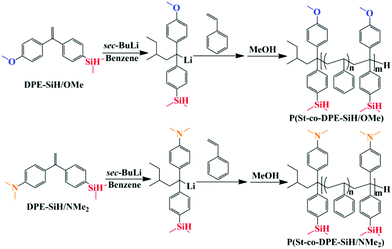
The typical copolymerization propagation of styrene and DPE in LAP could be described by these four equations38 and is shown in Scheme 2. The copolymeric procedure of styrene and DPE-SiH/R is shown in Scheme 3, although the resulting copolymers are drawn with terminal DPE units, this is not the situation in all cases – see Tables 2 and 3.
Here, the styrene monomer is consumed completely, and the reaction rate constant, kDD, is zero due to steric hindrance,18,38 unless under extreme reaction conditions, i.e., an excess feed ratio of DPE ([MD]/[I] = 11) and extended reaction times (8–24 h) in chain initiation.62 However, the oligomer of DPE is not observed in chain propagation under more DPE feed ratio conditions.23 Therefore, the monomer reactivity ratio of DPE to styrene is 0 (rD = kDD/kDS = 0).38
The residual concentration of the DPE derivative monomer ([MD]) can be calculated from the 1H NMR spectrum of each copolymer using eqn (6) in Table 1S in the ESI.† In addition, for [MS], eqn (7) in Table 1S† was used. Generally, the calculation of reactivity ratios is carried out at a low monomer conversion, e.g., 10%. However, when DPE was used as a comonomer, kDD = 0, the calculation was different from typical conditions. Yuki et al.18 deduced eqn (8) in Table 1S† as an empirical formula for the calculation of the reactivity ratio, which is applicable to [MS] = 0 and [MD] ≠ 0 when the reactions have gone to completion.15,18 According to eqn (8), a graphical method for the simplified calculation of rS was deduced and is shown in the ESI.†
The reactivity ratio of styrene to the DPE derivatives, rS, generally obeyed the Hammett relationship and is described by eqn (9) in Table 1S in the ESI.†38 Here, rS0 is the reactivity ratio of the copolymerization for styrene with 1,1-diphenylethylene and rS0 = 0.45 in benzene.63 The value of σ for the para-dimethylamino substituent is −0.50,37,38σ for the para-methoxy substituent is −0.27,64 and σ for the para-dimethylsilane substituent is +0.04,64 and ρ = +1.837,38 is substituted into eqn (9). The theoretical values of rthS–O = 1.17 and rthS–N = 3.03 are obtained.
The two monomer conversions and end-capped efficiency of DPE derivatives are important indices for copolymers to investigate the reactivity characteristics of the copolymerization. In other studies,31,32,56 it has been shown that the end-capping efficiency of DPE can reach 100% when there is a sufficient excess of DPE. However, the total conversion of the DPE monomers in this study does not reach 100% and needs to be discussed for two general cases: 1. in the case where the monomer feed ratio of DPE is in molar excess of styrene, the conversion of DPE cannot reach 100%. DPE cannot homopolymerise and even a perfect alternating copolymer cannot consume an excess of DPE. 2. In the case where the mole ratio of styrene is in excess of DPE, the conversion of DPE is influenced by the reactivity ratio, rS: if rS ≤ 1, the RD (the chain propagation rate for DPE) was higher than RS and the conversion can theoretically reach 100%; if rS > 1, the RD was lower than RS, which led to the existence of residual DPE monomers in the solution while styrene was consumed completely, and the total conversion of DPE cannot reach 100%. In previous reports, with the increase of rS, the conversion of DPE decreased, e.g., DPE conversion = 35–48% for DPE-NMe2 (rS = 5.6),38 and conversion = 8–10% for DPE-(NMe2)2 (rS = 53.7).37 Therefore, in this case, the actual amount of DPE participating in the polymerization cannot be equal to its corresponding feed. Although chain propagations are all initiated by 1,1-diphenylalkyllithiums, the values of the reactivity ratios fluctuate within a small range. Thus, the arithmetic average values of the monomer reactivity ratio for styrene to DPE-SiH/OMe (rS–O) and for styrene to DPE-SiH/NMe2 (rS–N) are 1.42 and 1.79, respectively. When two functional groups were substituted (e.g., SiH/OMe and SiH/NMe2) in different phenyls of DPE units, one of the phenyl rings was distorted by an angle of 37° from co-planarity with the other phenyl ring and the diphenylmethyl carbon.58,65 Therefore, the total substituent constant σ of bi-substituted DPE derivatives is not strictly equal to σSiH + σOMe or σSiH + σNMe2 in theory, and these values are slightly different from the theoretical values of rthS–O = 1.17 and rthS–N = 3.03.
According to previous studies,37 the amount of DPE and its derivatives in the copolymers can affect the glass transition temperatures (Tg) of the copolymers. Thus, the thermal properties of these copolymers were investigated using differential scanning calorimetry (DSC). The relevant data are shown in Tables 2 and 3, and the corresponding DSC curves are shown in Fig. 4S in the ESI.† Only one glass transition temperature could be observed for each copolymer. The molar feed ratio of styrene to initiator ([MS]0/[I]) was designated as 30 in O1–O7 and N1–N7, and styrene monomers were consumed completely when the copolymerization finished. Therefore, the thermal properties of the copolymers are influenced by the relative amount of DPE units. To quantify this influence, the Tg values for the copolymers are plotted as a function of the weight percent of DPE units in them (DPE derivative wt%) in Fig. 4. The correlations between Tg and the compositions of P(St-co-DPE-SiH/OMe) and P(St-co-DPE-SiH/NMe2) can be fitted using eqn (i) and (ii), and R2 > 99.8%:
| Tg,O(°C) = 105(DPEO wt%) + 80 | (i) |
| Tg,N(°C) = 136(DPEN wt%) + 75 | (ii) |
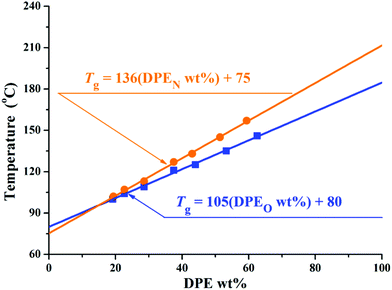 | ||
| Fig. 4 Graph showing the correlation between Tg and DPER wt% for copolymers of DPE-SiH/R and styrene. | ||
The slopes of eqn (i) and (ii) may be different because of the variation in the molecular weights and sequential arrangements in different segments of chains15,66 and, perhaps, the relative contributions of the two different DPE monomers to the intramolecular forces. Furthermore, the intercepts of eqn (i) and (ii) were less than 100 in the literature,15,66,67 which may also result from the smaller molecular weight, particularly in the number of styrene units. The Tg of polystyrene (Mn = 3000 and Mn = 3500) are estimated using eqn (10)38 of Table 1S in the ESI:†Tg,PS3000 = 72 °C and Tg,PS3500 = 76 °C are obtained, which correspond well with eqn (i) and (ii) when “DPE derivative wt% = 0”.
Although homopolymers of DPE-SiH/OMe and DPE-SiH/NMe2 do not exist, their glass transition temperature could be extrapolated from eqn (i) and (ii) with “DPE derivative wt% = 100”. In addition, the extrapolation values of the glass transition temperature for homopolymers of DPE-SiH/OMe and for homopolymers of DPE-SiH/NMe2 are Texg-O = 185 °C and Texg-N = 211 °C, respectively. Texg-O and Texg-N are slightly lower than the previously reported extrapolated values of the glass transition temperature for homopolymers of 1,1-diphenylethene of 209 °C,15 219 °C,66 and 226 °C.67 The differences might result from the lower molecular weights in this work.
As discussed above, two types of DPE derivatives with asymmetric bi-functional groups were copolymerized with styrene, and a series of copolymers were obtained successfully. The copolymerization characteristics and reactivity ratios rS were investigated. By studying the relationship between the molar feed ratio and the molar ratio in the copolymers of the two monomers, the corresponding linear empirical formulas were obtained. It was easy and convenient to control the functional group content in the copolymer by adjusting the molecular weight and molar feed ratios of the styrene and the corresponding DPE derivatives. Based on these factors, the sequential arrangements were further investigated.
Sequence determination in the copolymerization of styrene and DPE derivatives
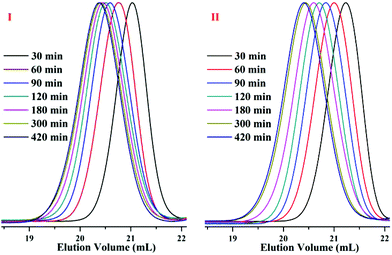
By controlling the functionalized monomer sequence, the functional groups can be introduced quantitatively at relatively precise positions in the copolymers. Thus, artificial and sequence-controlled functionalized polymers will provide functions similar to biological molecules in nature, such as organocatalysis, selective transport, signal transduction and data storage,1,3,68 and the polymers can bring excellent performances and expand applications to in-chain functionalized copolymers. Lutz et al.5,69,70 performed many studies on sequence-controlled polymers in LCP. Although it has been rarely investigated, with few existing studies on sequence determination in chain propagation,15,45,60 LAP has the intrinsic advantage that it can introduce functional groups quantitatively at relatively accurate positions in polymers and precisely control the polymer structure (see Fig. 5). Furthermore, the progress of LAP can be detected conveniently and accurately by various characterization methods.15,19,48,71 Thus, based on the previous discussions, it is necessary to investigate the in-chain sequential arrangements of the two monomers, to determine the values of “m” and “n” in Fig. 5, to obtain the sequence structure of the corresponding copolymers, and to establish a method to determine the sequential arrangements in LAP.Time sampling was utilized and performed under high vacuum conditions to determine the average sequential arrangements of the copolymers. In a short time interval, time sampling is equivalent to taking a differential of the copolymerization. The reaction equipment is shown in Fig. 1. The copolymerizations of styrene with DPE-SiH/OMe (I) and styrene with DPE-SiH/NMe2 (II) were the research objects. According to the data in Tables 2 and 3, the molar feed ratios were set to 4 because the conversions and end-capped ratios of these two types of DPE derivatives are the largest and the reactivity ratios are nearly the smallest in this case. [MS]0/[I] was set to 30, and all samples were taken every 30 min. The total reaction times were 7 h. The composition of each monomer in the copolymers was investigated using 1H NMR. The results are shown in Table 4, and the SEC curves are shown in Fig. 6 (the full results are shown in Table 2S in the ESI†).
The chain propagations finished in 6 h, but the DPE derivative monomers did not react completely. The conversions for two types of DPE derivatives did not reach 100%, even if the reaction time was prolonged to 24 h (Tables 2 and 3), for the reasons mentioned previously.
The kinetic equations of the corresponding copolymerization could be deduced from the results in Table 4. Copolymerization I was taken as an example for the kinetic study. The consumption rates of styrene and DPE-SiH/OMe monomers were obtained using eqn (11) and (12)39 in Table 1S in the ESI.† In these equations, the apparent rate constant is shown to be “1/2” order with respect to the “living species concentration” because poly(styryl)lithium ([S−]) and poly(DPE-SiH/OMe)lithium ([D−]) predominantly formed dimers in hydrocarbon solution.39,63 [S−] and [D−] are instantaneous values following the corresponding time in the copolymerization of styrene and DPE, which cannot be obtained directly from Table 4. However, [D−]/[I] is equal to the value of the end-capped ratio (EDPE) of DPE-SiH/OMe in each copolymer, which can be calculated from the corresponding 1H NMR spectrum of each sample using eqn (5) in Table 1S,† and is shown in Table 4. EDPE of DPE-SiH/OMe is approximately 95% after 120 min when the propagation reaction is initiated. Thus, [D−]/[I] can be used as a constant and substituted into the equations for simplified calculation. Subsequently, [S−] was calculated from eqn (13) of Table 1S in the ESI,† where [I] is the concentration of the initiator, which remains constant in LAP.
The linear apparent kinetic curves for the propagation of copolymerizations I and II were obtained from ln([M]0/[M]) vs. time (in Fig. 7). The apparent rate constants of I, kIS and kID were obtained from the slopes of the corresponding straight lines in Fig. 7I, as well as the apparent rate constants of II, kIIS and kIID were obtained from the slopes of the corresponding straight lines in Fig. 7II using eqn (14) and (15) of Table 1S in the ESI.† The corresponding reaction rate constants, kSS, kSD, kDS, and kDD for the copolymerizations I and II are expressed in eqn (11) and (12)39 of Table 1S,† respectively.
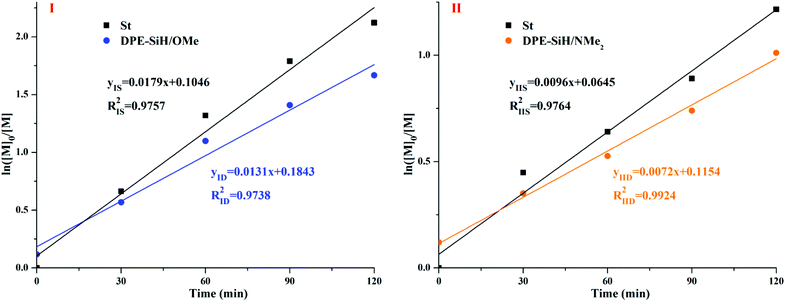 | ||
| Fig. 7 Apparent kinetic equations for copolymerizations I and II and the dependence of ln([M]0/[M]) on the reaction time. | ||
According to the actual concentration of the initiator in system I, [I] = 15/6100/0.16 g (g mol)−1 L−1 = 0.0154 mol L−1, kISS/kISD = rIS = 1.17, kISS × (0.05[I])1/2 + kIDS × (0.95[I])1/2 = kIS = 0.0179 L1/2 mol−1/2 min−1, kID = kISD[S−]1/2 + kIDD[D−]1/2, and kIDD = 0 (DPE cannot be homopolymerized). Thus, kISD = kID/[S−]1/2 = kID/(0.05[I])1/2 = 0.4732 L1/2 mol−1/2 min−1, kISS = rIS × kISD = 0.5536 L1/2 mol−1/2 min−1, and kIDS = 0.0210 L1/2 mol−1/2 min−1. In addition, the propagation rate constants for copolymerization of II were calculated using the same method. The end-capped ratio of DPE-SiH/NMe2 cannot be obtained from the corresponding 1H NMR spectra directly; thus, the value is taken to be approximately 95% according to the copolymerization of I. All of the results are shown in Table 5. The value of kISS corresponded well with the previous reports,72 which obtained a value of kSS = 0.5630 L1/2 mol−1/2 min−1, in homopolystyrene at 25 °C in benzene. Szwarc et al.63 reported the anionic copolymerization of styrene and 1,1-diphenylethylene (DPE) by poly(styryl)lithium in benzene. The value of kSS is 0.94 × 10⁻² L1/2 mol−1/2 s−1 (0.5640 L1/2 mol−1/2 min−1), kDS = 7.7 × 10⁻⁴ L1/2 mol−1/2 s−1 (0.0462 L1/2 mol−1/2 min−1), and kSD = 2.1 × 10⁻² L1/2 mol−1/2 s−1 (1.2600 L1/2 mol−1/2 min−1). The above data are in good agreement with our measured data from the experiment, indicating that this simplified approach is feasible.
According to the results in Table 5, kIDS = 0.0210 L1/2 mol−1/2 min−1 for DPE-SiH/OMe and kIIDS = 0.0020 L1/2 mol−1/2 min−1 for DPE-SiH/NMe2. Both of these values are smaller by one or more orders of magnitude than the corresponding kSS and kSD. Thus, crossover propagation is clearly present in the copolymerization, and kDS is the rate-determining step. Due to the strong electronegativity of the hydrogen atoms in the double bond, the electrophilic addition of poly(styryl)lithium is retarded in DPE derivatives containing electron donating substituents in the phenyl rings (DPE-D),42,73 and the opposite effect is observed in DPE derivatives containing electron withdrawing substituents (DPE-W). For the electron donating substituents, such as –OCH3 and –N(CH3)2, a greater substituent constant σ under the same conditions results in a smaller propagation rate constant kSD and a greater influence of the crossover propagation. According to Tables 2–5, the propagation rate constants influence the reactivity ratios (rIS < rIIS) and the structures of the copolymers – the PDI of copolymer II is broader than I. In addition, for the same DPE derivative, the crossover propagations increase frequently as the feed amount of DPE increases, and their effects are gradually weakened.
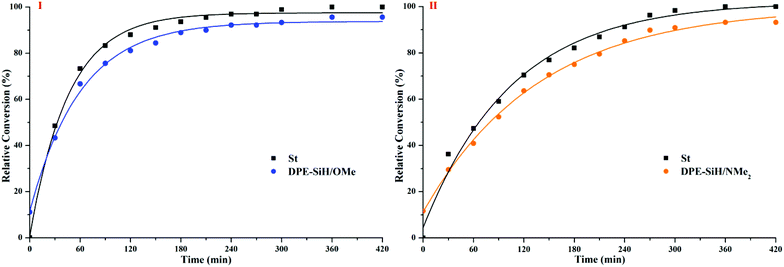
According to the results shown in Table 4, the corresponding curves of conversion vs. time are plotted in Fig. 8.
The relatively precise position information on the DPE derivative units in the corresponding copolymer chains was obtained by calculating the molecular weights and compositions of the samples, which were time-sampled from copolymerizations I and II, and integrating the inference of the polymerization. Then, the statistical sequence of the corresponding copolymer was determined. According to the results shown in Table 4, the average sequence structures for copolymers I and II are described and plotted in Fig. 9. A comparison of I and II in Fig. 9 indicated that the arrangements of copolymer sequences changed gradually and notably. At the beginning of propagation, polystyrene blocks are clearly observed within 30 min in the copolymers because there are many styrene monomers in the solution and kSS > kSD > kDS. Then, most of the styrene monomers have been consumed by 120 min after propagation and are introduced into the fronts of the chains because the chain propagation rate, RS, is always greater than RD. The propagations are still proceeding, but the speeds are decreased. After 180 min, these propagations are both nearly finished, and the relative quantities of DPE derivatives in the copolymers are larger. In addition, NS/ND decreases rapidly and approaches the feed ratios ([MS]0/[MD]0 = 4). This phenomenon is more notable when the reactivity ratio is greater (such as II). This result indicates that the sequential arrangement in the copolymer is influenced by the reactivity ratio. In addition, sequence-controlled copolymers can be obtained through the design of the reactivity ratio, and the rS is adjusted by the choice of substituent groups (electron withdrawing or donating) and the substituent site on the phenyl groups.
To verify the sequence determination, every sampling point of sample I for 150 min from copolymer I was characterized by MALDI-TOF MS for accurate molecular weights, and the corresponding curves are shown in Fig. 5Sa–e in the ESI.† The peak with the highest intensity (marked with red stars) in each curve gradually moved to the high-molecular-weight region due to the introduction of monomer units into the polymer chains. After the propagation proceeded for 30 min, the red star was calculated to be S15D2 (m/z = 2174.6, exact mass = 57.07 + 1.01 + 22.99 + 104.06 × 15 + 268.13 × 2 = 2178.2 g mol−1), which means that in the first 30 min, 15 styrene monomers and 1 DPE-SiH/OMe monomer participated in the propagation. After 60 min, the red star was calculated to be S20D3 (m/z = 2959.3, exact mass = 57.07 + 1.01 + 22.99 + 104.06 × 20 + 268.13 × 3 = 2966.7 g mol−1), which means that in the second 30 min, 7 styrene monomers and 1 DPE-SiH/OMe monomer were introduced into the living chain. Then, the propagation gradually slowed down. The red star was calculated as S24D4 (m/z = 3634.2, exact mass = 57.07 + 1.01 + 22.99 + 104.06 × 24 + 268.13 × 4 = 3651.0 g mol−1) after 150 min. As the propagation continued, the peak profiles in the MALDI-TOF mass spectra simultaneously became gradually wider. The widening trend corresponds with the data calculated from 1H NMR and characterized using SEC. The living anionic copolymerization, time sampling, characterization method, and calculation method for the proportion of these two monomer units are credible, and a method for the sequence determination of copolymers of styrene and DPE derivatives has been successfully constructed.
Synthesis of an approximately alternating copolymer of styrene and DPE-SiH/R
Yuki et al.18 reported that in a system for the anionic copolymerization of styrene and 1,1-diphenylethylene, kSS/kSD = rS < 1 and kDD = 0. An essentially alternating copolymerization proceeded if the molar feed ratio of the monomers was [MS]0/[MD]0 < 1/(1-rS). Hutchings et al.15 prepared alternating sequence copolymers of styrene and 1,1-diphenylethylene and characterized them using MALDI TOF MS. Li et al.51 prepared alternating sequence copolymers of styrene and dimethyl(4-(1-phenylvinyl)phenyl)silane (DPE-SiH). All of the above studies used either DPE or DPE derivatives with electron withdrawing groups, DPE-W, and they obeyed this polymerization regularity (rS < 1). Alternating sequences in copolymers composed of styrene and DPE derivatives with strong electron donating groups, DPE-D, are difficult to obtain. Quirk et al.38 used 1-(4-dimethylaminophenyl)-1-phenylethylene (DPE-NMe2), and Li et al.37 used 1,1-bis(4-dimethylaminophenyl)ethylene (DPE-(NMe2)2) to copolymerize with styrene; however, both of their ND/NS were over 4.38,38 and their rS values were 5.6 and 53.4, respectively. Therefore, the alternating copolymerization of styrene and DPE with weak electron donating groups must be further investigated.The range of m/z = 6000–8500 in Fig. 5Se in the ESI† is magnified, and the spectrum is shown in Fig. 10. Each relatively strong peak among their adjacent peaks has been assigned and marked on the upper portion of the figure. As an example, m/z = 6016.1 was calculated to be S42D6 (exact mass = 57.07 + 1.01 + 22.99 + 104.06 × 42 + 268.13 × 6 = 6060.3 g mol−1), and m/z = 8394.4 was calculated to be S50D12 (exact mass = 57.07 + 1.01 + 22.99 + 104.06 × 50 + 268.13 × 12 = 8501.6 g mol−1). The content of styrene in the lower-molecular-weight chains (Mn ≈ 6000 g mol−1) decreased gradually compared with that in the higher-molecular-weight chains (Mn ≈ 8400 g mol−1) (S42D6 → S48D13). In contrast, the content of DPE-SiH/OMe increased. Because the reactivity ratio remained unchanged in the same system, the decrease in NS/ND occurred due to the decreased molar concentration ratio of the free monomer ([MS]/[MD]) in the system. During the propagation, [MS] decreased faster than [MD] (kSS > kSD). Therefore, when the propagation approached the end, [MS] was far less than [MD]. In that case, the chain propagation rate, RS, was less than RD (eqn (11) and (12) in Table 1S†). The DPE derivative contents increased greatly in the copolymers. These results demonstrate that [MS]/[MD] is the key to control the amount of DPE units in the copolymers. If [MS]/[MD] is quantified and controlled in the feed, functionalized copolymers with higher contents of DPE derivatives and even alternating copolymers can be obtained.
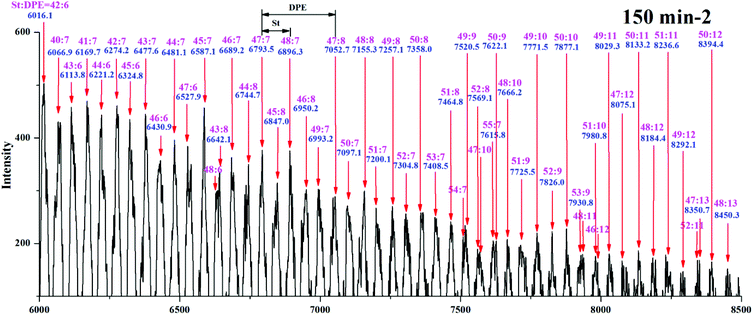 | ||
| Fig. 10 MALDI-TOF mass spectrum for copolymer I (part in m/z = 6000–8500 g mol−1) from the 150 min sample. | ||
Following the reaction kinetics, the critical condition of RS = RD should be met to obtain the copolymer with alternating sequences. That is, eqn (14) and (15) in Table 1S† on the right-hand sides are equal, and eqn (iii) is obtained:
 | (iii) |
 | (iv) |
The corresponding reactivity ratios and rate constants of I and II in Table 6 were substituted into eqn (iv), and the critical feed ratios, [MO]0C/[MS]0C = 1.36 ([MS]0C/[MO]0C = 0.74) and [MN]0C/[MS]0C = 1.32 ([MS]0C/[MN]0C = 0.76), were obtained.
To prove this inference, copolymerizations of styrene with DPE-SiH/OMe and styrene with DPE-SiH/NMe2 were carried out for feed ratios ([MS]0/[MD]0) of 0.5, 0.33 and 0.25. The molecular weight of styrene in the copolymer (Mn,S) for each sample was set to 1500 ([MS]0/[I] = 15). After removing the residual DPE derivative monomers, all the copolymers were obtained. The corresponding parameters were characterized using SEC and 1H NMR and are shown in Table 6. The results show that the styrene monomers were consumed completely at 24 h; narrow PDIs were achieved because crossover propagation occurred frequently.
To compare the ratio changes of the corresponding peaks for AO3 (NS/ND = 1.03), AN3 (NS/ND = 1.06), and PS in Table 6, O4 (NS/ND = 4.2) in Table 2, and N4 (NS/ND = 4.4) in Table 3, the 1H NMR spectra are shown in Fig. 11. In addition, the ratio details of the corresponding peaks are shown in Fig. 7S in the ESI.† After the feed amount was increased gradually, the DPE derivative contents in the copolymer increased continuously but slowly. The DPE derivative contents in copolymers AO2 and AO3 are similar, which means that the DPE-D contents in the copolymers have already reached their limits from reducing the feed ratio. If [MS]0/[MD]0 is reduced continuously, the risk of producing dimers of DPE derivatives during initiation will increase greatly.62 The 13C NMR spectra of AO3, AN3, PS, O4 and N4 are shown in Fig. 12. The styrene–styrene random block characteristic peak at δ 41.5–46.5 ppm is smaller in O4 and N4, and it is completely absent in AO3 and AN3. There is good agreement between the critical ratio and the experimental results, and approximately alternating copolymers were prepared.
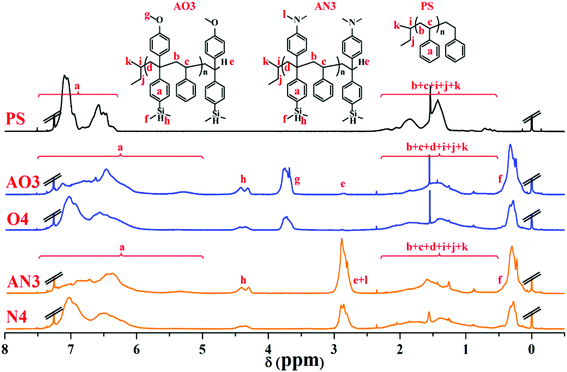 | ||
| Fig. 11 1H NMR spectra (in CDCl3) of homopolystyrene (PS), copolymers of styrene with DPE-SiH/OMe (AO3, O4) and copolymers of styrene with DPE-SiH/NMe2 (AN3, N4). | ||
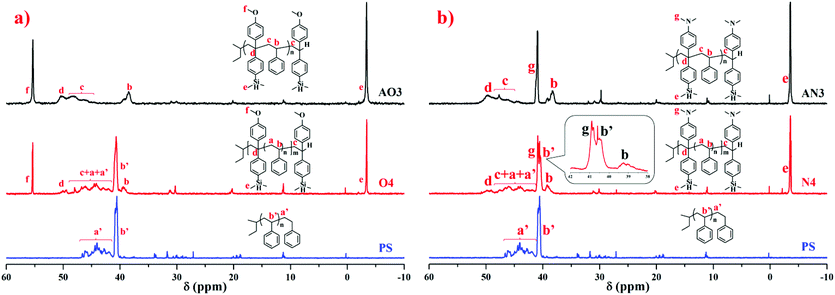 | ||
| Fig. 12 13C NMR spectra (in CDCl3) of homopolystyrene (PS), copolymers of styrene with DPE-SiH/OMe (a) and copolymers of styrene with DPE-SiH/NMe2 (b). | ||
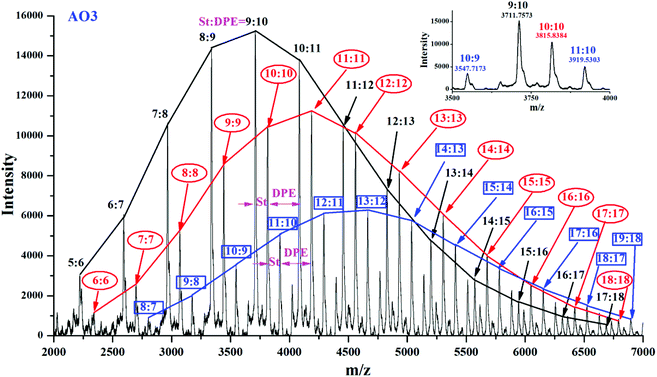
Approximately alternating copolymers of AO3 and AN3 were characterized by MALDI-TOF MS, and their corresponding spectra are shown in Fig. 13 and Fig. 6S in the ESI.† The main peak in each figure was calculated. For example, in Fig. 13, m/z = 3547.7173 was calculated to be S10D9 (exact mass = 57.07 + 1.01 + 22.99 + 104.06 × 10 + 268.13 × 9 = 3534.84), and m/z = 3919.5303 was calculated to be S11D10 (exact mass = 57.07 + 1.01 + 22.99 + 104.06 × 11 + 268.13 × 9 = 3907.03). Three components (black, (n − 1)![[thin space (1/6-em)]](https://www.rsc.org/images/entities/char_2009.gif) :
:![[thin space (1/6-em)]](https://www.rsc.org/images/entities/char_2009.gif) n; red, n
n; red, n![[thin space (1/6-em)]](https://www.rsc.org/images/entities/char_2009.gif) :
:![[thin space (1/6-em)]](https://www.rsc.org/images/entities/char_2009.gif) n; blue, (n + 1)
n; blue, (n + 1)![[thin space (1/6-em)]](https://www.rsc.org/images/entities/char_2009.gif) :
:![[thin space (1/6-em)]](https://www.rsc.org/images/entities/char_2009.gif) n) reflect the alternating polymerization between styrene and DPE-SiH/OMe. The MALDI data shown in Fig. 6S in the ESI† indicate several distributions of polymer chains some of which undoubtedly have an alternating sequence with peaks indicating a ratio of styrene
n) reflect the alternating polymerization between styrene and DPE-SiH/OMe. The MALDI data shown in Fig. 6S in the ESI† indicate several distributions of polymer chains some of which undoubtedly have an alternating sequence with peaks indicating a ratio of styrene![[thin space (1/6-em)]](https://www.rsc.org/images/entities/char_2009.gif) :
:![[thin space (1/6-em)]](https://www.rsc.org/images/entities/char_2009.gif) DPE repeat units of (n − 1)
DPE repeat units of (n − 1)![[thin space (1/6-em)]](https://www.rsc.org/images/entities/char_2009.gif) :
:![[thin space (1/6-em)]](https://www.rsc.org/images/entities/char_2009.gif) n, n
n, n![[thin space (1/6-em)]](https://www.rsc.org/images/entities/char_2009.gif) :
:![[thin space (1/6-em)]](https://www.rsc.org/images/entities/char_2009.gif) n and (n + 1)
n and (n + 1)![[thin space (1/6-em)]](https://www.rsc.org/images/entities/char_2009.gif) :
:![[thin space (1/6-em)]](https://www.rsc.org/images/entities/char_2009.gif) n. However, there are also significant peaks with comonomer ratios of (n + 2)
n. However, there are also significant peaks with comonomer ratios of (n + 2)![[thin space (1/6-em)]](https://www.rsc.org/images/entities/char_2009.gif) :
:![[thin space (1/6-em)]](https://www.rsc.org/images/entities/char_2009.gif) n and (n + 3)
n and (n + 3)![[thin space (1/6-em)]](https://www.rsc.org/images/entities/char_2009.gif) :
:![[thin space (1/6-em)]](https://www.rsc.org/images/entities/char_2009.gif) n indicating a non-alternating comonomer sequence. The end effect cannot be ignored when the molecular weights are less than 5000; the initiator (1,1-diphenylalkyllithiums) and the end-capping agent in chain terminals are the corresponding DPE derivatives. Therefore, in theory, NS/ND should be less than 1,15,45 but the trace amounts of styrene micro-blocks could not be eliminated completely, particularly when rS > 1 for DPE-D. Thus, copolymers of styrene and DPE-D with approximately alternating arrangements were synthesized. Good agreement was obtained between the MALDI-TOF MS and the statistical results.
n indicating a non-alternating comonomer sequence. The end effect cannot be ignored when the molecular weights are less than 5000; the initiator (1,1-diphenylalkyllithiums) and the end-capping agent in chain terminals are the corresponding DPE derivatives. Therefore, in theory, NS/ND should be less than 1,15,45 but the trace amounts of styrene micro-blocks could not be eliminated completely, particularly when rS > 1 for DPE-D. Thus, copolymers of styrene and DPE-D with approximately alternating arrangements were synthesized. Good agreement was obtained between the MALDI-TOF MS and the statistical results.
The Tg of homopolymers of DPE-SiH/OMe and DPE-SiH/NMe2 could also be calculated from Fox's equation (eqn (16) in Table 1S in the ESI†).38 The results are summarized in Table 6. The theoretical values of average glass transition temperatures in the DPE-SiH/OMe homopolymer, Tthg-O = 192 °C and accordingly, Tthg-N = 229 °C were calculated from these alternating copolymers using eqn (16); which correspond with the extrapolated values, Texg-O = 185 °C and Texg-N = 211 °C, calculated from eqn (iii) and (iv). In contrast to the previous studies,38 the glass transition temperature of the DPE-NMe2 homopolymer, calculated from eqn (16), is Tthg = 217 °C, which means that the Si–H groups in DPE-SiH/NMe2 could reduce chain motion and improve the copolymer's thermal stability despite its lower molecular weight.
The intermolecular alkaline functional groups, e.g., methoxy groups in DPE-SiH/OMe and dimethylamino groups in DPE-SiH/NMe2, were also observed to be Lewis bases. However, they have only a slight effect on the copolymerization even though the molar feed ratios of [MD]0/[I] are greater than 50 in AO3 and AN3. This conclusion corresponds well with the literature.73
In summary, the critical feed ratios for alternating copolymerization of styrene with DPE-SiH/OMe and styrene with DPE-SiH/NMe2 were obtained by determining the reaction rate constants. Then, the corresponding approximately alternating copolymers that comply with the critical feed ratios were designed and synthesized. The precise alternating structures were characterized by 1H NMR, 13C NMR, and MALDI-TOF MS.
Conclusions
Two types of novel 1,1-diphenylethylene derivative monomers (DPE-SiH/OMe and DPE-SiH/NMe2) containing asymmetric bi-functionalized groups were successful synthesized in this work. Subsequently, two types of copolymers, P(St-co-DPE-SiH/OMe) and P(St-co-DPE-SiH/NMe2), were prepared via anionic polymerization. The in-chain functionalized polystyrenes with different amounts of functionalized DPE derivatives were obtained by varying the feed ratio. Each sample was characterized by SEC, and 1H NMR. The average reactivity ratios, rS–O = 1.42 and rS–N = 1.79, were obtained and were similar to the results of the theoretical calculations using the Hammett equation. Furthermore, each sample was characterized by DSC, and the empirical relationships between the glass transition temperature of the copolymer (Tg) and the DPE derivative weight percent in the copolymer (DPE derivative wt%) were obtained. Furthermore, the extrapolated values of the glass transition temperatures for the homopolymers of the corresponding DPE derivatives, Texg-O = 180 °C and Texg-N = 211 °C, were obtained and are approximately equal to the theoretical value of Tthg-O = 192 °C and Tthg-N = 229 °C. Two types of reaction kinetics, the copolymerization of styrene and the corresponding DPE derivative at [MS]0/[MD]0 = 4, were investigated by time sampling, and the relevant kinetic curves were obtained. 1H NMR, SEC and MALDI TOF MS were used to determine the statistical sequences of the corresponding copolymers, and average sequence diagrams of the chain propagations were obtained. To obtain the corresponding alternating copolymer, two types of theoretical critical molar feed ratios, [MS]0C/[MO]0C = 0.74 and [MS]0C/[MN]0C = 0.76, were obtained by studying the reaction kinetics. Consequently, approximately alternating copolymers of styrene and the corresponding DPE derivatives were obtained, and the monomer unit ratios (NS/ND) in the copolymers were 1.04 and 1.06, respectively. The partly alternating structures of the copolymers were proven using 1H NMR, 13C NMR and MALDI TOF MS.A series of functionalized copolymers were prepared by LAP, and their backbones have functional groups that are introduced quantitatively and with position-control. Further work exploiting and applying these functionalized polymers is underway.
Acknowledgements
This work was financially supported by the National Basic Research Program of China, Grant No. 2015CB654700 (2015CB654701), and the National Natural Science Foundation of China (no. 21304013 and 21034001).Notes and references
- J. F. Lutz, M. Ouchi, D. R. Liu and M. Sawamoto, Science, 2013, 341, 1238149 CrossRef PubMed.
- R. K. Roy, A. Meszynska, C. Laure, L. Charles, C. Verchin and J.-F. Lutz, Nat. Commun., 2015, 6, 7237 CrossRef CAS PubMed.
- J. F. Lutz, Macromolecules, 2015, 48, 4759–4767 CrossRef CAS.
- S. Pfeifer and J. F. Lutz, J. Am. Chem. Soc., 2007, 129, 9542–9543 CrossRef CAS PubMed.
- M. Zamfir and J. F. Lutz, Nat. Commun., 2012, 3, 1138 CrossRef.
- J. F. Lutz, Acc. Chem. Res., 2013, 46, 2696–2705 CrossRef CAS PubMed.
- (a) M. Tesch, J. A. M. Hepperle, H. Klaasen, M. Letzel and A. Studer, Angew. Chem., Int. Ed., 2015, 54, 5054–5059 CrossRef CAS PubMed; (b) M. Ouchi, N. Badi, J. F. Lutz and M. Sawamoto, Nat. Chem., 2011, 3, 917–924 CrossRef CAS PubMed; (c) P. B. Zetterlund, G. Gody and S. Perrier, Macromol. Theory Simul., 2014, 23, 331–339 CrossRef CAS; (d) J. J. Haven, J. Vandenbergh, R. Kurita, J. Gruber and T. Junkers, Polym. Chem., 2015, 6, 5752–5765 RSC.
- J. Kang, D. Miyajima, T. Mori, Y. Inoue, Y. Itoh and T. Aida, Science, 2015, 347, 646–651 CrossRef CAS PubMed.
- S. Torker, A. Muller and P. Chen, Angew. Chem., Int. Ed., 2010, 49, 3762–3766 CrossRef CAS PubMed.
- A. Anastasaki, V. Nikolaou, N. W. McCaul, A. Simula, J. Godfrey, C. Waldron, P. Wilson, K. Kempe and D. M. Haddleton, Macromolecules, 2015, 48, 1404–1411 CrossRef CAS.
- E. G. L. Williams, B. Fairbanks, G. Moad, R. J. Mulder, E. Rizzardo and S. H. Thang, Polym. Chem., 2015, 6, 228–232 RSC.
- F. Alsubaie, A. Anastasaki, P. Wilson and D. M. Haddleton, Polym. Chem., 2015, 6, 406–417 RSC.
- P. B. Zetterlund, G. Gody and S. Perrier, Macromol. Theory Simul., 2014, 23, 331–339 CrossRef CAS.
- J. Li and J. P. He, ACS Macro Lett., 2015, 4, 372–376 CrossRef CAS.
- L. R. Hutchings, P. P. Brooks, D. Parker, J. A. Mosely and S. Sevinc, Macromolecules, 2015, 48, 610–628 CrossRef CAS.
- R. P. Quirk, T. Yoo, Y. Lee, J. Kim and B. Lee, Adv. Polym. Sci., 2000, 153, 67–162 CrossRef CAS.
- E. Ureta, J. Smid and M. Szwarc, J. Polym. Sci., Part A-1: Polym. Chem., 1966, 4, 2219–2228 CrossRef CAS.
- H. Yuki, J. Hotta, Y. Okamoto and S. Murahash, Bull. Chem. Soc. Jpn., 1967, 40, 2659–2663 CrossRef CAS.
- H. Gausepohl, S. Oepen, K. Knoll, M. Schneider, G. McKee and W. Loth, Des. Monomers Polym., 2000, 3, 299–315 CrossRef CAS.
- H. Yuki and Y. Okamoto, Bull. Chem. Soc. Jpn., 1970, 43, 148–151 CrossRef CAS.
- H. Yuki and Y. Okamoto, Bull. Chem. Soc. Jpn., 1969, 42, 1644–1649 CrossRef CAS.
- C. V. Hinton and H. G. Spencer, Macromolecules, 1976, 9, 864–866 CrossRef CAS.
- R. P. Quirk, C. Garces, D. Dabney, M. J. Polce and C. Wesdemiotis, Ionic Polymerization – Ip'09, 2011, 308, 68–76 CAS.
- M. G. Dhara, D. Baskaran and S. Sivaram, J. Polym. Sci., Polym. Chem. Ed., 2008, 46, 2132–2144 CrossRef CAS.
- K. Orfanou, H. Iatrou, D. J. Lohse and N. Hadjichristidis, Macromolecules, 2006, 39, 4361–4365 CrossRef CAS.
- S. W. Li, H. E. Park, J. M. Dealy, M. Maric, H. Lee, K. Im, H. Choi, T. Chang, M. S. Rahman and J. Mays, Macromolecules, 2011, 44, 208–214 CrossRef CAS.
- A. Hanisch, H. Schmalz and A. H. E. Muller, Macromolecules, 2012, 45, 8300–8309 CrossRef CAS.
- R. Goseki, Y. Ozama, E. Akemine, S. Ito, S. Ehara and A. Hirao, Polymer, 2013, 54, 2049–2057 CrossRef CAS.
- S. Ito, R. Goseki, S. Senda and A. Hirao, Macromolecules, 2012, 45, 4997–5011 CrossRef CAS.
- S. Ito, R. Goseki, T. Ishizone, S. Senda and A. Hirao, Macromolecules, 2013, 46, 819–827 CrossRef CAS.
- T. Higashihara, S. Ito, S. Fukuta, T. Koganezawa, M. Ueda, T. Ishizone and A. Hirao, Macromolecules, 2015, 48, 245–255 CrossRef CAS.
- R. Goseki, K. Togii, S. Tanaka, S. Ito, T. Ishizone and A. Hirao, Macromolecules, 2015, 48, 2370–2377 CrossRef CAS.
- G. X. Liu, H. W. Ma, H. Lee, H. D. Xu, S. Cheng, H. Sun, T. Y. Chang, R. P. Quirk and S. Q. Wang, Polymer, 2013, 54, 6608–6616 CrossRef CAS.
- W. C. Liao, W. H. Chen, C. H. Chen, T. S. Lim and T. Y. Luh, Macromolecules, 2013, 46, 1305–1311 CrossRef CAS.
- H. Zhang, N. C. Zhou, X. Zhu, X. R. Chen, Z. B. Zhang, W. Zhang, J. Zhu, Z. J. Hu and X. L. Zhu, Macromol. Rapid Commun., 2012, 33, 1845–1851 CrossRef CAS PubMed.
- H. Colquhoun and J. F. Lutz, Nat. Chem., 2014, 6, 455–456 CrossRef CAS PubMed.
- L. L. Wu, Y. S. Wang, Y. R. Wang, K. H. Shen and Y. Li, Polymer, 2013, 54, 2958–2965 CrossRef CAS.
- R. P. Quirk and L. F. Zhu, Polym. Int., 1992, 27, 1–6 CrossRef CAS.
- H. L. Hsieh and R. P. Quirk, Anionic Polymerization: Principles and Practical Applications, Marcel-Dekker, New York, 1996 Search PubMed.
- M. M. Diaz-Requejo, P. J. Perez, M. Brookhart and J. L. Templeton, Organometallics, 1997, 16, 4399–4402 CrossRef CAS.
- C. F. Bernasconi, R. A. Renfrow and P. R. Tia, J. Am. Chem. Soc., 1986, 108, 4541–4549 CrossRef CAS.
- R. Busson and M. Vanbeylen, Macromolecules, 1977, 10, 1320–1326 CrossRef CAS.
- A. Hirao, M. Hayashi and S. Loykulnant, Macromol. Symp., 2000, 161, 45–52 CrossRef CAS.
- A. Hirao, K. Murao, A. Abouelmagd, M. Uematsu, S. Ito, R. Goseki and T. Ishizone, Macromolecules, 2011, 44, 3302–3311 CrossRef CAS.
- H. W. Ma, Q. Y. Wang, W. Sang, L. Han, P. B. Liu, J. Chen, Y. Li and Y. R. Wang, Macromol. Rapid Commun., 2015, 36, 726–732 CrossRef CAS PubMed.
- L. L. Wu, H. W. Ma, Q. Y. Wang, L. Li, Y. R. Wang and Y. Li, J. Mater. Sci., 2014, 49, 5171–5181 CrossRef CAS.
- M. Shima, D. N. Bhattacharyya, J. Smid and M. Szwarc, J. Am. Chem. Soc., 1963, 85, 1306–1310 CrossRef CAS.
- A. M. Yol, J. Janoski, R. P. Quirk and C. Wesdemiotis, Anal. Chem., 2014, 86, 9576–9582 CrossRef CAS PubMed.
- A. A. Tomashevskii, V. V. Sokolov and A. A. Potekhin, Russ. J. Org. Chem., 2003, 39, 226–234 CrossRef CAS.
- H. Dehmlow, J. D. Aebi, S. Jolidon, Y. H. Ji, E. M. von der Mark, J. Himber and O. H. Morand, J. Med. Chem., 2003, 46, 3354–3370 CrossRef CAS PubMed.
- W. Sang, H. W. Ma, Q. Y. Wang, J. Chen, Y. Li and Y. B. Zheng, Des. Monomers Polym., 2015, 18, 479–485 CrossRef CAS.
- R. P. Quirk and S. Sahoo, Macromol. Symp., 2013, 325–326, 77–88 CrossRef CAS.
- W. B. Zhang, B. Sun, H. Li, X. Ren, J. Janoski, S. Sahoo, D. E. Dabney, C. Wesdemiotis, R. P. Quirk and S. Z. D. Cheng, Macromolecules, 2009, 42, 7258–7262 CrossRef CAS.
- J. L. He, K. Yue, Y. Q. Liu, X. F. Yu, P. H. Ni, K. A. Cavicchi, R. P. Quirk, E. Q. Chen, S. Z. D. Cheng and W. B. Zhang, Polym. Chem., 2012, 3, 2112–2120 RSC.
- G. J. Summers, M. P. Ndawuni and C. A. Summers, J. Polym. Sci., Polym. Chem. Ed., 2001, 39, 2058–2067 CrossRef CAS.
- L. R. Hutchings, J. M. Dodds, D. Rees, S. M. Kimani, J. J. Wu and E. Smith, Macromolecules, 2009, 42, 8675–8687 CrossRef CAS.
- O. Kir and W. H. Binder, Eur. Polym. J., 2013, 49, 3078–3088 CrossRef CAS.
- R. P. Quirk and Y. C. Wang, Polym. Int., 1993, 31, 51–59 CrossRef CAS.
- D. Ruhlmann and J. P. Fouassier, Eur. Polym. J., 1991, 27, 991–995 CrossRef CAS.
- A. Natalello, J. N. Hall, E. A. L. Eccles, S. M. Kimani and L. R. Hutchings, Macromol. Rapid Commun., 2011, 32, 233–237 CrossRef CAS PubMed.
- P. P. Brooks, A. Natalello, J. N. Hall, E. A. L. Eccles, S. M. Kimani, K. Bley and L. R. Hutchings, Macromol. Symp., 2013, 323, 42–50 CrossRef CAS.
- R. P. Quirk, C. Garces, S. Collins, D. Dabney, C. Wesdemiotis and V. Dudipala, Polymer, 2012, 53, 2162–2167 CrossRef CAS.
- A. Yamagishi and M. Szwarc, Macromolecules, 1978, 11, 504–506 CrossRef CAS.
- C. Hansch, A. Leo and R. W. Taft, Chem. Rev., 1991, 91, 165–195 CrossRef CAS.
- H. Bock, K. Ruppert, Z. Havlas, W. Bensch, W. Honle and H. G. Vonschnering, Angew. Chem., Int. Ed. Engl., 1991, 30, 1183–1186 CrossRef.
- J. J. Xu and F. S. Bates, Macromolecules, 2003, 36, 5432–5434 CrossRef CAS.
- K. Knoll, M. Schneider and S. Oepen, in Ionic Polymerizations and Related Processes, ed. J. E. Puskas, Springer, Dordrecht, 1999, vol. 359, pp. 219–221 Search PubMed.
- J. F. Lutz, Polym. Chem., 2010, 1, 55–62 RSC.
- R. K. Roy and J. F. Lutz, J. Am. Chem. Soc., 2014, 136, 12888–12891 CrossRef CAS PubMed.
- S. Srichan, H. Mutlu, N. Badi and J. F. Lutz, Angew. Chem., Int. Ed., 2014, 53, 9231–9235 CrossRef CAS PubMed.
- D. J. Worsfold and S. Bywater, Can. J. Chem., 1960, 38, 1891–1900 CrossRef CAS.
- H. A. Dean, Lange's handbook of chemistry, 1985 Search PubMed.
- L. L. Wu, H. W. Ma, X. Y. Lu, Y. S. Wang, Y. R. Wang and Y. Li, J. Macromol. Sci., Part A: Pure Appl. Chem., 2014, 51, 27–32 CrossRef CAS.
Footnotes |
| † Electronic supplementary information (ESI) available: Related characterization results that are not presented in the text but were referred to, including 1H NMR, 13C NMR, HSQC NMR, MS, MALDI-TOF MS, DSC, some data summarized in the tables, and the graphical method for simplified calculation of rS. See DOI: 10.1039/c5py01562f |
| ‡ These authors contributed equally as co-first authors. |
| This journal is © The Royal Society of Chemistry 2016 |


