Fabrication of polyacrylonitrile hollow fiber membranes from ionic liquid solutions
DooLi
Kim
a,
Nicolas
Moreno
ab and
Suzana Pereira
Nunes
*a
aBiological and Environmental Sciences and Engineering, King Abdullah University of Science and Technology, Saudi Arabia. E-mail: suzana.nunes@kaust.edu.sa
bCenter for Numerical Porous Media NUMPOR, King Abdullah University of Science and Technology, Saudi Arabia
First published on 8th October 2015
Abstract
The interest in green processes and products has increased, in order to reduce the negative impact of many industrial processes on the environment. Solvents, which play a crucial role in the fabrication of membranes, need to be replaced by sustainable and less toxic solvent alternatives for commonly used polymers. The purpose of this study is the fabrication of greener hollow fiber membranes based on polyacrylonitrile (PAN), substituting dimethylformamide (DMF) by less toxic mixtures of ionic liquids (IL) and dimethylsulfoxide (DMSO). A thermodynamic analysis was conducted, estimating the Gibbs free energy of mixing to find the most convenient solution compositions. Hollow fiber membranes were manufactured and optimized. As a result, a uniform pattern and high porosity were observed in the inner surface of the membranes prepared from the ionic liquid solutions. The membranes were coated with a polyamide layer by interfacial polymerization. The hollow fiber membranes were applied in forward osmosis experiments by using sucrose solutions as draw solution.
1. Introduction
Volatile organic compounds (VOC) resulting from many toxic or hazardous solvents are discharged in the air at an estimated rate of 20 million tons per year from industry.1 These emissions cause serious environmental issues, such as contamination of the atmosphere and contamination of aqueous effluents,2 posing a high risk to the environment and to human health. As concerns of regulatory authorities relating to environmental impact grow, interest in green processes and products, by the usage of harmless chemicals, has increased through the past decade.Green chemistry aims to reduce the usage of harmful chemicals and was summarized by Anastas et al.3 in twelve principles, which are important considerations in the design of processes and products.4 Using safer solvents and auxiliaries is one of the main aspects of green chemistry.5 The European Chemicals Agency (EACH), which is governed by EU public law, have classified harmful or toxic solvents into a list regulated by the Registration, Evaluation, Authorization and Restriction of chemicals (REACH).6 In this list, chemicals which are commonly used to fabricate membranes, such as DMF, NMP and DMA, appear as toxic compounds. This means that these commonly-used solvents may soon be withdrawn from the market and will not be able to be utilized in Europe, due to their high toxicity and risk for human health and the environment. This is a strong motivation to consider alternatives to conventional chemicals used as solvents, and replace them by sustainable and alternative solvents, which are less toxic to the environment and human health; such solvents are frequently referred to as “green” solvents.
Membrane technologies have a crucial role as green processes in terms of energy efficiency, with their simple operation process, high performance (e.g. selectivity and permeability), low energetic requirement compared to other separation processes, and their high stability under operating conditions.7 However, this only considers one side of “greenness” in membrane technology. It is important to think about other aspects, such as how can membranes be fabricated without the usage of any toxic compounds? Figoli et al.8 recently summarized very well the concept of greener membranes: firstly, the use of new and renewable materials to replace oil-derived chemicals was considered; secondly, the hazard or toxicity of the other chemicals involved in the fabrication of membranes, such as solvents, additives and modification agents, needs to be minimized as far as possible. This study focuses on the fabrication of greener membranes by the usage of chemicals with lower toxicity.
Solvents which play a crucial role in the fabrication of membranes are derived from petroleum, and generate volatile organic compounds during their production, which can cause health and environmental problems.9 Alternative or green solvents need to have low toxicity, be non-volatile, easy to recycle and inert, and should not contaminate the product.10 Over the past decade, water, ionic liquids, supercritical fluids (SCFs) and fluorous solvents have been reported as possible alternatives and green solvents.11
Ionic liquids (IL) are considered green solvents in many aspects, such as lack of a measurable vapor pressure, non-flammability, reusability, high thermal stability12 and low corrosiveness.13 Due to their high solubility in water, toxicity to aquatic organisms has been a matter of some concern,14 but the substitution of hazardous volatile organic solvents frequently used for membrane fabrication by less toxic mixtures containing ionic liquids could be very beneficial. The term ionic liquid refers to liquids composed entirely of ions that are fluid at temperatures below 100 °C,10,15 and do not lead to hazardous VOC generation, in contrast to common organic solvents.15,16
Many studies have focused on dissolving cellulose using hydrophilic ionic liquids, such as 1-butyl-3-methylimidazolium chloride [BMIM]Cl and 1-allyl-3-methylimidazolium chloride [AMIM]Cl.17 Swatloski et al.18 showed that ionic liquids can be used as non-derivatizing solvents for cellulose. They also reported that ionic liquids with anions that are strong hydrogen bond acceptors were most effective for dissolving cellulose.19 S. Livazovic et al.20 recently reported a membrane based on cellulose manufactured using an ionic liquid. Wang et al.21 reported the dissolution of polybenzimidazole (PBI) in 1-ethyl-3-methylimidazolium chloride ([EMIM]Cl). However, very few studies related to the preparation of membranes have focused on ionic liquids. Xing et al. dissolved cellulose acetate (CA) in 1-butyl-3-methylimidazolium thiocyanate ([BMIM]SCN) to fabricate flat sheet membranes.22 In a following study, they also fabricated hollow fiber membranes using the same polymer, but dissolved in a different ionic liquid, 1-ethyl-3-methylimidazolium thiocyanate ([EMIM]SCN).23 Similarly, Ultrafiltration (UF) membranes were also fabricated but using only polybenzimidazole (PBI)24 or blends of PBI and P84 polyimide,25 with both studies using the same ionic liquid, 1-ethyl-3-methylimidazolium acetate ([EMIM]OAc). Only a few polymers have been used for the fabrication of membranes with ionic liquids, due to their poor activity as solvents for the polymers which are commonly used for membrane fabrication, such as polysulfone (PSf), polyacrylonitrile (PAN) and polyetherimide (PEI).
DMSO, a good solvent for commercial polymers and commonly used for membrane fabrication, is considered to be of low toxicity according to GSK's guide26,27 and is not in the REACH solvent list under concern.6 Low toxicity, high polarity, and water miscibility are good characteristics for a solvent in membrane manufacture, making DMSO a good candidate to replace DMF, dimethylacetamide (DMA) and 1-methyl-2-pyrrolidone (NMP).
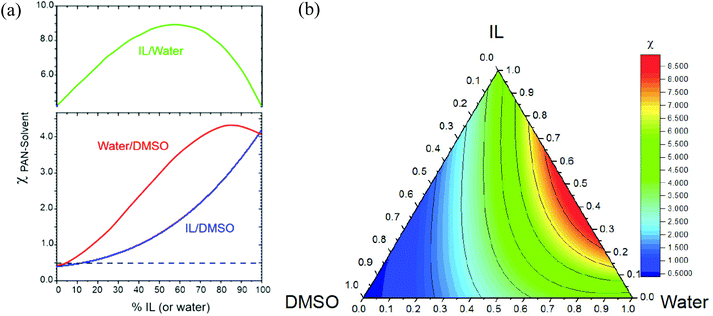
The purpose of this study is the fabrication of PAN hollow fiber membranes with good pore morphology, using solvent mixtures of ionic liquids and DMSO, which has lower toxicity than other commonly-used polar organic solvents. First, a suitable composition was estimated considering their thermodynamic interactions expressed by the Flory–Huggins parameter, χ, and the Gibbs free energy of mixing. Theoretical and experimental phase diagrams were constructed to validate the proper solvent composition. Once the appropriate solvent and polymer compositions had been identified, membranes were manufactured using these less toxic solvent mixtures. The performances of hollow fiber membranes prepared from IL/DMSO, pure DMSO, and pure DMF were compared for FO systems.
2. Experiments
2.1 Materials
Polyacrylonitrile (PAN, Mw = 324![[thin space (1/6-em)]](https://www.rsc.org/images/entities/char_2009.gif) 000) was used as the polymer in the form of fine powder. The ionic liquid (IL) was 1-ethyl-3-methylimidazolium acetate ([EMIM]OAc, ≥95.0%), supplied by Sigma-Aldrich. Dimethyl sulfoxide (DMSO, ≥99%) and dimethylformamide (DMF, 99.8%) were also purchased from Sigma-Aldrich. The used materials are summarized in Table 1. For the interfacial polymerization (IP), M-phenyldiamine (MPD, >99%), 1,3,5-benzenetricarbonyltrichloride (TMC, 98%), triethylamine (TEA, >99.5%), and (1S)-(+)-10-camphorsulfonic acid (CSA, 99%) were supplied by Sigma-Aldrich. Polyethylene glycol (PEG) (Sigma-Aldrich) and polyethylene oxide (PEO) (Sigma-Aldrich), with molecular weights of 300 g mol−1, 1500 g mol−1, 6000 g mol−1, 10
000) was used as the polymer in the form of fine powder. The ionic liquid (IL) was 1-ethyl-3-methylimidazolium acetate ([EMIM]OAc, ≥95.0%), supplied by Sigma-Aldrich. Dimethyl sulfoxide (DMSO, ≥99%) and dimethylformamide (DMF, 99.8%) were also purchased from Sigma-Aldrich. The used materials are summarized in Table 1. For the interfacial polymerization (IP), M-phenyldiamine (MPD, >99%), 1,3,5-benzenetricarbonyltrichloride (TMC, 98%), triethylamine (TEA, >99.5%), and (1S)-(+)-10-camphorsulfonic acid (CSA, 99%) were supplied by Sigma-Aldrich. Polyethylene glycol (PEG) (Sigma-Aldrich) and polyethylene oxide (PEO) (Sigma-Aldrich), with molecular weights of 300 g mol−1, 1500 g mol−1, 6000 g mol−1, 10![[thin space (1/6-em)]](https://www.rsc.org/images/entities/char_2009.gif) 000 g mol−1, 35
000 g mol−1, 35![[thin space (1/6-em)]](https://www.rsc.org/images/entities/char_2009.gif) 000 g mol−1, 100
000 g mol−1, 100![[thin space (1/6-em)]](https://www.rsc.org/images/entities/char_2009.gif) 000 g mol−1 and 600
000 g mol−1 and 600![[thin space (1/6-em)]](https://www.rsc.org/images/entities/char_2009.gif) 000 g mol−1, were used for the solute rejection evaluation and determination of the molecular weight cut-off (MWCO). Sucrose (Sigma-Aldrich) was used as draw solution, which was applied in the lumen side of the thin film composite (TFC) hollow fiber membranes for testing the performance in a forward osmosis (FO) system.
000 g mol−1, were used for the solute rejection evaluation and determination of the molecular weight cut-off (MWCO). Sucrose (Sigma-Aldrich) was used as draw solution, which was applied in the lumen side of the thin film composite (TFC) hollow fiber membranes for testing the performance in a forward osmosis (FO) system.
2.2 Thermodynamic analysis
| ΔGm = ΔHm − TΔSm, | (1) |
ΔGm/N0 = kT[χϕ1ϕ2 + ϕ1/x1![[thin space (1/6-em)]](https://www.rsc.org/images/entities/char_2009.gif) ln ln![[thin space (1/6-em)]](https://www.rsc.org/images/entities/char_2009.gif) ϕ1 + ϕ2/x2 ϕ1 + ϕ2/x2![[thin space (1/6-em)]](https://www.rsc.org/images/entities/char_2009.gif) ln ln![[thin space (1/6-em)]](https://www.rsc.org/images/entities/char_2009.gif) ϕ2], ϕ2], | (2) |
| χij = Vi (δi − δj)2/RT + 0.34, | (3) |
| δ2 = δD2 + δP2 + δH2. | (4) |
In particular, for ionic liquids, the electrostatic33 and Coulombic interactions may have an important contribution that is not included in the traditional Hansen approach. Therefore, experimentally- or computationally-based estimations are suitable for improving the free energy calculation. Xing et al.22,23,25 calculated the solubility parameter of the ionic liquids [EMIM]OAc and [EMIM]SCN using molecular dynamic simulations,34 leading finally to ΔGm values.
2.3. Fabrication of membranes
PAN was dissolved in a 3-neck flask in each solvent at 60 °C for 12 hours. The polymer solutions were prepared with the mixture of the ionic liquid (IL), 1-ethyl-3-methylimidazolium acetate and DMSO; with pure DMSO; and with pure DMF. Hollow fiber membranes were fabricated from the mentioned polymer solutions resulting in HF-20IL 1, 2, and 3; HF-DMSO; and HF-DMF, respectively. In the case of the polymer solutions with the ionic liquid, the ionic liquid was added after complete polymer dissolution in DMSO, then they were stirred for 12 hours more at room temperature. The prepared dope solutions were degassed inside the reservoir of the dope solution for 24 hours. Hollow fiber membranes were then prepared by using a double spinneret with 0.34 μm inner diameter (ID) and 0.64 μm outer diameter (OD) at room temperature. After spinning, the hollow fiber membranes were immersed in water for a day, then immersed in a mixture of 50% glycerol and 2-propanol for 2 hours, and dried in a room temperature. The spinning conditions are summarized in Table 2. These spinning conditions were designed to fabricate hollow fiber membranes with thin walls with thicknesses of approximately 100 μm, which is convenient in forward osmosis to improve water flux. In the case of the composition of the bore fluids, the concentration of water was always 10 wt%; 90 wt% DMSO or DMF was used, depending on the solvent used in the dope solutions.| Sample code | HF-20IL 1 | HF-20IL 2 | HF-20IL 3 | HF-DMSO | HF-DMF |
|---|---|---|---|---|---|
| Dope solution composition (wt%) | 12% PAN 88% (20/80) IL/DMSO | 12% PAN 88% (20/80) IL/DMSO | 12% PAN 88% (20/80) IL/DMSO | 12% PAN 88% DMSO | 12% PAN 88% DMF |
| Composition of bore fluid (wt%) | 90/10 DMSO/H2O | 90/10 DMSO/H2O | 90/10 DMSO/H2O | 90/10 DMSO/H2O | 90/10 DMF/H2O |
| Coagulant | DI water | DI water | DI water | DI water | DI water |
| Air gap (cm) | 10 | 10 | 10 | 10 | 10 |
| Pressure (bar) | 2 | 2 | 2 | 2 | 2 |
| Flow rate of dope solution (mL min−1) | 2.8 | 3.7 | 7.4 | 6.7 | 5.0 |
| Flow rate of inner coagulant (mL min−1) | 3 | 3 | 5 | 3 | 3 |
| Take-up speed (m min−1) | 17.8 | 17.8 | 17.8 | 17.6 | 17.7 |
| Temperature of dope solution, bore fluid and coagulant (°C) | 25 | 25 | 25 | 25 | 25 |
To apply the hollow fiber membranes in FO, the membranes need to have selective layers with fine pores (less than 10 Å) to reject monovalent ions such as NaCl. Interfacially polymerized polyamide is commonly used as a selective layer. TFC hollow fiber membranes were prepared by interfacially polymerizing on the outer surface of the hollow fiber supports. Each hollow fiber support, which was blocked by epoxy in both sides to prevent the MPD aqueous solution from invading the lumen of the hollow fibers, was immersed for 3 minutes in an aqueous solution containing 2 wt% of MPD, 1% of CSA and 1% of TEA. After removing the MPD solution excess on the surface of the hollow fiber, the fiber was immersed for 20 seconds in an organic solvent, which was composed of 0.1% TMC in hexane, to obtain the thin film polyamide selective layer on the surface of the hollow fiber by interfacial polymerization. The TFC hollow fiber membrane was rinsed in pure hexane, to remove unreacted functional groups, for 1 minute. After removing excess hexane, the TFC hollow fiber membranes were immersed in a mixture of 25% glycerol and 75% water for 2 hours and were dried at room temperature.
2.4 Characterization of the polymer solutions and the membranes
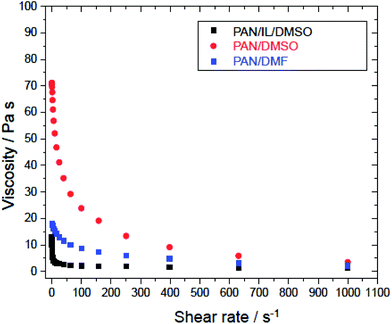
The viscosity (AR1500ex rheometer, TA Instruments) of the polymer solution affects the thickness and diameter of the fibers and also has an effect on the spinning conditions. In addition, it is also important data for investigating and gaining insight into the effects of the ionic liquids during membrane fabrication. To prepare the UF membrane using the non-solvent induced phase separation (NIPS) method, the polymer solution needs to have a proper range of viscosity, which depends on the types of polymer and solvents and their concentrations. It is also different for different polymer molecular weights.
Water permeance tests and solute rejection tests were conducted to evaluate the performance of the membranes. The water permeance and rejection were calculated by the following equations:
| Water permeance (Lm−2 h−1 bar−1) = QA−1ΔP−1 | (5) |
| Solute rejection, R (%) = (1 − Cperm/Cfeed) × 100, | (6) |
2.5 Performance in forward osmosis experiments
The hollow fiber membranes were tested in cross-flow forward osmosis experiments under the following conditions: 2 M and 1 M sucrose solutions as the draw solutions, deionized water as the feed solution, 1 L min−1 flow rate, 25 °C test temperature, pH 7, and the TFC active layer facing the feed solution. The reversible solute flux (gMH), which indicates the amount of solute that permeates from the draw solution to the feed side, was measured by refractometry (AR2008 Digital Abbe Refractometer, KRÜSS) and by a vapor pressure osmometer (Model 5600 Vapro vapor pressure osmometer, Wescor).3. Results
3.1 Thermodynamic analysis
| δ d | δ P | δ h | δ(MPa1/2) | |
|---|---|---|---|---|
| δ d, dispersive contribution; δP, polar contribution; δh, hydrogen bonding contribution.31a Hansen solubility parameter.b Calculated by Materials Studio (molecular dynamics simulation);24,25 1-ethyl-3-methylimidazolium acetate ([EMIM]OAc). | ||||
| PANa | 17.9 | 16.7 | 6.3 | 25.2 |
| [EMIM]OAcb | — | — | — | 32.8 |
| DMSOa | 18.4 | 16.4 | 10.2 | 26.6 |
| DMFa | 17.4 | 13.7 | 11.3 | 24.8 |
| Watera | 15.5 | 16 | 42.3 | 47.8 |
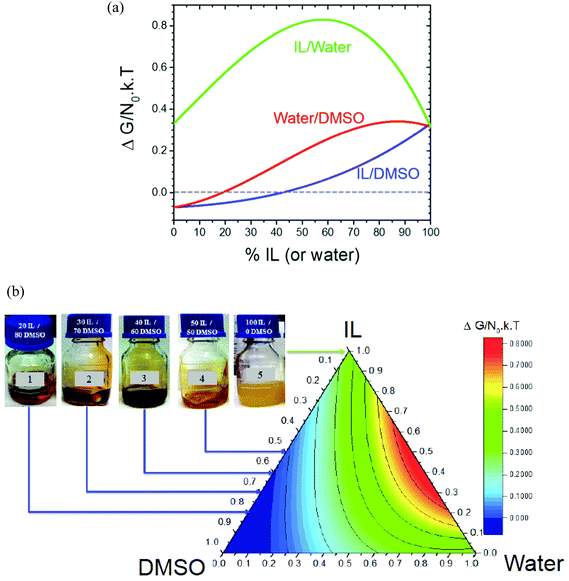
Effects of the polymer composition are not included in the calculation of χ; therefore, the proper range of the solvent mixture composition can be derived from the free energy. Fig. 2 shows the Gibbs free energy of mixing for each solvent mixture, calculated from the Flory–Huggins parameters, applying eqn (2). The Gibbs free energy of mixing considers the interaction parameter, as well as the polymer and solvent volume fractions, ϕ2 and ϕ1, respectively. In Fig. 2, the Gibbs free energy of mixtures containing 12% PAN in solvent mixtures is presented. As shown in Fig. 2(a), binary DMSO/IL solvent mixtures lead to negative values of ΔG with ionic liquid concentrations of up to 42%. With this amount of ionic liquid, the solution should remain homogeneous. In the case of DMSO/water, 19% water can be added without leading to positive ΔG values. Fig. 2(b) shows ΔG for PAN in ternary solvents. Based on the free energy analysis, the theoretical solvent mixture composition most suitable for fabrication of the membranes was identified.
Once the range of solvent compositions was narrowed by the theoretical predictions, the proper solvent composition for membrane preparation was validated experimentally. PAN was dissolved in different mixtures containing ionic liquid, as depicted in Fig. 2b. 12 wt% PAN was not soluble in pure ionic liquid. Systems with 12% PAN in (20/80, 30/70 or 40/60) IL/DMSO solvent mixtures were homogeneous. A solution with 12% PAN in a (50/50) IL/DMSO solvent mixture was also homogeneous, but had a very high viscosity, behaving practically like a gel. These compositions match the theoretically predicted range.
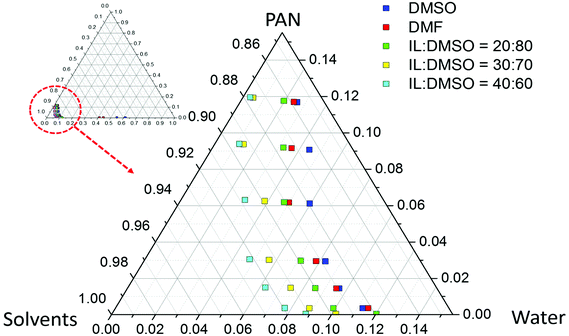 | ||
| Fig. 3 Phase diagram and cloud points for PAN in different solvents or solvent mixtures and water as a non-solvent, obtained at 25 °C ± 1. | ||
The cloud points were obtained for 5 different solvents or solvent mixtures: DMSO, DMF and (20/80, 30/70 or 40/60) IL/DMSO. All polymer solutions tend to phase separate by titrating water as a non-solvent. Starting with solutions prepared with IL/DMSO solvent mixtures, phase separation is induced with a slightly smaller amount of water than with solutions in pure DMF or DMSO. The tendency of the polymer solutions to phase separate with the addition of water was DMSO < DMF < (20/80) IL/DMSO < (30/70) IL/DMSO < (40/60) IL/DMSO. Taking into account the processability requirements for fabrication of hollow fiber membranes (i.e. the viscosity of the solution and the polymer concentration), a solution with 12% PAN in (20/80) IL/DMSO was chosen for posterior hollow fiber membrane fabrication, which was compared to hollow membranes fabricated using pure DMSO and DMF in terms of various properties.
3.2 Membrane morphologies
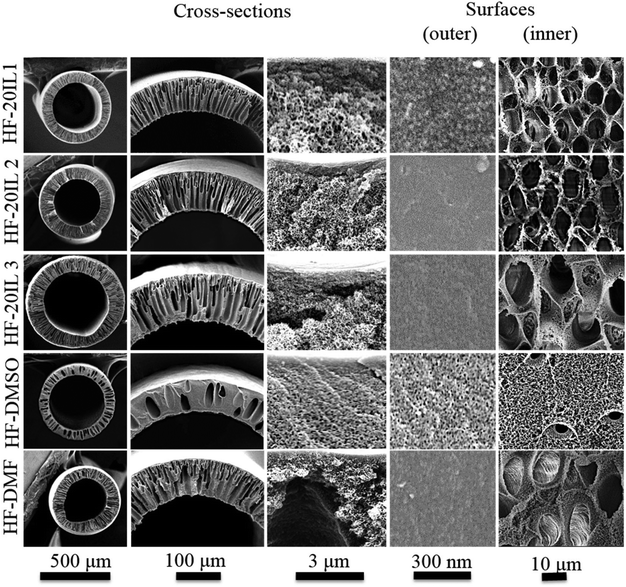 | ||
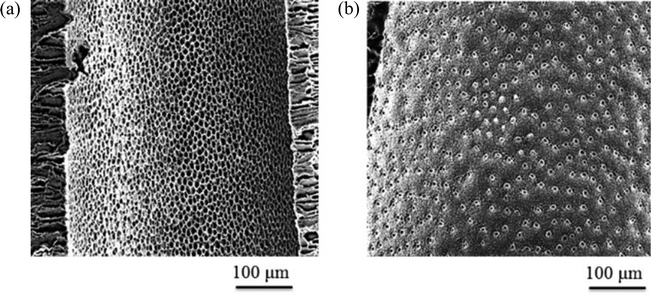
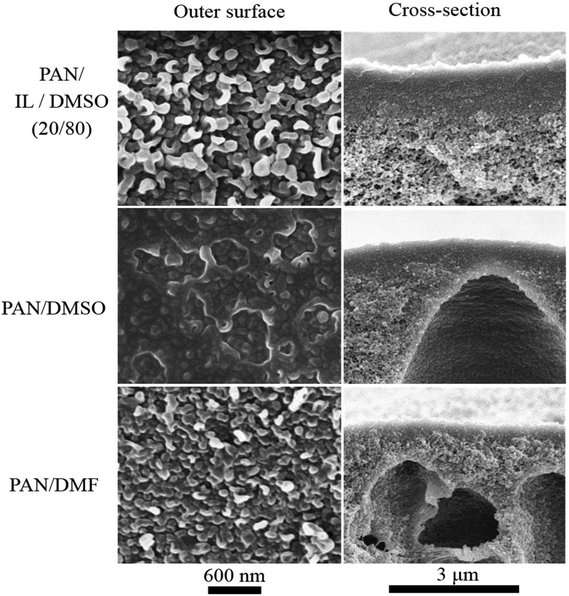
| Fig. 4 FESEM images of hollow fiber membrane cross-sections and surfaces: HF-20IL 1, HF-20IL 2 and HF-20IL 3 (IL/DMSO), HF-DMSO (DMSO), and HF-DMF (DMF). | ||
3.3 Characteristics of the polymer solutions and the membranes
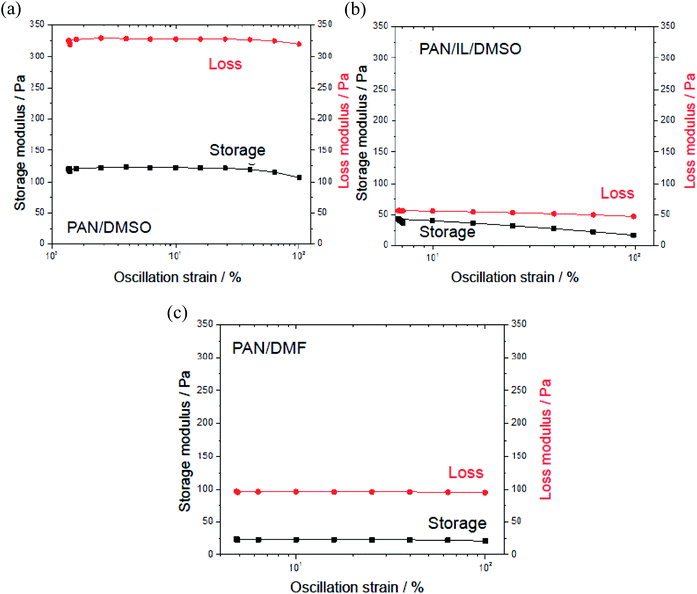 | ||
| Fig. 8 Storage (G′) and loss (G′′) moduli as a function of oscillation strain (%) at 1 Hz: 12% PAN (a) in DMSO, (b) in (20/80) IL/DMSO and (c) in DMF. | ||
The pore formation in membranes by phase inversion depends on the interplay between the thermodynamics and kinetics of the polymer solution. By immersion in water, the solvent–non-solvent exchange will drive the system to phase separation, reaching the unstable region of the phase diagram (Fig. 3). The phase separation proceeds by spinodal decomposition or nucleation and growth, depending on the solvent exchange path guiding to the 2-phases region. The pore morphology and size will depend on how fast the phase separation evolves before the system gels. Fast gelation should lead to a fast interruption of the phase separation process, and also might help to keep any pre-established order in the solution. If phase separation is allowed to progress to late stages, coalescence and disorder can be favored, also leading to a more disordered pore structure. By adding ionic liquid, the gel character of the solution seems to be enhanced. The ionic liquid might also contribute to a better-organized system, with highly elastic character, which gels faster when water initiates the phase separation. At the same time, the presence of ionic liquid increases the interaction with water (the solubility parameter is closer to that of water) and facilitates the water-solvent exchange. These factors might have contributed to the regular and open pore structure shown in Fig. 5.
Additionally to the surface morphology, the cross-sections of membranes prepared with ionic liquids differ from those prepared from solutions in pure DMSO. A fine finger-like cavity structure is observed when ionic liquid is used, while a rather heterogeneous structure with sponge-like morphology and scattered pear-like cavities can be seen when using pure DMSO.
The formation of the finger- or pear-like structures depends less on the mechanism of phase separation (spinodal decomposition or nucleation and growth), and more on how homogeneous the interface between the polymer solution and water is, and how fast and abrupt the water-solvent exchange takes place, as well as how viscous the polymer solution is.
![[triple bond, length as m-dash]](https://www.rsc.org/images/entities/char_e002.gif) N stretching vibration, at 1453 cm−1 for C–H bending in CH2 and at 1358 cm−1 for C–H bending in CH. In addition, the peaks of [EMIM]OAc are at 3135 cm−1 for
N stretching vibration, at 1453 cm−1 for C–H bending in CH2 and at 1358 cm−1 for C–H bending in CH. In addition, the peaks of [EMIM]OAc are at 3135 cm−1 for ![[double bond, length as m-dash]](https://www.rsc.org/images/entities/char_e001.gif) C–H stretching, at 2973 cm−1 for –C–H stretching, at 1559 cm−1 for C
C–H stretching, at 2973 cm−1 for –C–H stretching, at 1559 cm−1 for C![[double bond, length as m-dash]](https://www.rsc.org/images/entities/char_e001.gif) O stretching of acetate anions, and those below 1500 cm−1 result from the imidazolium cations. In particular, the peak at 1559 cm−1 for the ionic liquid is strong and could not be seen in the membranes. We can affirm that no remaining ionic liquid was observed, at least in the range of detection allowed by FT-IR. The ionic liquid was, therefore, removed by dissolution in water while the phase inversion occurred and by rinsing the fabricated hollow fiber membranes in water for a day.
O stretching of acetate anions, and those below 1500 cm−1 result from the imidazolium cations. In particular, the peak at 1559 cm−1 for the ionic liquid is strong and could not be seen in the membranes. We can affirm that no remaining ionic liquid was observed, at least in the range of detection allowed by FT-IR. The ionic liquid was, therefore, removed by dissolution in water while the phase inversion occurred and by rinsing the fabricated hollow fiber membranes in water for a day.
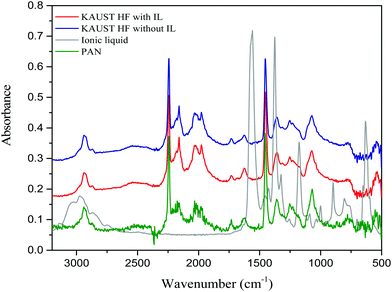 | ||
| Fig. 9 FT-IR spectra of: hollow fiber with 20% IL (red), hollow fiber without IL (blue), pure ionic liquid (grey) and PAN (green). | ||
For each membrane, the results of the water permeance, the molecular weight cut-off (MWCO), the mechanical strength (stress and strain values at the breaking point), the Young's modulus and the contact angle are summarized in Table 4. The water permeance was measured in a dead-end set-up and it was calculated by using eqn (5). A membrane prepared with ionic liquid, HF-20IL 2, had 2.5 times higher water permeance than that for the membrane prepared from solution in DMSO alone, HF-DMSO. Higher porosity is a reason for that (see the inner surface morphology in Fig. 4 and 5). Also, the molecular weight cut-off of the HF-DMSO membrane is smaller, indicating smaller pores in the selective outer layer. Therefore, the hollow fiber membranes prepared from solutions with ionic liquid have better performance in terms of the water permeance. HF-20IL 1, HF-20IL 3 and HF-DMF were deformed while testing their water permeance, due to their mechanical properties. As their Young's moduli showed low values in Table 4, which denotes that their elasticities are higher, these properties were affected on deforming the circular shape of the hollow fiber membranes and elongating the hollow fiber membranes under the pressure. The rejection of solutes in a feed solution with 300 g mol−1 PEG to 600![[thin space (1/6-em)]](https://www.rsc.org/images/entities/char_2009.gif) 000 g mol−1 PEO is summarized in Table 5. The membrane prepared with the ionic liquid is only slightly more hydrophilic than the one without the ionic liquid (Table 4). The mechanical strength of the hollow fiber with the ionic liquid, in terms of the fiber breaking stress and strain, is stronger than the one with DMF alone, but lower than the one with DMSO alone; this membrane also had a higher Young's modulus than the other membranes, indicating more rigidity.
000 g mol−1 PEO is summarized in Table 5. The membrane prepared with the ionic liquid is only slightly more hydrophilic than the one without the ionic liquid (Table 4). The mechanical strength of the hollow fiber with the ionic liquid, in terms of the fiber breaking stress and strain, is stronger than the one with DMF alone, but lower than the one with DMSO alone; this membrane also had a higher Young's modulus than the other membranes, indicating more rigidity.
| HF support membrane | Mechanical strength | Young's modulus | Contact angle (°) | |||
|---|---|---|---|---|---|---|
| Water permeance (Lm−2 h−1 bar−1) | Molecular weight cut-off (g mol−1) | Stress (MPa) | Strain (%) | |||
a Deformation of the hollow fiber was observed during the test. Feed solution: 300 g mol−1, 1500 g mol−1, 6000 g mol−1, 10![[thin space (1/6-em)]](https://www.rsc.org/images/entities/char_2009.gif) 000 g mol−1, 35 000 g mol−1, 35![[thin space (1/6-em)]](https://www.rsc.org/images/entities/char_2009.gif) 000 g mol−1, 100 000 g mol−1, 100![[thin space (1/6-em)]](https://www.rsc.org/images/entities/char_2009.gif) 000 g mol−1 and 600 000 g mol−1 and 600![[thin space (1/6-em)]](https://www.rsc.org/images/entities/char_2009.gif) 000 g mol−1 PEG solutions. 000 g mol−1 PEG solutions. |
||||||
| HF-20IL 1 | 428a ± 10 | 60![[thin space (1/6-em)]](https://www.rsc.org/images/entities/char_2009.gif) 000 000 |
4.8 ± 0.2 | 37 ± 1 | 1.17 | 52 ± 2 |
| HF-20IL 2 | 540 ± 30 | 54![[thin space (1/6-em)]](https://www.rsc.org/images/entities/char_2009.gif) 000 000 |
5.8 ± 0.1 | 31 ± 1 | 1.69 | |
| HF-20IL 3 | 175a ± 10 | 67![[thin space (1/6-em)]](https://www.rsc.org/images/entities/char_2009.gif) 000 000 |
3.9 ± 0.2 | 24 ± 5 | 1.12 | |
| HF-DMSO | 209 ± 10 | 32![[thin space (1/6-em)]](https://www.rsc.org/images/entities/char_2009.gif) 000 000 |
6.3 ± 0.3 | 43 ± 3 | 2.02 | 56 ± 2 |
| HF-DMF | 22a ± 10 | 80![[thin space (1/6-em)]](https://www.rsc.org/images/entities/char_2009.gif) 000 000 |
4.1 ± 0.2 | 14 ± 2 | 0.81 | |
| Solute molecular weight (g mol−1) | HF-20IL 1(%) | HF-20IL 2 (%) | HF-20IL 3 (%) | HF–DMSO (%) | HF-DMF (%) |
|---|---|---|---|---|---|
Test conditions: 2 bar (pressure), 0.1 wt% 6000 g mol−1 PEG, 0.1 wt% 10![[thin space (1/6-em)]](https://www.rsc.org/images/entities/char_2009.gif) 000 g mol−1 PEG, 0.1 wt% 35 000 g mol−1 PEG, 0.1 wt% 35![[thin space (1/6-em)]](https://www.rsc.org/images/entities/char_2009.gif) 000 g mol−1 PEG, 0.1 wt% 100 000 g mol−1 PEG, 0.1 wt% 100![[thin space (1/6-em)]](https://www.rsc.org/images/entities/char_2009.gif) 000 g mol−1 PEO, 0.1 wt% 600 000 g mol−1 PEO, 0.1 wt% 600![[thin space (1/6-em)]](https://www.rsc.org/images/entities/char_2009.gif) 000 g mol−1 PEO (feed solution). 000 g mol−1 PEO (feed solution). |
|||||
| 300 | 48 | 39 | 18 | 23 | 43 |
| 1500 | 49 | 42 | 22 | 52 | 48 |
| 6000 | 59 | 56 | 42 | 62 | 53 |
10![[thin space (1/6-em)]](https://www.rsc.org/images/entities/char_2009.gif) 000 000 |
62 | 62 | 50 | 68 | 56 |
35![[thin space (1/6-em)]](https://www.rsc.org/images/entities/char_2009.gif) 000 000 |
85 | 87 | 82 | 94 | 70 |
100![[thin space (1/6-em)]](https://www.rsc.org/images/entities/char_2009.gif) 000 000 |
100 | 100 | 100 | 100 | 100 |
3.4 Performance in forward osmosis tests
An interfacially polymerized polyamide layer was prepared on the outer surface of the hollow fiber membranes (Fig. 6). Table 6 shows the performance results for hollow fiber membranes in a FO system, using sucrose solutions as a draw solution. The water flux values of the hollow fiber membranes prepared with the ionic liquid were slightly higher than for the others. For example, that of HF-20IL 1, which is a hollow fiber membrane prepared with ionic liquid, was about 2 LMH higher than those of the other membranes prepared with DMSO alone (HF-DMSO) and DMF alone (HF-DMS) in the condition of a 1 M sucrose draw solution. The reversible solute flux, which is the amount of permeated solutes from the draw solution to the feed solution through a membrane per membrane area and time, was measured both by refractometry and by vapor pressure osmometry, as shown in Table 6. No reversible sucrose flux was detected in the feed solution for any of the TFC hollow fiber membranes.| Membranes | 1 M sucrose | 2 M sucrose | Thickness (μm) | ||
|---|---|---|---|---|---|
| Water flux (LMH) | Reversible solute flux (gMH) | Water flux (LMH) | Reversible solute flux (gMH) | ||
| Test conditions: 2 M and 1 M sucrose solutions as draw solutions, deionized water as a feed solution, 1 L min−1 as the flow rate, 25 °C as the test temperature, cross-flow, pH 7, and the active layer of the HF membranes facing the feed solution. | |||||
| HF-20IL 1 | 6.7 ± 0.5 | 0 | 5.6 ± 0.5 | 0 | 77 |
| HF-20IL 2 | 6.5 ± 0.5 | 0 | 6.8 ± 0.5 | 0 | 90 |
| HF-20IL 3 | 5.6 ± 0.5 | 0 | 7.0 ± 0.5 | 0 | 108 |
| HF-DMSO | 4.3 ± 0.5 | 0 | 5.3 ± 0.5 | 0 | 71 |
| HF-DMF | 4.4 ± 0.5 | 0 | 6.3 ± 0.5 | 0 | 80 |
4. Conclusion
The estimation of the Gibbs free energy of mixing indicated that the maximum concentration of the ionic liquid which can be added while keeping the polymer solution homogeneous was 42%. This was experimentally confirmed.The cloud point curve denoted that the tendency of the polymer solutions to phase separate with the addition of water is DMSO < DMF < (20/80) IL/DMSO < (30/70) IL/DMSO < (40/60) IL/DMSO.
Hollow fiber membranes were successfully fabricated using less toxic solvents and an ionic liquid. The hollow fiber membranes fabricated with the ionic liquid had a fully-developed finger-like structure and regular patterns on their inner surface. In contrast, membranes prepared without ionic liquid had a porous structure with macrovoids or pear-like cavities, but without regular patterns in their inner surface.
The properties of the polymer solution systems and prepared membranes were characterized. No traces of ionic liquid were found by FTIR. Molecular weight cut-offs of 54 to 67 kg mol−1 were measured for the membranes prepared with ionic liquid. The water permeance was as high as 540 Lm−2 h−1 bar−1.
The hollow fiber membranes were tested in FO measurements, after adding a selective layer by interfacial polymerization. Sucrose solutions were used as draw solutions. The water fluxes of the hollow fiber membranes fabricated with the ionic liquid were higher than those of the other membranes, and no reversible solute flux was measured.
Acknowledgements
This work was sponsored by King Abdullah University of Science and Technology (KAUST). The authors would like to thank Dr Seung–Hak Choi (Saudi Arabian Oil Company, ARAMCO) and Dr Ngoc Lieu Le for their insights and suggestions about the fabrication of membranes and Octavio R Salazar Moya for his valuable discussions, as well as their colleagues for their help on experiments.References
- J. F. Brennecke and E. J. Maginn, AIChE J., 2001, 47, 2384–2389 CrossRef CAS.
- R. Sheldon, Chem. Commun., 2001, 2399–2407, 10.1039/B107270F.
- P. T. Anastas and M. M. Kirchhoff, Acc. Chem. Res., 2002, 35, 686–694 CrossRef CAS PubMed.
- M. Lancaster, Green chemistry: an introductory text, Royal Society of Chemistry, Cambridge, 2002 Search PubMed.
- J. H. Clark, Handbook of Green Chemistry and Technology, Blackwell Science Ltd, 2007, pp. 1–9, DOI:10.1002/9780470988305.ch1.
- The European Chemicals Agency, http://echa.europa.eu.
- E. Drioli, A. Brunetti, G. Di Profio and G. Barbieri, Green Chem., 2012, 14, 1561–1572 RSC.
- A. Figoli, T. Marino, S. Simone, E. Di Nicolo, X. M. Li, T. He, S. Tornaghi and E. Drioli, Green Chem., 2014, 16, 4034–4059 RSC.
- I. T. Horváth and P. T. Anastas, Chem. Rev., 2007, 107, 2169–2173 CrossRef PubMed.
- F. M. Kerton, Alternative Solvents for Green Chemistry, the Royal Society of Chemistry, 2009 Search PubMed.
- A. Mohammad, Green Solvents I: Properties and Applications in Chemistry, Springer, Netherlands, 2012 Search PubMed.
- C. Shui-Ling, C. Guan-Leong, J. Shun-Jun and L. Teck-Peng, in Ionic Liquids in Organic Synthesis, American Chemical Society, 2007, vol. 950, ch. 13, pp. 161–176 Search PubMed.
- N. Sun, M. Rahman, Y. Qin, M. L. Maxim, H. Rodriguez and R. D. Rogers, Green Chem., 2009, 11, 646–655 RSC.
- T. P. Thuy Pham, C.-W. Cho and Y.-S. Yun, Water Res., 2010, 44, 352–372 CrossRef PubMed.
- R. D. Rogers and K. R. Seddon, Science, 2003, 302, 792–793 CrossRef PubMed.
- R. Renner, Environ. Sci. Technol., 2001, 35, 410A–413A CrossRef CAS PubMed.
- S. Zhu, Y. Wu, Q. Chen, Z. Yu, C. Wang, S. Jin, Y. Ding and G. Wu, Green Chem., 2006, 8, 325–327 RSC.
- R. P. Swatloski, S. K. Spear, J. D. Holbrey and R. D. Rogers, J. Am. Chem. Soc., 2002, 124, 4974–4975 CrossRef CAS PubMed.
- J. S. Moulthrop, R. P. Swatloski, G. Moyna and R. D. Rogers, Chem. Commun., 2005, 1557–1559, 10.1039/B417745B.
- S. Livazovic, Z. Li, A. R. Behzad, K. V. Peinemann and S. P. Nunes, J. Membr. Sci., 2015, 490, 282–293 CrossRef CAS.
- B. Wang, Y. Tang, Z. Wen and H. Wang, Eur. Polym. J., 2009, 45, 2962–2965 CrossRef CAS.
- D. Y. Xing, N. Peng and T.-S. Chung, Ind. Eng. Chem. Res., 2010, 49, 8761–8769 CrossRef CAS.
- D. Y. Xing, N. Peng and T.-S. Chung, J. Membr. Sci., 2011, 380, 87–97 CrossRef CAS.
- D. Y. Xing, S. Y. Chan and T.-S. Chung, Green Chem., 2012, 14, 1405–1412 RSC.
- D. Y. Xing, S. Y. Chan and T.-S. Chung, Chem. Eng. Sci., 2013, 87, 194–203 CrossRef CAS.
- R. K. Henderson, C. Jimenez-Gonzalez, D. J. C. Constable, S. R. Alston, G. G. A. Inglis, G. Fisher, J. Sherwood, S. P. Binks and A. D. Curzons, Green Chem., 2011, 13, 854–862 RSC.
- G. Szekely, M. F. Jimenez-Solomon, P. Marchetti, J. F. Kim and A. G. Livingston, Green Chem., 2014, 16, 4440–4473 RSC.
- M. Rubinstein and R. H. Colby, Polymer Physics, OUP, Oxford, 2003 Search PubMed.
- T. Lindvig, M. L. Michelsen and G. M. Kontogeorgis, Fluid Phase Equilib., 2002, 203, 247–260 CrossRef CAS.
- J. E. Mark, Physical properties of polymers handbook, Springer, New York, Array edn, 2007 Search PubMed.
- C. M. Hansen, Hansen solubility parameters: a user's handbook, CRC Press LLC, N.W., Boca Raton, Florida 33431, 2000 Search PubMed.
- J. Biroa, L. Zeman and D. Patterson, Macromolecules, 1971, 4, 30–35 CrossRef.
- A. A. R. Mota, C. C. Gatto, G. Machado, H. C. B. de Oliveira, M. Fasciotti, O. Bianchi, M. N. Eberlin and B. A. D. Neto, J. Phys. Chem. C, 2014, 118, 17878–17889 CAS.
- B. Derecskei and A. Derecskei-Kovacs, Mol. Simul., 2008, 34, 1167–1175 CrossRef CAS.
- A. K. Hołda and I. F. J. Vankelecom, J. Appl. Polym. Sci., 2015, 132, 42130 CrossRef.
- S. P. Nunes and K. V. Peinemann, in Membrane Technology, Wiley-VCH Verlag GmbH & Co. KGaA, 2006, pp. 9–14, DOI:10.1002/3527608788.ch3.
- H. Strathmann and K. Kock, Desalination, 1977, 21, 241–255 CrossRef CAS.
| This journal is © The Royal Society of Chemistry 2016 |


