Creating nanoporosity in silver nanocolumns by direct exposure to radio-frequency air plasma
Abdel-Aziz
El Mel
*a,
Nicolas
Stephant
a,
Jonathan
Hamon
a,
Damien
Thiry
a,
Adrien
Chauvin
a,
Meriem
Chettab
a,
Eric
Gautron
a,
Stephanos
Konstantinidis
b,
Agnès
Granier
a and
Pierre-Yves
Tessier
a
aInstitut des Matériaux Jean Rouxel, Université de Nantes, CNRS, 2 Rue de la Houssinière B.P. 32229, 44322 Nantes cedex 3, France. E-mail: Abdelaziz.elmel@cnrs-imn.fr; Fax: +33 (0)240 373 959; Tel: +33 (0)240 376325
bChimie des Interactions Plasma-Surface (ChIPS), CIRMAP, Research Institute for Materials Science and Engineering, University of Mons, 23 Place du Parc, B-7000 Mons, Belgium
First published on 18th November 2015
Abstract
Nanoporous materials are of great importance for a broad range of applications including catalysis, optical sensors and water filtration. Although several approaches already exist for the creation of nanoporous materials, the race for the development of versatile methods, more suitable for the nanoelectronics industry, is still ongoing. In this communication we report for the first time on the possibility of generating nanoporosity in silver nanocolumns using a dry approach based on the oxidation of silver by direct exposure to a commercially available radio-frequency air plasma. The silver nanocolumns are created by glancing angle deposition using magnetron sputtering of a silver target in pure argon plasma. We show that upon exposure to the rf air plasma, the nanocolumns transform from solid silver into nanoporous silver oxide. We further show that by tuning the plasma pressure and the exposure duration, the oxidation process can be finely adjusted allowing for precisely controlling the morphology and the nanoporosity of the silver oxide nanocolumns. The generation of porosity within the silver nanocolumns is explained according to a cracking-induced oxidation mechanism based on two repeated events occurring alternately during the oxidation process: (i) oxidation of silver upon exposure to the air plasma and (ii) generation of nanocracks and blisters within the oxide layer due to the high internal stress generated within the material during oxidation.
Introduction
With remarkable and enhanced properties compared to solid nanomaterials, porous nanostructures are lately being widely explored for various applications including water desalination,1 Li-ion batteries,2 catalysis,3–5 resistive random access memory6 and optical sensors.7 In addition to the intrinsic characteristics of the material forming the porous nanostructures, the properties and behavior of such nanomaterials were reported to be dependent on the size and the distribution of the nanopores.8,9The way of generating nanoporosity varies from a material to another. For example, to create nanoporous metals, dealloying is the simplest approach that can be used;10,11 on the other hand, to synthesize nanoporous oxides, anodization is the most frequently employed process.12 In some particular cases, wet chemistry-based approaches such as anodization and dealloying, are not tolerated in the processing of nanodevices as the device might be damaged due to its exposure to an acidic electrolyte solution during the fabrication phase of the nanoporous material by dealloying. In the case of anodization, an electrical contact is required to inject the current through the electrolyte making it impossible to apply this process to insulating substrates. For this reason the race towards the development of novel appealing dry approaches to synthesize tailor-made nanoporous materials is ongoing.
The oxidation of metals is a fast growing field covering a broad range of research topics. In general, the final product of the oxidation process varies according to the characteristics of the metal in terms of shape, size and intrinsic properties13–16 as well as the employed oxidation process (e.g., thermal oxidation,14,16–20 oxidation in a liquid phase21 as well as low temperature oxidation using cold plasma processes22). For example, thermally oxidizing bulk or thin films of copper at a temperature above 400 °C allows the formation of single crystal CuO nanowires.16,22–25 On the other hand, by applying thermal oxidation to metal nanostructures, such as nanowires, one can instead transform them into metal oxide nanotubes.26–28 The oxidation approaches based on cold plasma processes are very promising since they allow designing various types of metal oxide nanostructures at very low temperatures.22,29
Through the studies reported so far in the literature, it was made clear that the oxidation behavior varies from one metal to another. This is related to two main issues: (i) the diffusion coefficients of the metal ions and oxygen anions within the oxide layer,13,27,30 and (ii) the internal stress generated within the material during the oxidation process.22,31
Silver has been extensively studied since the 1970s due to its excellent electrical, thermal and optical properties making it an ideal candidate for space applications.32,33 The resistance of silver toward oxygen was tested in spacecraft located at a low earth orbit where the density of atomic oxygen is extremely high (∼108 atoms per cm3 at ∼400 km of altitude).33,34 Through the studies reported so far on this topic, we learned that in contrast to molecular oxygen where a high temperature is required to initiate the oxidation process, silver exhibits a very poor oxidation resistance at low temperature in the presence of atomic oxygen.33,34 In this context, the oxidation of silver is not limited to the surface only but it also proceeds within the bulk of the material. In such a case, however, the volume oxidation of the material is not related to the bulk diffusion of the species (i.e., silver and oxygen ions) but rather to a cracking-assisted oxidation mechanism.35 Such a mechanism can be described according to two repeated events:35,36 (i) formation of a highly stressed silver oxide Ag2O layer on the surface of the silver metal (2Ag + O → Ag2O) and (ii) the formation of cracks and blisters within the Ag2O layer due to the extremely high stress generated during the oxidation process; as a consequence, fresh patches of silver metal present underneath the cracked silver oxide layer will be exposed to atomic oxygen resulting in the formation of new oxide layers lifting the old oxide layers formed in the early stage of the oxidation process. Subsequently, cracks generated within these underlying newly formed oxide layers due to high internal residual stress allows a fresh silver metal surface to be exposed again and again to atomic oxygen. The repeated oxidation and cracking events result in the complete transformation of the metal body to an assembly of cracked and porous flakes made of silver oxide.
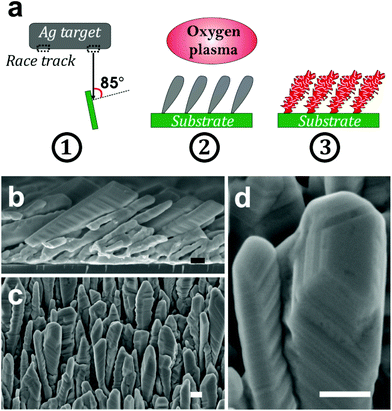
Although the poor resistance of silver toward atomic oxygen is perceived as a major drawback for spacecraft, new applications of silver have emerged based on this property including sensors for the detection of atomic oxygen.37 Despite the fact that the oxidation of silver (i.e., bulk, thin films and nanomaterials) by atomic oxygen was investigated by many groups,33,38 until today no reports have been published on the generation of nanoporosity upon exposure of silver nanomaterials to atomic oxygen. In this work we investigate the oxidation of silver nanostructures upon exposure to atomic oxygen (Fig. 1a). We demonstrate for the first time that nanoporous silver oxide nanostructures can be created at low temperature thanks to the high reactivity of silver toward atomic oxygen, the latter being generated in radio-frequency (rf) air plasma. The silver nanostructures consist of silver nanocolumns grown by glancing angle deposition (GLAD) using magnetron sputtering of a silver target in pure argon plasma.
Experimental details
The silver nanocolumns were grown by glancing angle deposition using a magnetron sputtering tool equipped with a silver target (7.62 cm in diameter and 99.999% in purity). The distance between the target and the top of the tilted substrate was 12 cm. The angle between the normal to the target surface and the normal to the substrate surface was ∼85°. The base pressure before deposition was 10−5 Pa. The deposition time and pressure were fixed to 3 hours and 0.2 Pa, respectively.The oxidation of silver nanocolumns was carried out using a radio-frequency plasma source Evactron® Model 25 De-Contaminator by XEI Scientific, Inc. The source was installed on the preparation chamber of the scanning electron microscope (SEM) used to image the samples. This source is routinely used to remove contaminants from the surface of the samples before SEM imaging; it uses remote rf plasma to produce the desired radicals allowing for eliminating contaminants from the surface. In our case, we used room air as a feeding gas to generate the plasma. The distance between the source and the substrate was 20 mm. For all the experiments, the room humidity was 45% at 300 K which corresponds to a water partial pressure of about 1%.
The SEM images of the nanocolumns were recorded using a JEOL JSM 7600 F microscope operating at 5 kV. The chemical composition of the films was determined by using energy dispersive X-ray spectroscopy (EDS) performed on a JEOL 5800 microscope operating at 15 kV.
The X-ray photoemission spectroscopy (XPS) measurements were carried out on an AXIS Nova from Kratos using a monochromatic Al Kα X-ray source (1486.6 eV). The high resolution spectra were recorded with a pass energy of 20 eV.
Results and discussion
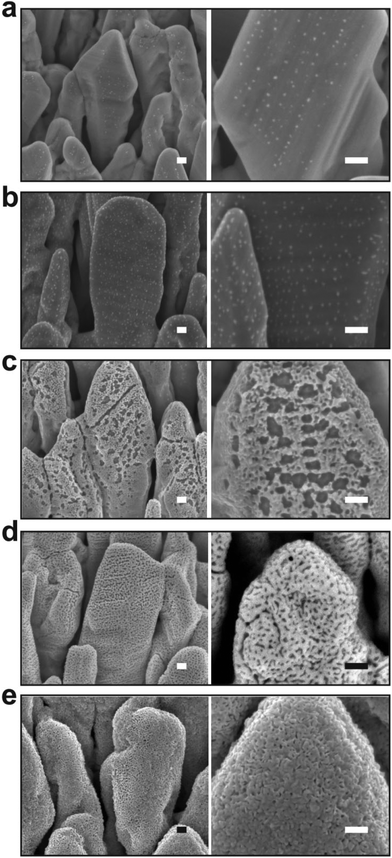
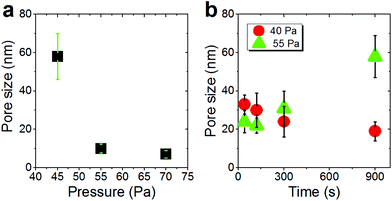
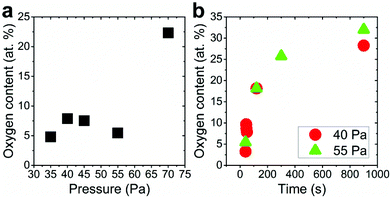
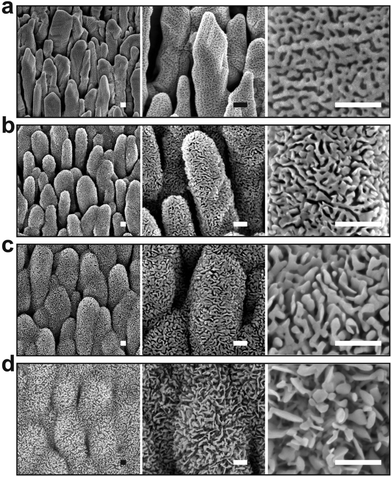
The silver nanocolumn arrays grown by GLAD are shown in Fig. 1b–d. The formation of such nanocolumns instead of a continuous thin film is related to the shadowing effect coming into play during the growth process resulting in the extinction of some columns during the deposition of the material.39 The mean width of the columns at their bases is about 200 nm whereas the mean width of their tips is ∼450 nm. The typical length of the nanocolumns is about 2 μm. When examining these structures at a higher magnification one can easily identify the presence of terraces and atomic steps on the Ag crystal surface (Fig. 1d). These sort of defects may play a central role in the oxidation process of metals.40At first, we aimed to explore the impact of air pressure on the morphology of the nanocolumns. For this purpose, the air pressure was varied between 35 and 70 Pa (Fig. 2) while fixing the oxidation time and the electrical power to 40 s and 20 W, respectively. At 35 Pa, aligned rows of tiny spherical oxide clusters start forming on the surface of the columns (Fig. 2a). The mean size of these spherical clusters is 10 ± 2 nm. Most probably, the cluster alignment observed in this case originates from the presence of aligned steps and terraces on the surface of the as-grown Ag columns since such sites are expected to be more favorable for oxidation than the rest of the silver atoms forming the columns.40 When increasing the air pressure, the amount of the oxide clusters covering the surface of the Ag nanocolumns becomes more important (Fig. 2b). The nanoclusters, however, stay separated from each other. Increasing further the air pressure results in the coalescence of the nanoclusters and a discontinuous layer starts covering the surface (Fig. 2c). Upon reaching 55 Pa, the surface of the columns becomes fully covered with an oxide layer full of pinholes (Fig. 2d). Increasing the air pressure to 70 Pa induces a densification of the oxide layer and a reduction in pore size (Fig. 2e). From the statistical study carried out on several SEM micrographs recorded on each sample, one can follow the evolution of the pore size which decreases from ∼60 nm to ∼5 nm when increasing the pressure from 45 to 70 Pa (Fig. 3a). To follow the evolution of the oxygen content as a function of the air pressure, EDS was employed (Fig. 4a). It is important to stress here that due to the nature of the samples in terms of high roughness and due to the low sensitivity of EDS to light elements such as oxygen, one must be aware of the high incertitude of the obtained values. For this reason, we will use the EDS results only to explain the trend in oxygen content and make a relative comparison between the different samples. As expected, increasing the air pressure results in an increase in the oxygen content in the films. This result indicates that the rate of the oxidation process increases with the oxidation pressure. Since the fraction of atomic oxygen created by the plasma increases with the O2 partial pressure, the main logical consequence to such an increase is the enhancement in the rate of the oxidation process of silver.34
It should be noted here that the other species present in the plasma, such as OH radicals and ozone, may be involved in the oxidation process of silver.41 Although ozone may have a contribution in the formation of nanoporosity, the oxidation process of the silver nanocolumns is expected to be driven mainly by atomic oxygen since the density of ozone in such a low pressure discharge is much lower than the one of atomic oxygen.42 On the other hand, to determine the contribution of the OH radicals in the generation of nanoporosity, a more detailed study must be carried out at different humidity values as well as in pure O2 which can be the subject of a forthcoming study.
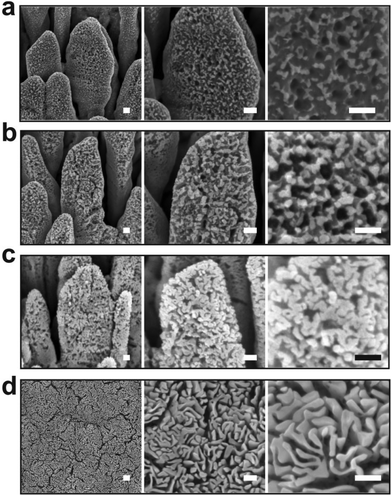
We further investigated the morphological evolution of the nanocolumns upon oxidation at 55 Pa for different durations while fixing the electrical power to 20 W (Fig. 5). For 40 s of treatment, the surface of the nanocolumns becomes fully covered with a porous oxide layer (Fig. 5a). When increasing the oxidation time to 120 s, the porosity becomes more significant as the depth of the formed pores becomes more important (Fig. 5b). Further increasing the oxidation time results in an increase in: (i) the global porosity of the material (pore size increases from ∼25 nm to ∼60 nm, Fig. 3b) and (ii) the width of the nanoligaments forming the porous oxide layer (Fig. 5c). At 900 s of oxidation, the nanocolumns merge together and they become hardly distinguishable (Fig. 5d). At this stage, the porosity is more significant compared to the previous conditions and some sort of elongated oxide nanostructures are found to grow over the surface of the columns. The growth of such elongated oxide nanostructures cannot be explained according to the cracking-induced oxidation mechanism alone. Most likely, a thermal oxidation of silver occurs at this stage of the process; in such a case, the oxidation is driven by the thermal diffusion of silver atoms. We have evaluated the temperature on the substrate during the treatment and it was found to not exceed 80 °C; at such a low temperature, a thermal oxidation mechanism cannot take place. One possible explanation to the observed thermal oxidation mechanism can be the local rise in temperature in the top oxide layer due to the accumulation of heat within it during exposure to the plasma. Since the rise in temperature is localized at the extreme surface, unfortunately it cannot be measured experimentally. This effect is expected to be less significant during the early stage of the oxidation process since the silver metal exhibits a high thermal conductivity compared to silver oxide allowing for evacuating the heat at the beginning of the process.
From the EDS measurements, one can remark that the oxygen content increases sharply from ∼5 to ∼25 at% between 40 and 300 s of treatment and then reaches a plateau between 300 and 900 s (Fig. 4b) at a value lower than the expected value of 33 at% corresponding to Ag2O; this plateau indicates a reduction in the oxidation rate when reaching 300 s which can be related to the coverage of the silver columns by a thick silver oxide layer. Indeed, when the thickness of the oxide layer becomes very important, the length of the transport path of atomic oxygen through the cracks generated within the material becomes more important. For this reason, the oxygen atoms require a longer duration to reach the fresh silver surface existing underneath the silver oxide layer.
The oxidation kinetic at 55 Pa was further compared to the one at 40 Pa (Fig. 6). As demonstrated previously, decreasing the air pressure is expected to reduce the oxygen partial pressure which in turn must impact the rate of the oxidation process. By such a method, the early stages of the oxidation process can be monitored in a more precise manner. In contrast to the sample treated for 40 s at 55 Pa, at 40 Pa the silver nanocolumns oxidize partially and discontinuous oxide nanoligaments form on the surface (Fig. 6a). Beside the formation of oxide nanoligaments, nanoholes are also found to form within the silver metal columns. One can conclude that silver atoms have been extracted from some regions of the silver columns in a non-uniform way before they react with oxygen and form the silver oxide nanoligaments. This reflects the presence of an atomic diffusion mechanism occurring during the oxidation process. These nanoholes were not observed at 55 Pa since the oxidation rate was more important which does not allow us to easily follow this early stage of oxidation. Since during the early stage of the reaction it is expected that the temperature is not high enough to thermally trigger the diffusion of silver, it is more probable that silver atoms migrate due to a field driven diffusion mechanism.28 In such a case the diffusion of the silver atoms is driven by the intrinsic electrical field generated between the silver phase and the oxygen adsorbed on the surface.28
Increasing the oxidation time to 120 s leads to an increase in both the width of the oxide nanoligaments and the diameter of the nanoholes (Fig. 6b). On reaching 300 s, the oxide layer almost covers the entire surface of the silver columns and the nanoholes formed previously within the silver phase are no more visible (Fig. 6c). On reaching 900 s, the structure of the oxide phase changes and a porous material with a maze-like structure can be seen (Fig. 6d). At this stage, the columns merge together and form a single block. While the pore size at 40 Pa showed an opposite evolution to the one observed at 55 Pa (pore size decreases from ∼35 to 20 nm when increasing the oxidation time from 40 to 900 s (Fig. 3b)), the oxygen was found to exhibit a similar evolution as the oxygen content within the films measured by EDS was found to increase with increasing the oxidation time (Fig. 4b).
To probe the chemical state of the oxide phase formed upon oxidation, X-ray photoelectron spectroscopy (XPS) was employed to examine the samples oxidized at 40 Pa. At first, the samples were analyzed without any surface cleaning to avoid any possible modification of the chemical state of the oxide phase as a consequence to the sputter-cleaning using the ion gun (Fig. 7). For all the samples, only silver, oxygen and carbon were detected. The atomic concentrations are provided in Table 1. On increasing the oxidation time from 40 to 900 s, the silver content decreases from 59.4 to 40 at% while the oxygen and carbon content increases (from 13.7 to 27.8 for oxygen and from 26.9 to 32.2 for carbon) (Table 1). In contrast to EDS where no carbon was detected, the presence of carbon in the case of XPS is related to the surface contamination of the samples due to their exposure to the ambient atmosphere during the transfer from the rf plasma chamber toward the XPS tool. The carbon content increases when increasing the treatment time due to the increase in the specific surface area originating from the increase in pore size.
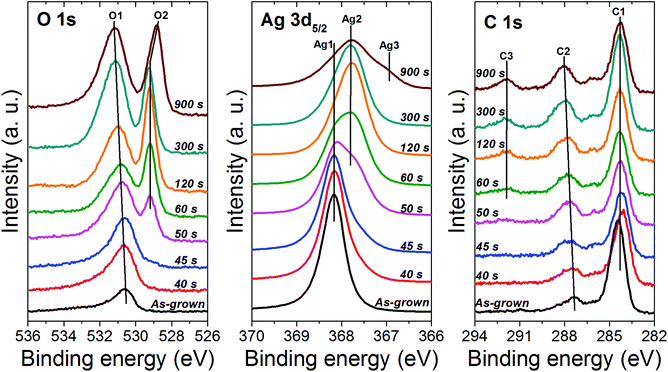 | ||
| Fig. 7 XPS O 1s, Ag 3d5/2 and C 1s spectra recorded on silver nanocolumns oxidized for different durations while fixing the pressure and the electrical power at 40 Pa and 20 W, respectively. | ||
| Sample | Atomic concentration (%) | Binding energy (eV) | ||||||||||
|---|---|---|---|---|---|---|---|---|---|---|---|---|
| O 1s | Ag 3d5/2 | C 1s | ||||||||||
| Time (s) | Ag | O | C | O/Ag | O1 | O2 | Ag1 | Ag2 | Ag3 | C1 | C2 | C3 |
| 0 | 61.1 | 7.6 | 31.3 | 0.12 | 530.6 | — | 368.2 | — | — | 284.4 | 287.3 | — |
| 40 | 59.4 | 13.7 | 26.9 | 0.23 | 530.6 | — | 368.2 | — | — | 284.1 | 287.5 | — |
| 45 | 57.9 | 15.6 | 26.5 | 0.27 | 530.6 | — | 368.2 | — | — | 284.2 | 287.6 | — |
| 50 | 50.7 | 21.8 | 27.5 | 0.43 | 530.7 | 529.2 | 368.1 | 367.7 | — | 284.3 | 287.6 | — |
| 60 | 50.4 | 22.5 | 27.1 | 0.45 | 530.8 | 529.2 | 368.0 | 367.7 | — | 284.4 | 287.7 | 291.9 |
| 120 | 49.1 | 25.9 | 25 | 0.53 | 531.0 | 529.3 | — | 367.7 | — | 284.4 | 287.8 | 291.9 |
| 300 | 39.2 | 33 | 27.8 | 0.84 | 531.2 | 529.3 | — | 367.7 | — | 284.4 | 287.9 | 291.9 |
| 900 | 40 | 27.8 | 32.2 | 0.70 | 531.2 | 528.9 | — | 367.8 | 367.2 | 284.3 | 288 | 291.9 |
When examining the O 1s peak, one can note a clear evolution in the peak position on increasing the oxidation time (Fig. 7). For the reference sample (i.e., as grown silver columns), only one component, denoted as O1 and located at 530.6 eV, is detected; it can be assigned to the contamination layer of chemisorbed oxygen over metallic silver due to the exposure of the sample to ambient atmosphere.41 For 40 and 45 s of oxidation, the position of component O1 stays almost the same (Table 1). On reaching 50 s, O1 slightly shifts toward the high energies and a new component, denoted as O2 appears at 529.2 eV. The component O2 can be assigned to the Ag2O phase.41,43 Between 50 and 300 s, O2 stays almost at the same position whereas O1 keeps shifting towards the high energies until reaching 531.2 eV for 300 s of oxidation; this reflects the presence of adsorbed carbonate species on the surface of the Ag2O phase.41 Similar binding energies were also reported for Ag2CO3.41,44,45 The formation of such a carbonate over the surface of silver oxides is very common and it results from the adsorption of atmospheric CO2![[thin space (1/6-em)]](https://www.rsc.org/images/entities/char_2009.gif) 41 taking place as a consequence to the exposure of our samples to the ambient atmosphere during the transfer from the treatment chamber to the UHV chamber of the XPS machine. One can note that in addition to the shift in the position of O1, the intensity increases considerably indicating an increase in the amount of adsorbed carbonate as the oxidation time increases. This explains the increase in the amount of carbon detected at the surface of the samples which was also found to increase on increasing the oxidation time (Table 1). The reason for the increase in the amount of carbonate with increasing the oxidation time is related to the increase in porosity of the Ag2O phase. As presented previously, increasing the oxidation time leads to an increase in the global porosity of the oxide columns which results in turn in an increase in the specific surface area of the material available for the CO2 adsorption. On reaching 900 s, in addition to the presence of carbonate at the surface of the sample, the component O2 shifts to 528.9 eV indicating the formation of AgO.41,43
41 taking place as a consequence to the exposure of our samples to the ambient atmosphere during the transfer from the treatment chamber to the UHV chamber of the XPS machine. One can note that in addition to the shift in the position of O1, the intensity increases considerably indicating an increase in the amount of adsorbed carbonate as the oxidation time increases. This explains the increase in the amount of carbon detected at the surface of the samples which was also found to increase on increasing the oxidation time (Table 1). The reason for the increase in the amount of carbonate with increasing the oxidation time is related to the increase in porosity of the Ag2O phase. As presented previously, increasing the oxidation time leads to an increase in the global porosity of the oxide columns which results in turn in an increase in the specific surface area of the material available for the CO2 adsorption. On reaching 900 s, in addition to the presence of carbonate at the surface of the sample, the component O2 shifts to 528.9 eV indicating the formation of AgO.41,43
The formation of silver oxides was further confirmed by examining the Ag 3d5/2 peak which was found to evolve as the oxidation time increased (Fig. 7). Referring to the literature, the oxidation states of silver 0 (metal Ag), +1 (Ag2O) and +2 (AgO) correspond to peak positions around 368.1 ± 0.1 eV, 367.7 ± 0.2 eV and 367.4 ± 0.2 eV, respectively.41,46 For the as-grown sample (reference sample), only one peak, denoted as Ag1, was detected at 368.2 eV and it can be assigned to silver metal.41,43 For 40 and 45 s of oxidation, only the silver metal peak, Ag1, was detected. This reflects the very low amount of oxide formed on the surface of the columns (tiny spheres observed with SEM). On reaching 50 s, in addition to Ag1, a shoulder, Ag2, appears at 367.7 eV; it can be attributed to the formation of Ag2O.41 This result is in good agreement with the evolution of the O 1s peak described previously. Increasing further the oxidation time results in the progressive increase in the signal of the Ag2O component (Ag2) and the decrease of the metallic component Ag1. On reaching 120 s, Ag1 disappears and only Ag2 is detected indicating the full transformation of the surface of the samples into Ag2O. While a similar chemical state was revealed for the sample treated for 300 s, on reaching 900 s, in addition to Ag2, a shoulder appears at 367.2 eV indicating the presence of silver in the oxide state +2 (AgO).41 This means that under such conditions the Ag2O and AgO phases coexist.
For the C 1s peak, two components were detected in the case of the as-grown sample (reference sample) (Fig. 7). The peak positions (∼284 and ∼286 eV) listed in Table 1 are characteristics of the carbon contamination layer adsorbed on the surface due to the exposure of the material to the ambient atmosphere. The same components were also observed for the samples treated between 40 and 50 s. On reaching 60 s, a feature at 291.9 eV appears indicating the adsorption of carboxyl groups at the surface;41 the intensity of this component was found to increase with increasing the oxidation time reflecting the increase in the amount of the adsorbed contaminants at the surface. One must mention here that the C 1s peak was found to completely disappear as the samples were gently sputter-cleaned in situ using an argon ion gun (not presented here); this was also accompanied by the disappearance of the component O1 of the O 1s peak related to the presence of carbonates at the surface. Although the sputter-cleaning was very soft, it was found to modify the chemical state of the oxide phase due to the preferential sputtering effect commonly encountered with oxide materials.
Conclusions
In summary, we have studied the oxidation of silver nanocolumns, grown by glancing angle deposition, upon exposure to atomic oxygen generated using a radio-frequency air plasma. The results showed that the nanocolumns can be easily transformed from solid silver into a nanoporous silver oxide phase. The oxidation of silver was explained according to a cracking-induced oxidation mechanism. We demonstrated that the final porosity of the oxide phase can be controlled by finely tuning the treatment time and pressure. More precisely, at the lowest pressures used in this study (less than or equal to 40 Pa) and for a short treatment duration (40 s) the column surface can be decorated with tiny spheres of silver oxide. We further show that on exceeding 45 Pa, a nanoporous silver oxide layer with a maze-like structure covers the surface of the columns; we further demonstrate that in such a case the size and shape of the pores are dependent on the oxidation duration. The XPS study has shown that according to the treatment time, silver can be found in different oxidation states: 0, +1 or +2. The work presented in this communication paves the way for a broad range of perspectives. An obvious perspective is to apply this approach to other type of nanostructures such as nanowires and nanospheres. The dimensions of the nanostructures must play a key role in the conversion process from solid to porous.In terms of application, sensors of atomic oxygen may be developed using silver nanocolumns; such sensors are expected to provide an enhanced sensitivity to atomic oxygen compared to compact films due to the highly active specific surface area of the nanostructures.
Acknowledgements
F. Petitgas (IMN, Nantes-France) is gratefully acknowledged for his technical assistance to operate the magnetron sputtering system. S. K. is a research associate of the National Science Foundation of Belgium (FNRS). A.-A. El Mel would like to thank T. Belmonte (Institut Jean Lamour, Nancy-France) for the fruitful discussions on the oxidation of metal nanostructures. D. Thiry would like to thank “la Région des Pays de la Loire-France” for financially assisting this research project through the “Post-Doctorats internationaux” program.Notes and references
- D. Cohen-Tanugi and J. C. Grossman, Nano Lett., 2012, 12, 3602–3608 CrossRef CAS PubMed.
- Y. Yu, L. Gu, X. Lang, C. Zhu, T. Fujita, M. Chen and J. Maier, Adv. Mater., 2011, 23, 2443–2447 CrossRef CAS PubMed.
- X. Ge, L. Chen, J. Kang, T. Fujita, A. Hirata, W. Zhang, J. Jiang and M. Chen, Adv. Funct. Mater., 2013, 23, 4156–4162 CrossRef CAS.
- H. J. Qiu, H.-T. Xu, L. Liu and Y. Wang, Nanoscale, 2015, 7, 386–400 RSC.
- P. Anandha Ganesh and D. Jeyakumar, Nanoscale, 2014, 6, 13012–13021 RSC.
- G. Wang, Y. Yang, J.-H. Lee, V. Abramova, H. Fei, G. Ruan, E. L. Thomas and J. M. Tour, Nano Lett., 2014, 14, 4694–4699 CrossRef CAS PubMed.
- L. Zhang, H. Chang, A. Hirata, H. Wu, Q.-K. Xue and M. Chen, ACS Nano, 2013, 7, 4595–4600 CrossRef CAS PubMed.
- J. Chmiola, G. Yushin, Y. Gogotsi, C. Portet, P. Simon and P. L. Taberna, Science, 2006, 313, 1760–1763 CrossRef CAS PubMed.
- W.-S. Chae, D. V. Gough, S.-K. Ham, D. B. Robinson and P. V. Braun, ACS Appl. Mater. Interfaces, 2012, 4, 3973–3979 CAS.
- A. Wittstock, J. Biener, J. Erlebacher and M. Bäumer, Nanoporous Gold : From an Ancient Technology to a High-Tech Material, RSC, 2012 Search PubMed.
- A.-A. El Mel, F. Boukli-Hacene, L. Molina-Luna, N. Bouts, A. Chauvin, D. Thiry, E. Gautron, N. Gautier and P.-Y. Tessier, ACS Appl. Mater. Interfaces, 2015, 7, 2310–2321 CAS.
- W. Lee, K. Schwirn, M. Steinhart, E. Pippel, R. Scholz and U. Gosele, Nat. Nanotechnol., 2008, 3, 234–239 CrossRef CAS PubMed.
- A.-A. El Mel, R. Nakamura and C. Bittencourt, Beilstein J. Nanotechnol., 2015, 6, 1348–1361 CrossRef CAS PubMed.
- B. D. Anderson and J. B. Tracy, Nanoscale, 2014, 6, 12195–12216 RSC.
- J. G. Railsback, A. C. Johnston-Peck, J. Wang and J. B. Tracy, ACS Nano, 2010, 4, 1913–1920 CrossRef CAS PubMed.
- G. Filipič and U. Cvelbar, Nanotechnology, 2012, 23, 194001 CrossRef PubMed.
- R. Nakamura, G. Matsubayashi, H. Tsuchiya, S. Fujimoto and H. Nakajima, Acta Mater., 2009, 57, 4261–4266 CrossRef CAS.
- H. Zhang, X. Deng, J. Zhang, D. Xue, Y. Huang, F. Bai, B. Inkson and Y. Peng, J. Mater. Chem. C, 2015, 3, 5389–5397 RSC.
- L. Yuan, Y. Wang, R. Mema and G. Zhou, Acta Mater., 2011, 59, 2491–2500 CrossRef CAS.
- L. Yuan, R. Cai, J. I. Jang, W. Zhu, C. Wang, Y. Wang and G. Zhou, Nanoscale, 2013, 5, 7581–7588 RSC.
- M. Varon, I. Ojea-Jimenez, J. Arbiol, L. Balcells, B. Martinez and V. F. Puntes, Nanoscale, 2013, 5, 2429–2436 RSC.
- A. Altaweel, G. Filipič, T. Gries and T. Belmonte, J. Cryst. Growth, 2014, 407, 17–24 CrossRef CAS.
- A. A. E. Mel, M. Buffière, N. Bouts, E. Gautron, P. Y. Tessier, K. Henzler, P. Guttmann, S. Konstantinidis, C. Bittencourt and R. Snyders, Nanotechnology, 2013, 24, 265603 CrossRef PubMed.
- X. Jiang, T. Herricks and Y. Xia, Nano Lett., 2002, 2, 1333–1338 CrossRef CAS.
- A.-A. El Mel, L. Molina-Luna, M. Buffière, P.-Y. Tessier, K. Du, C.-H. Choi, H.-J. Kleebe, S. Konstantinidis, C. Bittencourt and R. Snyders, ACS Nano, 2014, 8, 1854–1861 CrossRef CAS PubMed.
- A.-A. El Mel, M. Buffière, P.-Y. Tessier, S. Konstantinidis, W. Xu, K. Du, I. Wathuthanthri, C.-H. Choi, C. Bittencourt and R. Snyders, Small, 2013, 9, 2838–2843 CrossRef CAS PubMed.
- R. Nakamura, G. Matsubayashi, H. Tsuchiya, S. Fujimoto and H. Nakajima, Acta Mater., 2009, 57, 5046–5052 CrossRef CAS.
- Y. Ren, W. K. Chim, S. Y. Chiam, J. Q. Huang, C. Pi and J. S. Pan, Adv. Funct. Mater., 2010, 20, 3336–3342 CrossRef CAS.
- D. Kuete Saa, R. P. Cardoso, F. Kosior, A. Al Taweel, T. Gries, S. Laminsi and T. Belmonte, Surf. Coat. Technol., 2014, 255, 3–7 CrossRef CAS.
- R. Nakamura, D. Tokozakura, H. Nakajima, J.-G. Lee and H. Mori, J. Appl. Phys., 2007, 101, 074303 CrossRef.
- R. Mema, L. Yuan, Q. Du, Y. Wang and G. Zhou, Chem. Phys. Lett., 2011, 512, 87–91 CrossRef CAS.
- W. M. Moore and P. J. Codella, J. Phys. Chem., 1988, 92, 4421–4426 CrossRef CAS.
- M. L. Zheludkevich, A. G. Gusakov, A. G. Voropaev, A. A. Vecher, E. N. Kozyrski and S. A. Raspopov, Oxid. Met., 2004, 61, 39–48 CrossRef CAS.
- M. L. Zheludkevich, A. G. Gusakov, A. G. Voropaev, A. A. Vecher, E. N. Kozyrski and S. A. Raspopov, in Protection of Materials and Structures from Space Environment, ed. J. Kleiman and Z. Iskanderova, Springer, Netherlands, 2003, vol. 5, ch. 30, pp. 351–358 Search PubMed.
- A. d. Rooij, ESA J., 1989, 13, 363 Search PubMed.
- D. L. Edwards, J. R. Williams, A. T. Fromhold, P. A. Barnes, J. P. Wey, W. C. Neely and A. F. Whitaker, Nucl. Instrum. Methods Phys. Res., Sect. B, 1993, 79, 676–679 CrossRef.
- R. J. Thomas and D. J. Baker, Can. J. Phys., 1972, 50, 1676–1681 CrossRef CAS.
- L. Li, J. C. Yang and T. K. Minton, J. Phys. Chem. C, 2007, 111, 6763–6771 CAS.
- M. M. Hawkeye, M. T. Taschuk and M. J. Brett, in Glancing Angle Deposition of Thin Films, John Wiley & Sons, Ltd, 2014, pp. 1–30, DOI:10.1002/9781118847510.ch1.
- L. Li, L. Luo, J. Ciston, W. A. Saidi, E. A. Stach, J. C. Yang and G. Zhou, Phys. Rev. Lett., 2014, 113, 136104 CrossRef PubMed.
- G. I. N. Waterhouse, G. A. Bowmaker and J. B. Metson, Appl. Surf. Sci., 2001, 183, 191–204 CrossRef CAS.
- M. Daniil, G. Vasco, G. Olivier, B. Jean-Paul and R. Antoine, Plasma Sources Sci. Technol., 2013, 22, 055018 CrossRef.
- L. S. Kibis, A. I. Stadnichenko, E. M. Pajetnov, S. V. Koscheev, V. I. Zaykovskii and A. I. Boronin, Appl. Surf. Sci., 2010, 257, 404–413 CrossRef CAS.
- V. K. Kaushik, J. Electron Spectrosc. Relat. Phenom., 1991, 56, 273–277 CrossRef CAS.
- W. S. Epling, G. B. Hoflund and G. N. Salaita, J. Phys. Chem. B, 1998, 102, 2263–2268 CrossRef CAS.
- G. Schön, Acta Chem. Scand., 1973, 27, 24 CrossRef.
| This journal is © The Royal Society of Chemistry 2016 |

