Synthesis of SnO2 pillared carbon using long chain alkylamine grafted graphene oxide: an efficient anode material for lithium ion batteries†
M. Jeevan Kumar
Reddy
,
Sung Hun
Ryu
and
A. M.
Shanmugharaj
*
Department of Chemical Engineering, Kyung Hee University, Yongin-si, Gyeonggi-do 446-701, Republic of Korea. E-mail: shanmughar@gmail.com; Tel: +82-31-201-3342
First published on 16th November 2015
Abstract
With the objective of developing new advanced composite materials that can be used as anodes for lithium ion batteries (LIBs), herein we describe the synthesis of SnO2 pillared carbon using various alkylamine (hexylamine; dodecylamine and octadecylamine) grafted graphene oxides and butyl trichlorotin precursors followed by its calcination at 500 °C for 2 h. While the grafted alkylamine induces crystalline growth of SnO2 pillars, thermal annealing of alkylamine grafted graphene oxide results in the formation of amorphous carbon coated graphene. Field emission scanning electron microscopy (FE-SEM) results reveal the successful formation of SnO2 pillared carbon on the graphene surface. X-ray diffraction (XRD), transmission electron microscopy (TEM) and Raman spectroscopy characterization corroborates the formation of rutile SnO2 crystals on the graphene surface. A significant rise in the BET surface area is observed for SnO2 pillared carbon, when compared to pristine GO. Electrochemical characterization studies of SnO2 pillared carbon based anode materials showed an enhanced lithium storage capacity and fine cyclic performance in comparison with pristine GO. The initial specific capacities of SnO2 pillared carbon are observed to be 1379 mA h g−1, 1255 mA h g−1 and 1360 mA h g−1 that decrease to 750 mA h g−1, 643 mA h g−1 and 560 mA h g−1 depending upon the chain length of grafted alkylamine on the graphene surface respectively. Electrochemical impedance spectral analysis reveals that the exchange current density of SnO2 pillared carbon based electrodes is higher, corroborating its enhanced electrochemical activity in comparison with GO based electrodes.
1 Introduction
Recently, high-performance lithium-ion batteries (LIBs) have been widely investigated for promoting the development of electric vehicles (EVs) and hybrid electric vehicles (HEVs) worldwide. As important components, electrode materials are crucial for the overall performance of LIBs. Due to the low specific capacity (372 mA h g−1), the traditional graphite anode has hindered further development of LIBs with high energy density.1 Among numerous new candidates for anode materials, tin dioxide (SnO2) is believed to be a promising substitution for commercial graphite owing to its high theoretical lithium storage capacity (782 mA h g−1), low cost and safe working potential (a few hundreds of millivolts higher than Li+/Li).2,3 However, the large volume expansion (∼300%) of SnO2 during long-term charge–discharge cycling resulted in undesirable rapid capacity fading, a low initial coulombic efficiency and poor rate performance that limit its practical applications.4,5 The large volume expansion upon cycling, leads to disintegration and pulverization of the electrode, resulting in the breakdown of the electrical contact between the active Sn and conductive additives or the current collector.6–8 Apart from this fact, SnO2 may react electrochemically with lithium ions leading to the formation of active Sn particles, which are easily aggregated into large inactive Sn clusters during lithium intercalation and deintercalation processes.9 All these factors result in deterioration of the electrode structure and decay of electrochemical properties.A facile strategy to alleviate the pulverization problem of SnO2 and to sustain the electrode stability is to use nanostructured SnO2 materials. As compared with bulk materials, nanomaterials can lower the absolute volume change, increase the electrode–electrolyte contact area, shorten the distance for Li-ion diffusion within the particles and enhance the electron transport. Significant research studies on SnO2 nanostructured materials including nanowires,7,8 nanotubes,9 hollow structures,10 core–shell,11,12 nanosheets,13,14 nanobelts,15,16 quantum dots,17,18etc. were reported.
Graphene, the two dimensional lattice of carbon, has become a most attractive material over the past few years due to its large theoretical surface area (∼2630 m2 g−1), good electronic conductivity, mechanical properties and high electrochemical stability.19–22 Significant research has been done on graphene based anode materials in which graphene has been used as a matrix for nanoparticle impregnation leading to the formation of core–shell nanostructures23–27 or three dimensional arrays of graphene–nanoparticle hybrids.28–32 Although, graphene buffers the changes in nanoparticle volume swelling, nanoparticles are still prone to aggregation upon cycling. To overcome this issue, confinement of individual nanoparticles on graphene shell is necessary, which can be achieved through in situ synthetic approaches using nanoparticle precursors and some structure directing agents. Wang et al.33 applied in situ synthetic approaches to obtain a homogeneous distribution of Sn nanoparticles in graphene sheets. These anode materials showed an enhanced capacity and reversibility (508 mA h g−1 for 100 cycles) compared to electrodes prepared using bare graphene (255 mA h g−1 for 100 cycles) or Sn nanoparticles (failed in 10 cycles). Alternatively, Shanmugharaj et al.,34 adopted in situ synthetic approaches to prepare graphene–silver nanoparticle hybrids with enhanced electrochemical performances (714 mA h g−1 for 50 cycles) using a microwave heating technique. Yang et al.35 synthesized graphene encapsulated Co3O4 anode materials with remarkable lithium storage performance, self-assembled through electrostatic forces.
Three dimensional (3D) porous electrode materials demonstrate stable cycling due to a large electrolyte-accessible surface area, short Li-ion diffusion length and high electron conductivity.36,37 Recently, Wang et al.38 have reported the synthesis procedure of porous silicon microspheres prepared by a hydrolysis process and showed excellent reversible capacity with drastic improvement in electrochemical stability. A recent report by Matsuo and Konishi39 has revealed that the carbon pillared structure obtained by pyrolysis of silylated graphite oxide leads to the development of a porous structure with a uniform distribution of pores. Interestingly, no report is available on the synthesis of SnO2 nanopillared carbon structures. Recently, Shanmugharaj et al.40,41 have reported a facile route for the synthesis of long chain alkylamine grafted graphene oxide and its influence on the properties of polymer nanocomposites. In the present report, we attempted to synthesize SnO2 nanopillared carbon structures using alkylamine grafted graphene oxide as a template and investigated for its electrochemical performances by fabricating lithium-ion batteries using the synthesized pillared structures as anode materials with lithium metal as the counter and the reference electrode. We have also investigated the role of the grafted alkylamine chain length (hexylamine; dodecylamine and octadecylamine) on the SnO2 nanopillar formation in the GO templates and its role in electrochemical performances.
2 Experimental
2.1 Materials and synthesis
2.2 Preparation of graphene oxide
Graphene oxide (GO) was prepared from natural graphite (Sigma Aldrich) by using the improved synthesis method suggested by Tour et al.,42 In the improved GO synthesis method, a 9![[thin space (1/6-em)]](https://www.rsc.org/images/entities/char_2009.gif) :
:![[thin space (1/6-em)]](https://www.rsc.org/images/entities/char_2009.gif) 1 mixture of concentrated sulfuric acid/phosphoric acid (H2SO4/H3PO4) (540
1 mixture of concentrated sulfuric acid/phosphoric acid (H2SO4/H3PO4) (540![[thin space (1/6-em)]](https://www.rsc.org/images/entities/char_2009.gif) :
:![[thin space (1/6-em)]](https://www.rsc.org/images/entities/char_2009.gif) 60 mL) was added to a mixture of graphite flakes (5.0 g, 1.7 wt equiv.) and KMnO4 (30.0 g, 10 wt equiv.), producing a slight exotherm to 35–40 °C. The reaction mixture was then heated to 50 °C and stirred for 12 h. The reaction mixture was cooled to room temperature and poured onto ice (∼500 mL) with 30% hydrogen peroxide (H2O2, Alfa Aesar) (5 mL). The final solution was washed with ethanol, water and finally with acetone. The final product was dried at room temperature in a vacuum (40 mmHg)42 to obtain a pale green coloured powder.
60 mL) was added to a mixture of graphite flakes (5.0 g, 1.7 wt equiv.) and KMnO4 (30.0 g, 10 wt equiv.), producing a slight exotherm to 35–40 °C. The reaction mixture was then heated to 50 °C and stirred for 12 h. The reaction mixture was cooled to room temperature and poured onto ice (∼500 mL) with 30% hydrogen peroxide (H2O2, Alfa Aesar) (5 mL). The final solution was washed with ethanol, water and finally with acetone. The final product was dried at room temperature in a vacuum (40 mmHg)42 to obtain a pale green coloured powder.
2.3 Synthesis of alkylamine grafted graphene oxide
GO (2 g) was dispersed in 400 mL of thionyl chloride and heated at 70 °C for 24 h in the presence of 1 mL of dimethyl formamide to generate GO–COCl. After purification, 1 g of GO–COCl was dispersed in ethanol containing 4 g of hexylamine, and the suspension was sonicated for 2 h at 60 °C. After cooling to room temperature, excess hexylamine was removed by washing with ethanol several times. The remaining solid was separated by filtration using a 0.2 μm membrane filter. The collected solid was again washed with ethanol several times and dried at 60 °C under vacuum to generate hexylamine grafted GO powders (GO-6).40,41 Similar synthesis steps were followed in preparing dodecylamine (GO-12) and octadecylamine grafted graphene oxide samples (GO-18).2.4 Synthesis of SnO2 pillared carbon using alkylamine grafted graphene oxide
About 1 g of hexylamine grafted graphene oxide (GO-6) was dispersed in 100 mL of dry toluene (water content <30 ppm) by ultrasonication for 30 minutes. After sonication, 90 mL of N-butyl tin trichloride (Sigma Aldrich) solution was added and allowed to stand for 2 days at 60 °C in an oven under dynamic vacuum. After centrifugation at 4000 rpm for 20 min, the samples were washed with dry toluene, ethanol and finally with acetone to obtain SnO2 pillared graphene oxide. The above procedure was repeated three times to obtain a uniform distribution of SnO2 pillars on the GO surface with good crystallinity and a uniform distribution of SnO2 pillars on the GO surface. The dried product obtained in the above process is calcined at 500 °C for one hour with a heating rate of 5 °C per minute under an inert argon atmosphere to form a black coloured powder consisting of a uniform distribution of SnO2 pillars in the thermally reduced graphene oxide (SnO2-GNs-6). Similar synthesis steps were followed in preparing SnO2 pillared carbons (SnO2-GNs-12 and SnO2-GNs-18) using dodecylamine (GO-12) and octadecylamine (GO-18) grafted GO samples.2.5 Characterization and morphological studies
To understand the morphology of the synthesized GO, the SnO2-GNs-6, SnO2-GNs-12 and SnO2-GNs-18 samples were deposited onto a carbon coated copper grid or silicon wafer using a particle dispersant (dispersed in ethanol), dried in a hot air oven, and then observed using field emission transmission electron microscopy (FE-TEM, JEM-2100F, JEOL) and field emission scanning electron microscopy (FE-SEM, Leo Supra 55, Genesis 2000). Powder X-ray diffraction (XRD) analysis of the GO, SnO2-GNs-6, SnO2-GNs-12 and SnO2-GNs-18 samples in the 2θ ranges of 10–80° was carried out using a D8 advance diffractometer (Bruker) equipped with a Cu target (40 kV, 20 mA, Kα1 = 1.54 Å). Surface elemental compositions of the GO, SnO2-GNs-6, SnO2-GNs-12 and SnO2-GNs-18 samples were determined using X-ray photoelectron spectroscopy (XPS, K-Alpha, Thermoelectron). The samples for XPS measurements were prepared by casting the particle dispersant (dispersed in ethanol) onto silicon wafer followed by drying under vacuum at 70 °C. The synthesized GO, SnO2-GNs-6, SnO2-GNs-12 and SnO2-GNs-18 samples were also characterized by Fourier Transform Infrared Spectroscopy (FT-IR, Spectrum one, Perkin-Elmer) by the KBr pellet method. Thermogravimetric analysis (TGA) of the GO, SnO2-GNs-6, SnO2-GNs-12 and SnO2-GNs-18 samples was characterized in the temperature range of 25–900 °C at a heating rate of 10 °C min−1 in an air environment using TA instruments (TGA Q5000 IR/SDT Q600). The specific surface areas of synthesized GO, SnO2-GNs-6, SnO2-GNs-12 and SnO2-GNs-18 were determined with a surface-area analyzer (BEL Sorp-II mini, BEL Japan Co., Japan) by the Brunauer–Emmett–Teller (BET) method.The electrochemical performances of materials GO, SnO2-GNs-6, SnO2-GNs-12, SnO2-GNs-18 and nano-SnO2 (procured from Sigma Aldrich Inc., Korea) were measured by fabricating 2032-type coin Li-ion half cells. Electrodes were prepared by casting a slurry with a composition of 80 wt% of the active material, 10 wt% of super P (TIMCAL) as an additional conductive agent and 10 wt% of poly (vinylidene difluoride) (PVDF) (Kureha KF100) as a binder onto copper foil, which acts as the current collector. The slurry was prepared by grinding the mixture in the presence of N-methyl pyrrolidone (NMP) solvent using a mortar for 15 min. The viscous slurry coated onto copper foil was dried in an oven at 100 °C for 5 h. The dried electrode was pressed under a 7 T load and then punched out with a size of 16 mm in diameter. The electrode was assembled into a 2032 type coin type cell with 1 M LiPF6 solution in a 1![[thin space (1/6-em)]](https://www.rsc.org/images/entities/char_2009.gif) :
:![[thin space (1/6-em)]](https://www.rsc.org/images/entities/char_2009.gif) 1 (volume) mixture of ethylene carbonate (EC) and diethyl carbonate (DEC) (Merck Co.) as an electrolyte. Metallic lithium foil was used as the counter and the reference electrode. Electrochemical properties of the coin type cells were studied using galvanostatic charge and discharge measurements in the voltage range of 0.1–2.0 V vs. Li/Li+ using a Wonatech battery analyzer. Cyclic voltammetry curves were measured with a scan rate of 0.1 mV s−1 within the range of 0.1–1.25 V using an electrochemical workstation (VersaSTAT 3 Electrochemical System). Electrochemical impedance studies of the Li-ion coin cells were performed using an electrochemical workstation (VersaSTAT 3 Electrochemical System) by applying a sine wave with an amplitude of 5.0 mV in the frequency range of 100 kHz to 0.01 Hz.
1 (volume) mixture of ethylene carbonate (EC) and diethyl carbonate (DEC) (Merck Co.) as an electrolyte. Metallic lithium foil was used as the counter and the reference electrode. Electrochemical properties of the coin type cells were studied using galvanostatic charge and discharge measurements in the voltage range of 0.1–2.0 V vs. Li/Li+ using a Wonatech battery analyzer. Cyclic voltammetry curves were measured with a scan rate of 0.1 mV s−1 within the range of 0.1–1.25 V using an electrochemical workstation (VersaSTAT 3 Electrochemical System). Electrochemical impedance studies of the Li-ion coin cells were performed using an electrochemical workstation (VersaSTAT 3 Electrochemical System) by applying a sine wave with an amplitude of 5.0 mV in the frequency range of 100 kHz to 0.01 Hz.
3 Results and discussion
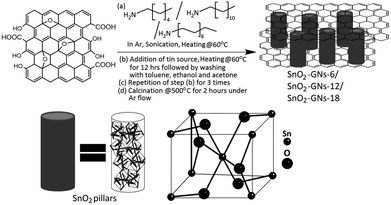
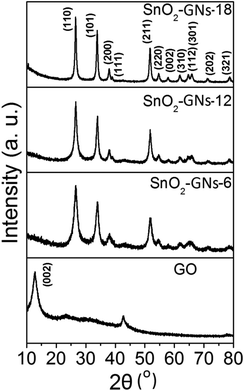
The synthesis of GO from natural graphite by an improved synthesis method is described in section 2.2. Synthesized GO is a non-stoichiometric material with many oxygen-containing functional groups such as phenolic –OH, epoxy, carbonyl, and carboxylic acid groups dispersed both at the basal planes and along the edges.43 As chemically prepared GO consists of epoxy groups in its basal plane and carboxylic sites at the edges, it can be expected that nucleophilic substitution reactions between epoxy and alkylamines (hexylamine, dodecylamine and octadecylamine) predominated in the basal planes of GO sheets and amidation reactions occurred preferentially at the edges of the GO sheets.40,41 Depending upon the chain length of grafted alkylamines, it forms a random configuration (GO-6) or a tilted configuration (∼54°) with crystalline orientations (GO-12 & GO-18).40,44 Addition of N-butyl tin trichloride (C4H9SnCl3) to the alkylamine grafted graphene oxide sheets (GO-6; GO-12 and GO-18) resulted in the appearance a SnO2 pillared structure (SnO2-GNs-6, SnO2-GNs-12 and SnO2-GNs-18) as shown in schematic representation (Fig. 1).It is expected that the hydroxyl groups (–OH) generated during the nucleophilic substitution reaction act as the active site for SnO2 nuclei formation and the strong hydrophobic interaction between the grafted long chain alkylamine and the butyl group of the tin source (C4H9SnCl3) serve as the structure directing site for pillar formation. Matsuo and Konishi39 corroborated the formation of silsesquioxane pillared carbon through the reaction between methyl trichlorosilane and graphene oxide and they also reported that the introduction of alkylamines resulted in a change in the orientation of the pillared structure. In the present study, since the chain length of grafted alkylamine > 6, SnO2 pillars formed on the GO surface may be of a perpendicular configuration as shown in the scheme (Fig. 1). To gain more insights into the crystallinity of SnO2 pillars grown on the alkylamine grafted GO, XRD characterization in the 2θ range of 10°–80° has been carried out and the results are displayed in Fig. 2. Pristine GO showed a strong peak at 2θ of 12.7° corresponding to the (002) interlayer d-spacing of 7.0 Å.45 Alternatively, appearance of several strong peaks at 2θ values of 26.6°, 33.8°, 37.9°, 38.9°, 44.9°, 51.8°, 54.7°, 57.8°, 61.9°, 64.7°, 65.9° and 71.3°, are attributed to the (110), (101), (200), (111), (211), (220), (002), (310), (112), (301), (202) and (321) planes of tetragonal rutile SnO2 (ICDD-JCPDS Card no.88-0287), indicating the formation of SnO2 crystals.46 However, the absence of diffraction peaks corresponding to graphene in the measured diffraction range is possibly due to the formation of the SnO2 pillar, which acted as a spacer to separate the GO sheets resulting in a decrease of the restacking problems in the SnO2 pillared carbons. It is interesting to observe that the crystallinity of SnO2 pillared carbon varies with the chain length of the grafted alkylamine on the GO surface. A significant improvement in crystallinity is observed on increasing the chain length of the grafted alkylamine on the GO surface (SnO2-GNs-6 < SnO2-GNs-12 < SnO2-GNs-18) and this fact may be attributed to the crystalline orientation of long chain alkylamines (GO-12 & GO-18) on the graphene surface that induces the crystalline growth of SnO2 pillars on the GO surface. The crystalline domain sizes of the SnO2 pillared carbon were calculated using the well-known Scherrer's formula:47
D = Kλ/β![[thin space (1/6-em)]](https://www.rsc.org/images/entities/char_2009.gif) cos cos![[thin space (1/6-em)]](https://www.rsc.org/images/entities/char_2009.gif) θ θ | (1) |
The average crystalline sizes are observed to be 5.2 nm (SnO2-GNs-6), 6.9 nm (SnO2-GNs-12) and 12.3 nm (SnO2-GNs-18), which further support the enhancement of the crystallinity of SnO2 pillars on the graphene surface induced by grafted alkylamine chains.
The surface chemical composition and the nature of the interaction between SnO2 and alkylamine modified GO (SnO2-GNs-6; SnO2-GNs-12 and SnO2-GNs-18) were determined using Fourier transform infrared spectroscopy (FT-IR) and the results are displayed in Fig. S1.† Pristine GO showed major IR stretching vibrations at 1710, 1630, 1217 and 1050 cm−1, which correspond to the –C![[double bond, length as m-dash]](https://www.rsc.org/images/entities/char_e001.gif) O stretching (–COOH group), C–C stretching (aromatic group), C–O stretching (C–OH group), and C–O–C stretching (epoxy group) vibrations (Fig. S1†). Grafting of long chain alkylamines (hexylamine, dodecylamine and octadecylamine) on the GO surface resulted in the appearance of intense peaks at around 3500 cm−1 (–NH stretching), 2925 cm−1 (–CH asymmetric stretching), 2855 cm−1 (–CH symmetric stretching), 1580 cm−1 (C
O stretching (–COOH group), C–C stretching (aromatic group), C–O stretching (C–OH group), and C–O–C stretching (epoxy group) vibrations (Fig. S1†). Grafting of long chain alkylamines (hexylamine, dodecylamine and octadecylamine) on the GO surface resulted in the appearance of intense peaks at around 3500 cm−1 (–NH stretching), 2925 cm−1 (–CH asymmetric stretching), 2855 cm−1 (–CH symmetric stretching), 1580 cm−1 (C![[double bond, length as m-dash]](https://www.rsc.org/images/entities/char_e001.gif) O stretching of the amide group), 1207 cm−1 (C–O stretching of the C–OH group) and at 1100 cm−1 (C–N stretching) corroborating successful grafting of these alkylamines on the GO surface (fig. not shown).40 Appearance of new peaks at 1410 cm−1 (Sn–O–Sn overtone, 2γabs),48 630–690 cm−1 (O–Sn–O stretching)49 and at ∼520 cm−1 (Sn–C stretching)48 in the SnO2-GNs-6, SnO2-GNs-12 and SnO2-GNs-18 samples corroborates the successful formation of SnO2 pillared structures on the alkylamine grafted GO (Fig. S1†). To gain more insights into the surface chemical composition of SnO2 pillared carbon, XPS characterization was done and the results are displayed in Fig. S2† and Fig. 3.
O stretching of the amide group), 1207 cm−1 (C–O stretching of the C–OH group) and at 1100 cm−1 (C–N stretching) corroborating successful grafting of these alkylamines on the GO surface (fig. not shown).40 Appearance of new peaks at 1410 cm−1 (Sn–O–Sn overtone, 2γabs),48 630–690 cm−1 (O–Sn–O stretching)49 and at ∼520 cm−1 (Sn–C stretching)48 in the SnO2-GNs-6, SnO2-GNs-12 and SnO2-GNs-18 samples corroborates the successful formation of SnO2 pillared structures on the alkylamine grafted GO (Fig. S1†). To gain more insights into the surface chemical composition of SnO2 pillared carbon, XPS characterization was done and the results are displayed in Fig. S2† and Fig. 3.
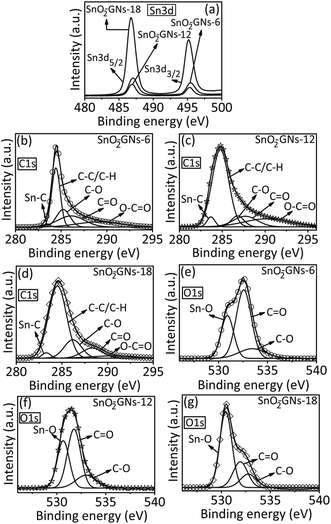 | ||
| Fig. 3 High resolution Sn 3d, C1 s and O1 s X-ray photoelectron spectroscopic results of SnO2 pillared carbons. | ||
The survey scan results of the pristine (GO) showed two strong peaks at 285 and 530 eV, which correspond to the C1 s and O1 s peaks (Fig. S2(a)†). Grafting of long chain alkylamines on the GO surface resulted in a significant increase in the peak intensity of the C1 s peak (285 eV) with a drastic decrease in the O1 s peak (530 eV) along with the appearance of a new peak at 400 eV (N1 s) (fig. not shown).41 Formation of SnO2 pillars on the alkylamine grafted GO (SnO2-GNs-6; SnO2-GNs-12 and SnO2-GNs-18) is corroborated by the appearance of a new peak at 487 eV (Sn3d) along with the peaks due to C1 s (285 eV), O1 s (530 eV) and N1 s (400 eV) (Fig. S2(a)†). The high resolution Sn 3d spectra of SnO2 pillared carbons (SnO2-GNs-6, SnO2-GNs-12 and SnO2-GNs-18) show two symmetrical peaks at ∼487 eV and at ∼ 495.4 eV and they are attributed to the Sn 3d5/2 and Sn 3d3/2 spin–orbit coupling of SnO2 pillars formed on the alkylamine modified GO (Fig. 3(a)). The peak-to-peak separation between Sn 3d5/2 and Sn 3d3/2 is observed to be 8.4 eV for all SnO2 pillared carbons (SnO2-GNs-6; SnO2-GNs-12 and SnO2-GNs-18), with the area ratio of the two peaks approximately equal to 1.5 and these values correspond to the 3d binding energy of Sn4+–O as has been previously reported.50 The high resolution C1 s spectra of pristine GO show five components at around 284.5, 285.3, 286.9, 287.7 and 288.4 eV, which can be generally assigned to C–C/C–H, C–OH, C–O, C![[double bond, length as m-dash]](https://www.rsc.org/images/entities/char_e001.gif) O and O–C
O and O–C![[double bond, length as m-dash]](https://www.rsc.org/images/entities/char_e001.gif) O respectively (Fig. S2(b)†). In contrast, SnO2 pillared carbons (SnO2-GNs-6; SnO2-GNs-12 and SnO2-GNs-18) exhibit major peaks corresponding to Sn–C (∼283.9 eV), C–C/C–H (∼284.5 eV), C–O (∼286 eV), C
O respectively (Fig. S2(b)†). In contrast, SnO2 pillared carbons (SnO2-GNs-6; SnO2-GNs-12 and SnO2-GNs-18) exhibit major peaks corresponding to Sn–C (∼283.9 eV), C–C/C–H (∼284.5 eV), C–O (∼286 eV), C![[double bond, length as m-dash]](https://www.rsc.org/images/entities/char_e001.gif) O (∼287 eV) and O–C
O (∼287 eV) and O–C![[double bond, length as m-dash]](https://www.rsc.org/images/entities/char_e001.gif) O (∼288 eV) (Fig. 3(b–d)). Appearance of a new peak attributed to the Sn–C group (∼283.9 eV) reveals the successful formation of SnO2 structures on the alkylamine modified graphene oxide samples. The dramatic decrease in the intensities of the C1 s components associated with the carbon–oxygen bond (C–O group) due to the reduction of GO by tin (Sn2+) ions generated during the reaction further corroborates the above fact (Fig. 3(b–d)). The successful formation of SnO2 pillar structures on alkylamine modified GO is further revealed by the deconvolution of O1 s peak of GO (Fig. S2(c)†) and SnO2 pillared carbon (Fig. 3 (e–g)). While the pristine GO showed two peaks, which correspond to the C
O (∼288 eV) (Fig. 3(b–d)). Appearance of a new peak attributed to the Sn–C group (∼283.9 eV) reveals the successful formation of SnO2 structures on the alkylamine modified graphene oxide samples. The dramatic decrease in the intensities of the C1 s components associated with the carbon–oxygen bond (C–O group) due to the reduction of GO by tin (Sn2+) ions generated during the reaction further corroborates the above fact (Fig. 3(b–d)). The successful formation of SnO2 pillar structures on alkylamine modified GO is further revealed by the deconvolution of O1 s peak of GO (Fig. S2(c)†) and SnO2 pillared carbon (Fig. 3 (e–g)). While the pristine GO showed two peaks, which correspond to the C![[double bond, length as m-dash]](https://www.rsc.org/images/entities/char_e001.gif) O (532.0 eV) and C–O (533.0 eV) groups (Fig. S2(c)†), appearance of a new peak at ∼530.9 eV (Sn–O group) along with the peaks due to C
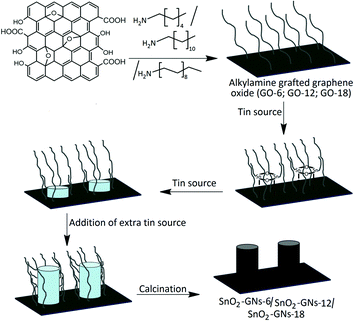
O (532.0 eV) and C–O (533.0 eV) groups (Fig. S2(c)†), appearance of a new peak at ∼530.9 eV (Sn–O group) along with the peaks due to C![[double bond, length as m-dash]](https://www.rsc.org/images/entities/char_e001.gif) O (532.0 eV) and C–O (533.0 eV) groups in SnO2 pillared carbon structures (SnO2-GNs-6; SnO2-GNs-12 and SnO2-GNs-18) revealed the successful formation of SnO2 pillars in the alkylamine modified GO.51 The possible mechanism of formation of SnO2 pillar carbon using N-butyl tin trichloride and alkylamine modified GO is shown in Fig. 4.
O (532.0 eV) and C–O (533.0 eV) groups in SnO2 pillared carbon structures (SnO2-GNs-6; SnO2-GNs-12 and SnO2-GNs-18) revealed the successful formation of SnO2 pillars in the alkylamine modified GO.51 The possible mechanism of formation of SnO2 pillar carbon using N-butyl tin trichloride and alkylamine modified GO is shown in Fig. 4.
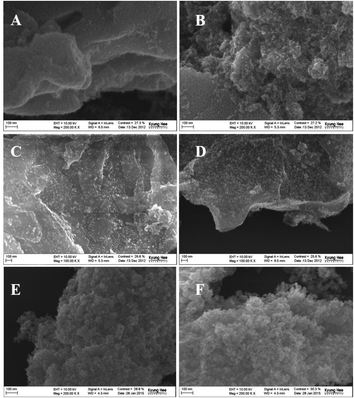
Fig. 5(a–e) and S3† show the field emission scanning electron microscopy (FE-SEM) images of SnO2 pillared carbon prepared using alkylamine modified GO (SnO2-GNs-6; SnO2-GNs-12 and SnO2-GNs-18). In contrast to the pristine GO (Fig. S3†), which exists with a wrinkled morphology, appearance of a plate like morphology with foam like structures for the SnO2-GNs-6 samples clearly revealed the successful formation of SnO2 pillared carbon on the alkylamine modified GO (Fig. 5(a, b) & S3†). The observed SEM results are quite similar to the results reported by Matsuo and Konishi39 in which they prepared the silsesquioxane pillared carbon structure using GO. Increasing the chain length of the grafted alkylamine from 6 (GO-6) to 12 (GO-12), regular growth of the SnO2 pillars with fine dispersion (SnO2-GNs-12) can be clearly visualized on the GO surface (Fig. 5(c, d) & Fig. S3†). In contrast, highly porous SnO2 pillared carbon (SnO2-GNs-18) has been developed on the GO surface upon grafting long chain alkylamines (GO-18) (Fig. 5(e, f) & Fig. S3†). To gain more insights into the morphological features and crystalline phases of SnO2 pillared carbons, field emission transmission electron microscopy characterization has been done and the results are displayed in Fig. 6 and S4.†
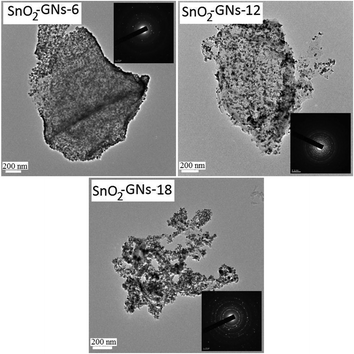
The low magnification TEM image of giant graphene oxide (GO) nanosheets corroborates that they are scrolled and entangled with each other (Fig. S4†). TEM images of the SnO2 pillared carbons (SnO2-GNs-6; SnO2-GNs-12 and SnO2-GNs-18) are shown in Fig. 6. It can be seen that numerous non-aggregated SnO2 nanocrystals with a diameter of 5–20 nm are evenly distributed on the surfaces of the GO nanosheets. The selected area electron diffraction (SAED) pattern shown in the inset of Fig. 6 indicates that rutile SnO2 nanoparticles with good crystallinity are formed in the SnO2 pillared carbons. This fact is corroborated from the SAED pattern, which can be well indexed to the diffraction of the (200), (110), (101), (211), and (301) planes of tetragonal rutile SnO2. Similar geometric confinement of the metal/metal oxide nanoparticles decorated on graphene layers had been reported that suppress the agglomeration of nanoparticles and thereby promoting the electrochemical activity and stability of the composites.33,34 Fig. S4† shows the representative high resolution transmission electron microscopy (HR-TEM) images of SnO2 pillared carbons (SnO2-GNs-6 and SnO2-GNs-12), which demonstrates that the SnO2 nanocrystals formed on the alkylamine modified GO surface have two crystal planes, which are indexed to (100) and (110) crystal planes.
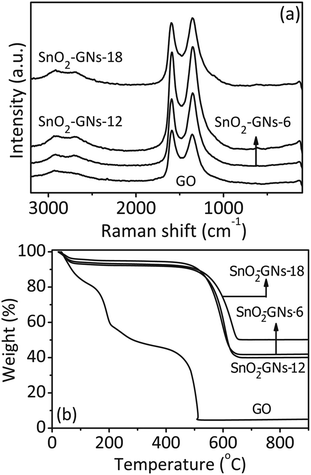
To obtain further understanding of the structural changes that occur during the chemical processing from GO to SnO2 pillared carbon, Raman spectra were recorded and the results are included in Fig. 7(a). The Raman spectrum of pure GO displays a D-band (k-point phonons of A1g symmetry) at 1362 cm−1, typically assigned to defects and disarranged structures of the GO lattice. Another peak at 1584 cm−1 is also seen, which is assigned to the G-band (E2g phonon of carbon) formed due to the vibration of sp2 bonded carbon atoms in the hexagonal lattice. In comparison, the D and G-Raman bands of the SnO2 pillared carbons (SnO2-GNs-6; SnO2-GNs-12 and SnO2-GNs-18) are positioned at different positions like 1353 cm−1 and 1590 cm−1, respectively. A careful search on the literature reveals that when metal oxide nanoparticles are deposited on the surface of GO, the intensity ratio of D and G-bands (ID/IG) usually increases, suggesting the presence of an electronic interaction between the nanoparticles and GO. In our case, the intensity ratio of the composite (ID/IG = 1.01) is found to be larger than that of the pure GO (ID/IG = 0.92), indicating the decrease of the sp2 domains as the dispersion of SnO2 pillars on the graphene layers.52 Additionally, the peak position of the G-band is blue shifted from 1584 cm−1 in GO to 1590 cm−1 in SnO2 pillared carbons and it is corroborated to the p-type doping effect of SnO2 on graphene (an electron withdrawing effect).53 Appearance of distinct broad peaks at about 2690 cm−1 (2D band) and at 2930 cm−1 (D + G band) in SnO2 pillared carbons (SnO2-GNs-6; SnO2-GNs-12 and SnO2-GNs-18) clearly revealed the substantial removal of oxygen containing groups in these systems (Fig. S5†).54 In addition, the appearance of Raman scattering peaks at 700–750 cm−1 (B2g mode), 615–620 cm−1 (A1g mode) and at 445–475 cm−1 (Eg mode) confirms the presence of the rutile type SnO2 in the synthesized SnO2 pillared carbon (Fig. S5†).55 The crystalline domain sizes of the GO and SnO2 pillared carbons (SnO2-GNs-6; SnO2-GNs-12 and SnO2-GNs-18) were calculated by employing the following equation:34
| La = (2.4 × 10⁻¹⁰)λ4(ID/IG)−1 | (2) |
The lateral crystallite sizes (La) of the SnO2 pillared carbons (SnO2-GNs-6; SnO2-GNs-12 and SnO2-GNs-18) are observed to be 17 nm in comparison with pristine GO (La = 18 nm). There is no significant variation in lateral crystallite sizes (La) for SnO2 pillared carbon corroborating the fact that there is no variation in surface defects due to the formation of SnO2 pillars on the graphene surface.
The N2 adsorption isotherm of the SnO2 pillared carbon at room temperature was type IV with a type H1 hysteresis loop at the relative pressure range of 0.4–0.9 confirming the mesoporous feature of synthesized materials56 (Fig. S6†).
The surface area calculated using the BET nitrogen adsorption–desorption curves was significantly higher in comparison with GO (48.5 m2 g−1) (Table 1). The surface area is observed to be 500% (SnO2-GNs-6), 85.6% (SnO2-GNs-12) and 92.8% (SnO2-GNs-18) higher, when compared to the GO samples.56 The average pore sizes of the SnO2 pillared carbon estimated based on the Barrett–Joyner–Halenda (BJH) method are observed to be 6.5 nm (SnO2-GNs-6), 12.4 nm (SnO2-GNs-12) and 16.4 nm (SnO2-GNs-18) and these values are slightly lower in comparison with GO (17.3 nm) corroborating its mesoporous nature (Table 1). The three dimensional porous structure provides a short diffusion length for Li+ ions and electrons during the electrochemical reaction. Thermogravimetric analysis (TGA) was employed to determine the weight composition of the SnO2 pillared carbons (SnO2-GNs-6, SnO2-GNs-12 and SnO2-GNs-18) and the results are displayed in Fig. 7(b). A weight loss of ∼6 wt% is observed below 100 °C due to the evaporation of the moisture content. A significant weight loss occurs in the temperature range of 500 °C–630 °C for GO and SnO2 pillared carbons (SnO2-GNs-6, SnO2-GNs-12 and SnO2-GNs-18) and it is attributed to the degradation of graphene sheets on exposure to air resulting in residual weights of 42% (SnO2-GNs-6), 41% (SnO2-GNs-12) and 51% (SnO2-GNs-18) and this fact can be corroborated to the relative concentration of SnO2 in SnO2 pillared carbon.
| Samples | BET N2 surface area (m2 g−1) | Pore size (nm) |
|---|---|---|
| GO | 48.5 | 17.3 |
| SnO2-GNs-6 | 288.0 | 6.5 |
| SnO2-GNs-12 | 90.5 | 12.4 |
| SnO2-GNs-18 | 93.5 | 16.4 |
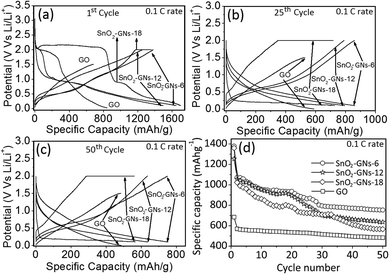
The electrochemical properties of the GO, SnO2 pillared carbons (SnO2-GNs-6, SnO2-GNs-12 and SnO2-GNs-18) and nano-SnO2 as anodes in lithium-ion cells were evaluated via constant current charge/discharge cycling in the potential range of 0.01–2.0 V at 0.1 C and 1 C rates. The charge–discharge profiles of GO and SnO2 pillared carbon in the first, 25th and 50th cycles measured at the 0.1 C rate are shown in Fig. 8(a–c). For comparison, the charge–discharge profiles of nano-SnO2 in the first cycle measured at the 0.1 C rate are included in Fig. S7.† In contrast to our earlier report on microwave synthesized graphene based anode materials,57 chemically prepared graphene oxide (GO) exhibits large voltage hysteresis during the charge cycle though it shows a distinct voltage plateau during the discharge cycle.58
Appearance of a distinct voltage plateau during the first discharge cycle may be attributed to the rough electrode surface, which takes a sufficiently longer time for SEI formation.58 The first discharge (lithiation) and charge (delithiation) capacities of GO are observed to be 842.1 mA h g−1 and 684.2 mA h g−1, respectively with a columbic efficiency of 81.2% (Fig. 8(a)). The capacity loss (18.8%) of the initial cycle may be attributed to the irreversible reaction between the oxygen functionalities present in GO with the lithium ions.59 In contrast, SnO2 pillared carbons (SnO2-GNs-6 & SnO2-GNs-12) present an obvious voltage plateau at 0.95 V, corresponding to the irreversible reduction of SnO2 to form Sn and Li2O. The first discharge and charge capacities of SnO2-GNs-6 are observed to be 1647 and 1379 mA h g−1, respectively with a first columbic efficiency of 83.7%. Similarly, the first discharge and charge capacities of SnO2-GNs-12 are observed to be 1495 and 1255 mA h g−1, respectively with a columbic efficiency of 83.9%. Interestingly, SnO2 pillared carbon (SnO2-GNs-18) showed two obvious voltage plateaus (∼2.0 V and ∼0.8 V vs. Li+/Li) (Fig. 8(a)). Though the exact reason for this strange behaviour is unknown, it may be attributed to the rough surface that takes a sufficiently longer time for SEI formation.58 The first discharge and charge capacities of SnO2-GNs-18 are observed to be 1696 and 1360 mA h g−1, respectively with a columbic efficiency of 80.2%. However, the first discharge and charge capacities of pure nano-SnO2 based electrodes are seen to be 947 and 865 mA h g−1, respectively with a columbic efficiency of 91.3%. Significantly, a higher Li storage capacity for the SnO2 pillared carbons in comparison with GO and nano-SnO2 is attributed to the synergetic contribution of graphene and SnO2 in the lithium storage process. As indicated by the theoretical study, if all graphene nanosheets are strictly monolayered, the maximum lithium storage capacity of graphene is 744 mA h g−1, corresponding to the formation of the LixC. The synthesized SnO2 pillared carbons contain 42 wt% (SnO2-GNs-6), 41 wt% (SnO2-GNs-12) and 51 wt% (SnO2-GNs-18) SnO2 and therefore the theoretical capacity of SnO2 pillared carbons (SnO2-GNs-6, SnO2-GNs-12 and SnO2-GNs-18) can be calculated as:
| Total capacity = Cgraphene × 58% + Cpillared carbon × 42% (SnO2-GNs-6) |
| Total capacity = Cgraphene × 59% + Cpillared carbon × 41% (SnO2-GNs-12) |
| Total capacity = Cgraphene × 49% + Cpillared carbon × 51% (SnO2-GNs-18) |
| Capacity = 744 × 0.58 + 782 × 0.42 = 760.0 mA h g−1 (SnO2-GNs-6) |
| Capacity = 744 × 0.59 + 782 × 0.41 = 759.6 mA h g−1 (SnO2-GNs-12) |
| Capacity = 744 × 0.49 + 782 × 0.51 = 763.4 mA h g−1 (SnO2-GNs-18) |
The higher values of the initial storage capacity of SnO2 pillared carbons (SnO2-GNs-6, SnO2-GNs-12 and SnO2-GNs-18) are attributed to the additional storage of Li-ions in the nano-voids present on the graphene surface or micropores generated on the graphene surface during the oxidation–reduction process or nano-cavities generated due to the partial insertion of SnO2 on the graphene surface. The electrochemical behaviour of carbon coated SnO2 pillars with lithium has been studied extensively by Kim et al.,61 and they showed that the SnO2 pillars exhibit an excellent electrochemical reversible reaction with a first discharge capacity of 1251.9 mA h g−1, which is quite comparable to the present results. After the 25th cycle, the discharge capacities of SnO2 pillared carbons decrease to 863 mA h g−1 (SnO2-GNs-6), 794 mA h g−1 (SnO2-GNs-12), 723 mA h g−1 (SnO2-GNs-18) and these values are significantly higher when compared to graphene oxide based electrodes (600 mA g−1). Similarly, the charge capacities of SnO2 pillared carbons decrease to 859 mA h g−1 (SnO2-GNs-6), 789 mA h g−1 (SnO2-GNs-12), and 718 mA h g−1 (SnO2-GNs-18) and these values are significantly higher when compared to graphene oxide based electrodes (555 mA g−1). The observed columbic efficiencies at the 25th cycle are observed to be 99% (SnO2-GNs-6, SnO2-GNs-12 and SnO2-GNs-18) which are significantly higher in comparison with GO (92.5%) (Fig. 8(b)). The galvanostatic charge–discharge results of SnO2 pillared carbon electrodes at the 50th cycle are included in Fig. 8(c). The discharge capacities of SnO2 pillared carbons at the 50th cycle decrease to 753 mA h g−1 (SnO2-GNs-6), 643 mA h g−1 (SnO2-GNs-12), and 564 mA h g−1 (SnO2-GNs-18) and these values are relatively higher, when compared to GO based electrodes (485 mA h g−1). Similarly, the charge capacities of SnO2 pillared carbons decrease to 750 mA h g−1 (SnO2-GNs-6), 636 mA h g−1 (SnO2-GNs-12), and 560 mA h g−1 (SnO2-GNs-18) and these values are significantly higher when compared to graphene oxide based electrodes (480 mA h g−1). The observed columbic efficiencies at the 50th cycle are observed to be 99% for both GO and SnO2 pillared carbons. The cyclability of the SnO2 pillared carbons (SnO2-GNs-6, SnO2-GNs-12 and SnO2-GNs-18) is examined under long-term cycling over 50 cycles, which demonstrated a good cyclic performance and reversibility (Fig. 8(d)). After 50 cycles, the SnO2 pillared carbon based electrodes still maintained specific capacities of 750 mA h g−1 (SnO2-GNs-6), 643 mA h g−1 (SnO2-GNs-12) and 560 mA h g−1 (SnO2-GNs-18), which represent a much enhanced performance than that of GO based electrodes (specific capacity, 480 mA h g−1) or graphite electrodes (specific capacity, 372 mA h g−1).34,58 The higher reversible capacity of SnO2 pillared carbon compared to graphene or SnO2 is ascribed to the confinement of SnO2 pillars between the graphene layers. Confinement of SnO2 pillars endures the structural stress imposed during the Li+ alloying/dealloying processes that prevents the particle aggregation and thereby maintains the constant charge/discharge profiles, whereas the presence of SnO2 between the graphene layers prevents the aggregation of graphene layers leading to enhanced lithium storage performance. In addition, the voids existing in graphene nanosheets can effectively buffer the volume expansion of SnO2, when reacting with lithium. Consequently, cracking and pulverization of the electrode can be avoided, resulting in an enhanced cycling stability. The coulombic efficiency of GO and SnO2 pillared carbon (SnO2-GNs-6, SnO2-GNs-12 and SnO2-GNs-18) based electrodes measured at the 0.1 C rate increases from its initial value (∼80%) to 99.0% in 5 cycles and maintained 99.0% of its coulombic efficiency values even after 50 cycles (Fig. S8(a)†). The possible mechanism of lithium intercalation and deintercalation processes in SnO2 pillared carbon is corroborated in Fig. S8(b).†
To corroborate the volume expansion and pulverization of SnO2 in the SnO2 pillared carbon, morphological characterization using TEM was done for a representative sample (SnO2-GNs-6) extracted from a cycled electrode (0.1 C rate, 50 cycles) and the results are displayed in Fig. 9(a–d). The TEM image clearly shows the existence of both finely dispersed and aggregated SnO2 particles in the extracted samples (Fig. 9(a, b)). The crystalline nature of the SnO2 is further corroborated from the presence of various crystal planes corresponding to the tetragonal rutile structure (Fig. 9(a, b) (inset)). The volume expansion of SnO2 resulting in particle aggregation and pulverization of SnO2 nanostructures in the SnO2-GNs-6 samples is further revealed using the TEM results obtained at higher magnification (Fig. 9(c, d), encircled regions).
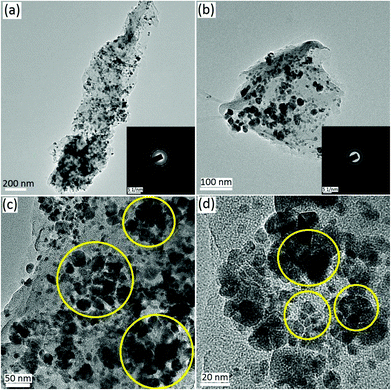 | ||
| Fig. 9 TEM images of SnO2 pillared carbon (SnO2-GNs-6) sample extracted from cycled electrodes (50 cycles at 0.1 C rate). | ||
High rate cyclability (1C rate) of the GO, SnO2 pillared carbons (SnO2-GNs-6, SnO2-GNs-12 and SnO2-GNs-18) and nano-SnO2 based electrodes was also examined under long-term cycling over 150 cycles and the results are displayed in Fig. S9.† Long term cycling at the 1 C rate clearly demonstrates a good cyclic performance and reversibility of the SnO2 pillared carbons in comparison with GO or nano-SnO2 based electrodes (Fig. S9†). After 150 cycles, the SnO2 pillared carbon based electrodes still maintained specific capacities of 516 mA h g−1 (SnO2-GNs-6, 79.8% capacity retention), 370 mA h g−1 (SnO2-GNs-12) and 291 mA h g−1 (SnO2-GNs-18) with the capacity retention of 79.8%, 62.7% and 51%. These values are significantly higher, when compared to GO based electrodes (specific capacity, 87 mA h g−1; capacity retention, 16.5%) and nano-SnO2 based electrodes that failed at the 138th cycle (specific capacity at the 138th cycle, 182 mA h g−1; capacity retention, 32.2%) showing the much enhanced performance of SnO2 pillared carbon based electrodes.
To evaluate the electrochemical reactivity of the SnO2 pillared carbon, a representative cyclic voltammetry was performed for the SnO2-GNs-6 sample and the result is displayed in Fig. S10.† In the first cycle, two obvious cathodic peaks appeared around 0.40 and 0.15 V, respectively. The broad peak at around 0.40 V is ascribed to the formation of SEI layers on the surface of the active materials, the reduction of SnO2 to Sn, and the synchronous formation of Li2O (eqn (3)).62 The peak at approximately 0.15 V corresponds to the formation of a series of LixSn alloys (eqn (4)).63 In the first anodic process, there is a small hump near 0.10 V and it can be corroborated to Li intercalation into graphene to form LiCx (eqn (5)).64 The obvious plateau at 0.75 V can be ascribed to Li dealloying from LixSn and the partially reversible reaction from Sn to SnO2, respectively. The CV measurements clearly elucidated the reversible electrochemical reactions between the lithium ions and the SnO2 pillared carbon in lithium ion cells. The reactions are described in the following equations:
| 4Li+ + SnO2 + 4e− ↔ Sn + 2Li2O | (3) |
| xLi+ + Sn + xe− ↔ LixSn (0 ≤ x ≤ 4.4) | (4) |
| xLi+ + C(graphene) + xe−↔LixC | (5) |
To gain more insights into the electrochemical performance, electrochemical impedance spectroscopy (EIS) of GO and SnO2 pillared carbons (SnO2-GNs-6, SnO2-GNs-12 and SnO2-GNs-18) was performed in the frequency range of 100 kHz–0.01 Hz to understand the interfacial electrochemistry and reaction mechanism. The typical Nyquist plots of AC impedance measured before and after cycling of pristine GO, SnO2-GNs-6, SnO2-GNs-12 and SnO2-GNs-18 are included in Fig. 10(a and b). In general, the impedance spectrum consists of depressed arc followed by the straight line inclined at 45° angle. The equivalent circuit adopted for calculation is shown in Fig. S11.† Here, Re represents the internal ohmic resistance, involving the resistance of the electrolyte and other resistive components, corresponding to the intercept of the plots with the real axis (Zre) at a high frequency. Rf and Cdl1 corresponding to the semicircle at a high frequency represent the resistance and capacitance of solid electrolyte–interface (SEI) films. Rct and Cdl2 related to the semicircle at a medium-to-low frequency characterize the charge transfer resistance and capacitance. The Warburg impedance noted as ZW referring to the sloping region at a low frequency is directly associated with the lithium-ion diffusion process in the electrode. The values of Re, Rf, Rct and Rtotal are listed in Table 2. The relative decrement in solution resistance (Re) values after the 50th cycle is observed to be higher for SnO2 pillared carbons (SnO2-GNs-6, 5.0%; SnO2-GNs-12, 8.2%; SnO2-GNs-18, 17.2%) in comparison with pristine GO (∼3.5%). The Rsf value, which provides information on Li+ ion diffusion through the SEI film and the electrode, is observed to be decreased with electrochemical cycling for pristine GO (∼40.8% decrement in the 50th cycle) corroborating the ease of diffusion. Interestingly, the Rsf values of SnO2 pillared carbons (SnO2-GNs-6, 181.9 Ω; SnO2-GNs-12, 738.2 Ω; SnO2-GNs-18, 174.2 Ω) are observed to be lower in comparison with the pristine GO (294.0 Ω) corroborating the ease of Li+ diffusion (Table 2).
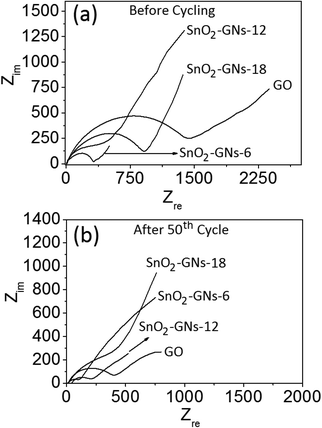 | ||
| Fig. 10 EIS impedance spectra of GO and SnO2 pillared carbon. (a) before cycling and (b) after 50th cycle. | ||
| GO | SnO2-GNs-6 | SnO2-GNs-12 | SnO2-GNs-18 | |||||
|---|---|---|---|---|---|---|---|---|
| 1st | 50th | 1st | 50th | 1st | 50th | 1st | 50th | |
| R e (Ω) | 11.4 | 11 | 10.1 | 9.6 | 14.6 | 13.4 | 9.9 | 8.2 |
| R f (Ω) | 294 | 174 | 181.9 | 99.6 | 738.2 | 145.3 | 178 | 104 |
| R ct (Ω) | 1628 | 439 | 533.2 | 46.9 | 137.4 | 99.4 | 637.6 | 120.5 |
| R total(Ω) | 1934 | 624 | 725.3 | 156.1 | 890.2 | 258.1 | 825.5 | 232.8 |
| i 0 (×10−5 A) | 1.6 | 5.9 | 4.9 | 55.1 | 18.8 | 26 | 4.1 | 21.5 |
The relative decrement in the Rf value is slightly higher after 50th electrochemical cycling (SnO2-GNs-6, 45.2%; SnO2-GNs-12, 80.3%; SnO2-GO-18, 41.6%) corroborating that Li+ ion diffusion is relatively better in SnO2 pillared carbon in comparison with pristine GO (∼40.8%). The Rct values that provide information on charge-transfer resistance decreased significantly after 50th electrochemical cycling (∼73.0%) for pristine GO due to a rise in the electrical conductivity of the electrodes. The Rct values of SnO2 pillared carbons (SnO2-GNs-6, 533.2 Ω; SnO2-GNs-12, 137.4 Ω; SnO2-GNs-18, 637.4 Ω) are observed to be lower in comparison with the pristine GO (1628.6 Ω) revealing lower charge-transfer resistance for SnO2 pillared carbon electrodes. As expected, significant reduction in charge-transfer resistance is observed after 50th electrochemical cycling for SnO2 pillared carbons (SnO2-GNs-6, 91.2%; SnO2-GNs-12, 27.7%; and SnO2-GNs-18, 81.1%) corroborating the enhanced electrical conductivity in these systems. A similar trend is observed in the Rtotal values before and after cycling revealing faster electrode kinetics in SnO2 pillared carbon electrodes, when compared to pristine GO (Table 2). This fact is further corroborated from the exchange current density (i0), which has been calculated using the equation i0 = RT/nFRct, where R is the gas constant, T is the absolute temperature, n is the number of electrons, F is the Faraday constant and Rct is the charge-transfer resistance. Relatively, a higher value of the exchange current density (i0) for SnO2 pillared carbons (SnO2-GNs-6, 206.3%; SnO2-GNs-12, 1075%; and SnO2-GNs-18, 156.3%) is observed in comparison with pristine GO implying enhanced electrochemical activity in the former compared to the latter. Interestingly, the exchange current density (i0) increases significantly for both GO (∼268.8%) and SnO2 pillared carbons (SnO2-GNs-6, 1024%; SnO2-GNs-12, 38.3%; and SnO2-GNs-18, 424%) corroborating a significant rise in the electrochemical activity after the 50th cycle.
Finally, the specific capacities of GO and SnO2 pillared carbons (SnO2-GNs-6, SnO2-GNs-12 and SnO2-GNs-18) and nano-SnO2 based anode materials at various C rates were determined and the results are shown in Fig. 11.
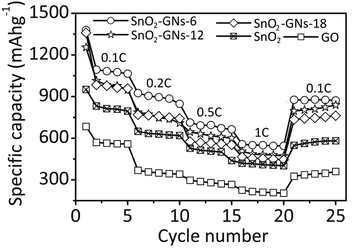 | ||
| Fig. 11 Cycling performance of GO, SnO2 pillared carbons (SnO2-GNs-6, SnO2-GNs-12, and SnO2-GNs-18) and nano-SnO2 based electrodes. | ||
As expected the specific capacity decreases with increasing C rates in all samples. However, the relative decrement in the specific capacity with increasing C rates is less for SnO2 pillared carbon in comparison with pristine GO and nano-SnO2 based electrodes. For instance, the first specific capacity of SnO2-GNs-6 decreased to 927 mA h g−1 (0.2 C rate), 714 mA h g−1 (0.5 C rate) and 561 mA h g−1 (1 C rate) from 1383 mA h g−1 (0.1 C rate). Alternatively, the specific capacity of SnO2-GNs-12 decreased to 800 mA h g−1 (0.2 C rate), 705 mA h g−1 (0.5 C rate) and 575 mA h g−1 (1 C rate) from 1262 mA h g−1 (0.1 C rate). Similarly, the specific capacity of SnO2-GNs-18 decreased to 767 mA h g−1 (0.2 C rate), 577 mA h g−1 (0.5 C rate) and 459 mA h g−1 (1 C rate) from 1362 mA h g−1 (0.1 C rate). These values are significantly higher compared to pristine GO (0.1 C rate, 689 mA h g−1; 0.2 C rate, 368 mA h g−1; 0.5 C rate, 297 mA h g−1 and 1 C rate, 266 mA h g−1) and nano-SnO2 (0.1 C rate, 900 mA h g−1; 0.2 C rate, 652 mA h g−1; 0.5 C rate, 528 mA h g−1 and 1 C rate, 426 mA h g−1) based electrodes revealing their enhanced electrochemical performances.65 Moreover, when the C-rate returns to the initial 0.1 C rate after the 20th cycle, the SnO2 pillared carbon based electrodes recover 64% (SnO2-GNs-6), 63.4% (SnO2-GNs-12), and 59% (SnO2-GNs-18) of their original initial specific capacity values in comparison with pristine GO or nano-SnO2 based electrodes that have recovered 47.7% (GO) and 57.6% (nano-SnO2) of their initial specific capacity corroborating the good reversibility and excellent cyclability of SnO2 pillared carbon based electrodes.
4 Conclusions
In summary, SnO2 pillared carbons have been successfully synthesized using long chain alkylamine modified graphene oxide (GO) and butyl trichlorotin as starting precursors followed by calcination at 500 °C. The successful formation of SnO2 pillared structures is corroborated using FE-SEM results. The as synthesized SnO2 pillared carbon contains ultrafine tetragonal rutile SnO2 nanocrystals and this fact is further confirmed using XRD and TEM. A significant rise in crystallinity of SnO2 pillars is observed on increasing the chain length of grafted alkylamine on the GO surface. BET Nitrogen adsorption studies showed a significant rise in the surface area for SnO2 pillared carbon in comparison with GO. Electrochemical measurements revealed that the SnO2 pillared carbon based anode materials show relatively better cycling performances (99% columbic efficiency) with an excellent reversible capacity (SnO2-GNs-6, 750 mA h g−1; SnO2-GNs-12, 643 mA h g−1; SnO2-GNs-18, 560 mA h g−1) relative to graphene oxide (480 mA h g−1) or graphite (372 mA h g−1) based anode materials at the 0.1 C rate. The outstanding electrochemical performance is likely to be related to the synergistic effects of the unique combination of properties, which include the excellent electric conductivity due to graphene, efficient lithium-ion transport and controlled volume expansion due to the SnO2 pillar structures on the graphene surface.Acknowledgements
Electronic supplementary information (ESI) available: FT-IR, XPS, FE-SEM, TEM, BET adsorption–desorption curves, Raman spectroscopy, CV profile of SnO2-GNs-6 measured at a scan rate of 0.1 mVs−1 between 0.01 and 1.25 V, columbic efficiency plot and EIS model circuit for curve fitting.References
- L. Ji, Z. Lin, M. Alcoutlabi and X. Zhang, Energy Environ. Sci., 2011, 4, 2682–2699 CAS.
- Y. Yu, C. H. Chen and Y. Shi, Adv. Mater., 2007, 19, 993–997 CrossRef CAS.
- M. He, L. Yuan, X. Hu, W. Zhang, J. Shu and Y. Huang, Nanoscale, 2013, 5, 3298–3305 RSC.
- I. A. Courtney and J. Dahn, J. Electrochem. Soc., 1997, 144, 2045–2052 CrossRef CAS.
- L. Beaulieu, S. Beattie, T. Hatchard and J. Dahn, J. Electrochem. Soc., 2003, 150, A419–A424 CrossRef CAS.
- L. Zhang, K. Zhao, W. Xu, Y. Dong, R. Xia, F. Liu, L. He, Q. Wei, M. Yan and L. Mai, Phys. Chem. Chem. Phys., 2015, 17, 7619–7623 RSC.
- J. Y. Huang, L. Zhong, C. M. Wang, J. P. Sullivan, W. Xu, L. Q. Zhang, S. X. Mao, N. S. Hudak, X. H. Liu, A. Subramanian, H. Fan, L. Qi, A. Kushima and J. Li, Science, 2010, 330, 1515–1520 CrossRef CAS PubMed.
- C. M. Wang, W. Xu, J. Liu, J. G. Zhang, L. V. Saraf, B. W. Arey, D. Choi, Z. G. Yang, J. Xiao and S. Thevuthasan, Nano Lett., 2011, 11, 1874–1880 CrossRef CAS PubMed.
- Y. Wang, J. Y. Lee and H. C. Zeng, Chem. Mater., 2005, 17, 3899–3903 CrossRef CAS.
- Y. Wang, P. Ding and X. Su, RSC Adv., 2015, 5, 42603–42608 RSC.
- D. Wang, X. Li, J. Yang, J. Wang, D. Geng, R. Li, M. Cai, T.-K. Sham and X. Sun, Phys. Chem. Chem. Phys., 2013, 15, 3535–3542 RSC.
- J. S. Chen, L. A. Archer and X. W. Lou, J. Mater. Chem., 2011, 21, 9912–9924 RSC.
- S. Ding and X. W. Lou, Nanoscale, 2011, 3, 3586–3588 RSC.
- L. Zhang, H. B. Wu and X. W. Lou, Mater. Horiz., 2014, 1, 133–138 RSC.
- Y. Cheng, R. Yang, J.-P. Zheng, Z. L. Wang and P. Xiong, Mater. Chem. Phys., 2012, 137, 372–380 CrossRef CAS.
- L. Li, Mater. Lett., 2013, 98, 146–148 CrossRef CAS.
- X. Xu, J. Zhuang and X. Wang, J. Am. Chem. Soc., 2008, 130, 12527–12535 CrossRef CAS PubMed.
- M. K. Singh, M. C. Mathpal and A. Agarwal, Chem. Phys. Lett., 2012, 536, 87–91 CrossRef CAS.
- A. K. Geim and K. S. Novoselov, Nat. Mater., 2007, 6, 183–191 CrossRef CAS PubMed.
- W. Yue, S. Yang, Y. Ren and X. Yang, Electrochim. Acta, 2013, 92, 412–420 CrossRef CAS.
- J. Hou, Y. Shao, M. W. Ellis, R. B. Moore and B. Yi, Phys. Chem. Chem. Phys., 2011, 13, 15384–15402 RSC.
- C. Xu, B. Xu, Y. Gu, Z. Xiong, J. Sun and X. S. Zhao, Energy Environ. Sci., 2013, 6, 1388–1414 CAS.
- W. Zhao, J. Zhu, C. Cheng, J. Liu, H. Yang, C. Cong, C. Guan, X. Jia, H. J. Fan, Q. Yan, C. M. Li and T. Yu, Energy Environ. Sci., 2011, 4, 4954–4961 Search PubMed.
- D. Chen, H. Quan, J. Liang and L. Guo, Nanoscale, 2013, 5, 9684–9689 RSC.
- H. Song, H. Cui and C. Wang, ACS Appl. Mater. Interfaces, 2014, 6, 13765–13769 CAS.
- X. Li, P. Meduri, X. Chen, W. Qi, M. H. Engelhard, W. Xu, F. Ding, J. Xiao, W. Wang, C. Wang, J.-G. Zhang and J. Liu, J. Mater. Chem., 2012, 22, 11014–11017 RSC.
- H. C. Tao, L. Z. Fan, W. L. Song, M. Wu, X. He and X. Qu, Nanoscale, 2014, 6, 3138–3142 RSC.
- N. Liu, Z. Lu, J. Zhao, M. T. McDowell, H.-W. Lee, W. Zhao and Y. Cui, Nat. Nanotechnol., 2014, 9, 187–192 CrossRef CAS PubMed.
- A. Magansinski, P. Dixon, B. Hertzberg, A. Kvit, J. Ayala and G. Yushin, Nat. Mater., 2010, 9, 353–358 CrossRef PubMed.
- K. G. Lee, J.-M. Jeong, S. J. Lee, B. Yeom, M.-K. Lee and B. G. Choi, Ultrason. Sonochem., 2015, 22, 422–428 CrossRef CAS PubMed.
- M. M. Islam, S. H. Aboutalebi, D. Cardillo, H. K. Liu, K. Konstantinov and S. X. Dou, ACS Cent. Sci., 2015, 1, 206–216 CrossRef CAS.
- Y. Xi, X. Huang, Z. Lin, X. Zhong, Y. Huang and X. Duan, Nano Res., 2013, 6, 65–76 CrossRef.
- G. Wang, B. Wang, X. Wang, J. Park, S. Dou, H. Ahn and K. Kim, J. Mater. Chem., 2009, 19, 8378–8364 RSC.
- A. M. Shanmugharaj and S. H. Ryu, Electrochim. Acta, 2012, 74, 207–214 CrossRef CAS.
- S. Yang, X. Feng, S. Ivanocini and K. Müllen, Angew. Chem., Int. Ed., 2010, 49, 8408–8411 CrossRef CAS PubMed.
- Y. Matsuo and K. Konishi, Carbon, 2012, 50, 2280–2286 CrossRef CAS.
- H. Kim, B. Han, J. Choo and J. Cho, Angew. Chem., Int. Ed., 2008, 120, 10305–10308 CrossRef.
- W. Wang, Z. Favors, R. Ionescu, R. Y. Hamed, H. Bay, M. Ozkan and C. J. Ozkan, Sci. Rep., 2015, 5, 8781 CrossRef CAS PubMed.
- Y. Matsuo and K. Konishi, Carbon, 2012, 50, 2280–2286 CrossRef CAS.
- A. M. Shanmugharaj, J. H. Yoon, W. J. Yang and S. H. Ryu, J. Colloid Interface Sci., 2013, 401, 148–154 CrossRef CAS PubMed.
- S. H. Ryu and A. M. Shanmugharaj, Chem. – Eng. J, 2014, 244, 552–560 CrossRef CAS.
- D. C. Marcano, D. V. Kosynkin, J. M. Berlin, A. Sinitskii, Z. Sun, A. Slesarev, L. B. Alemany, W. Lu and J. M. Tour, ACS Nano, 2010, 4, 4806–4814 CrossRef CAS PubMed.
- T. Szabo, O. Berkesi, P. Forgo, K. Josepovits, Y. Sanakis, D. Petridis and I. Dekany, Chem. Mater., 2006, 18, 2740–2749 CrossRef CAS.
- Z. Lin, Y. Liu and C.-P. Wong, Langmuir, 2010, 26, 16110–16114 CrossRef CAS PubMed.
- S. Dubin, S. Gilje, K. Wang, V. C. Tung, K. Cha, A. S. Hall, J. Farrar, R. Varshneya, Y. Yang and R. B. Kaner, ACS Nano, 2010, 4, 3845–3852 CrossRef CAS PubMed.
- A. Kumar, L. Rout, R. S. Dhaka, S. L. Samal and P. Dash, RSC Adv., 2015, 5, 39193–39204 RSC.
- D. Amalric-Popescu and F. Bozon-verduraz, Catal. Today, 2001, 70, 139–154 CrossRef CAS.
- A. L. Patterson, The Scherrer Formula for X-Ray Particle Size Determination, Phys. Rev., 1939, 56, 978–982 CrossRef CAS.
- F. K. Butcher, W. Gerrard, E. F. Mooney, R. G. Rees, H. A. Willis, A. Anderson and H. A. Gebbie, J. Organomet. Chem., 1964, 1, 431–434 CrossRef CAS.
- F. H. Li, J. F. Song, H. F. Yang, S. Y. Gan, Q. X. Zhang, D. X. Han, A. Ivaska and L. Niu, Nanotechnology, 2009, 20, 455602 CrossRef PubMed.
- D. Li, Y. Liu, B. Lin, C. Lai, Y. Sun, H. Yang and X. Zhang, J. Alloys Compd., 2015, 652, 9–17 CrossRef CAS.
- X. Liu, X. Zhong, Z. Yang, F. Pan, L. Gu and Y. Yu, Electrochim. Acta, 2015, 152, 178–186 CrossRef CAS.
- C. Xu, J. Sun and L. Gao, J. Mater. Chem., 2012, 20, 975–979 RSC.
- Q. Guo, Z. Zheng, H. Gao, J. Ma and X. Qin, J. Power Sources, 2013, 240, 149–154 CrossRef CAS.
- Y. Liu and M. Liu, Adv. Funct. Mater., 2005, 15, 57–62 CrossRef.
- S. Yang, W. Yue, J. Zhu, Y. Ren and X. Yang, Adv. Funct. Mater., 2013, 23, 3570–3576 CrossRef CAS.
- W. Xing and J. R. Dahn, J. Electrochem. Soc., 1997, 144, 1195–1201 CrossRef CAS.
- A. M. Shanmugharaj, W. S. Choi, C. W. Lee and S. H. Ryu, J. Power Sources, 2011, 196, 10249–10253 CrossRef CAS.
- C. Daniel and J. O. Besenhard., The anode/electrolyte interface, Hand book of battery materials, John Wiley & Sons, Inc, 2 edn, 2011 Search PubMed.
- H. F. Xiang, Z. D. Li, K. Xie, J. Z. Jiang, J. J. Chen, P. C. Lian, J. S. Wu, Y. Yu and H. H. Wang, RSC Adv., 2012, 2, 6792–6799 RSC.
- J. G. Kim, S. H. Lee, S. H. Nam, S. M. Choi and W. B. Kim, RSC Adv., 2012, 2, 7829–7836 RSC.
- Y. Wang, Z. X. Huang, Y. Shi, J. I. Wang, M. Deng and H. Y. Yang, Sci. Rep., 2015, 5, 9164 CrossRef PubMed.
- J. Yao, X. Shen, B. Wang, H. Liu and G. Wang, Electrochem. Commun., 2009, 11, 1849–1852 CrossRef CAS.
- X. Zhu, Y. Zhu, S. Murali, M. Stoller and R. S. Ruoff, J. Power Sources, 2011, 196, 6473–6477 CrossRef CAS.
- X. Wang, X. Zhou, K. Yao, J. Zhang and Z. Liu, Carbon, 2011, 49, 133–139 CrossRef CAS.
Footnote |
| † Electronic supplementary information (ESI) available: XPS, FE-SEM, FE-TEM, TGA FT-IR, EIS, CV of and charge discharge profiles of RGO-SnO2 composites. See DOI: 10.1039/c5nr06680h |
| This journal is © The Royal Society of Chemistry 2016 |

