Thermal conductivities of single- and multi-layer phosphorene: a molecular dynamics study
Ying-Yan
Zhang
*a,
Qing-Xiang
Pei
*b,
Jin-Wu
Jiang
*c,
Ning
Wei
d and
Yong-Wei
Zhang
b
aSchool of Computing, Engineering and Mathematics, Western Sydney University, Penrith, NSW 2751, Australia. E-mail: yingyan.zhang@uws.edu.au
bInstitute of High Performance Computing, A*STAR, Singapore 138632, Singapore. E-mail: peiqx@ihpc.a-star.edu.sg
cShanghai Institute of Applied Mathematics and Mechanics, Shanghai Key Laboratory of Mechanics in Energy Engineering, Shanghai University, Shanghai 200072, China. E-mail: jwjiang5918@hotmail.com
dCollege of Water Resources and Architectural Engineering, Northwest A&F University, China
First published on 20th November 2015
Abstract
As a new two-dimensional (2D) material, phosphorene has drawn growing attention owing to its novel electronic properties, such as layer-dependent direct bandgaps and high carrier mobility. Herein we investigate the in-plane and cross-plane thermal conductivities of single- and multi-layer phosphorene, focusing on geometrical (sample size, orientation and layer number) and strain (compression and tension) effects. A strong anisotropy is found in the in-plane thermal conductivity with its value along the zigzag direction being much higher than that along the armchair direction. Interestingly, the in-plane thermal conductivity of multi-layer phosphorene is insensitive to the layer number, which is in strong contrast to that of graphene where the interlayer interactions strongly influence the thermal transport. Surprisingly, tensile strain leads to an anomalous increase in the in-plane thermal conductivity of phosphorene, in particular in the armchair direction. Both the in-plane and cross-plane thermal conductivities can be modulated by external strain; however, the strain modulation along the cross-plane direction is more effective and thus more tunable than that along the in-plane direction. Our findings here are of great importance for the thermal management in phosphorene-based nanoelectronic devices and for thermoelectric applications of phosphorene.
1. Introduction
Recent years have witnessed incredible advances in the research of two-dimensional (2D) materials, in particular, after the discovery of graphene.1 As the first 2D material, graphene has created unprecedented science sensations due to its novel electronic, thermal and mechanical properties.2–8 Researchers were thus motivated to explore other 2D materials, such as graphene allotropes,9–11 silicene,12–14 hexagonal boron nitride (h-BN)15,16 and molybdenum disulphide (MoS2).17–19The most recent 2D material, which has attracted great attention, is phosphorene – the single-layer black phosphorus (see Fig. 1).20–22 Recent theoretical and experimental studies revealed that phosphorene is an anisotropic 2D semiconductor with high carrier mobility,23 and a large direct band gap of about 1.5 eV,24 making it promising for potential applications in nanoelectronics, such as field-effect transistors and photo-transistors. Phosphorene is also found to have a high figure of merit (ZT value) at room temperature. First-principles calculations show that the ZT value is greater than 1.0 at 300 K,25 and the external tensile strain of 8% can enhance the ZT value in the armchair direction to 2.12.26 The high ZT value of phosphorene implies its potential applications in thermoelectric devices. Since these applications are closely related to its thermal properties, much effort has thus been devoted to exploring its thermal properties. For example, Fei et al.25 found that phosphorene exhibits a pronounced spatial-anisotropic lattice thermal conductance and electrical conductance. From the first-principles calculations, Qin et al.27 showed that the thermal conductivity of phosphorene is anisotropic, and the prominent electrical and thermal conducting directions are orthogonal to one another. The computed thermal conductivity at 300 K for the armchair and zigzag directions is 13.65 and 30.15 W m−1 K−1, respectively. Using the same method, Jain and McGaughey28 predicted the thermal conductivity of phosphorene to be 36 and 110 W m−1 K−1 along its armchair and zigzag directions, respectively. Using first-principles calculations and the non-equilibrium Green's function method, Ong et al.29 observed a strong anisotropy in thermal conductance of phosphorene, with the thermal conductance along the zigzag direction being 40% higher than that along the armchair direction at 300 K. They also evaluated the effect of tensile strain on the thermal conductance anisotropy and found that a uniaxial tensile strain is able to reduce the thermal conductance in the armchair direction, but increase the thermal conductance in the zigzag direction.
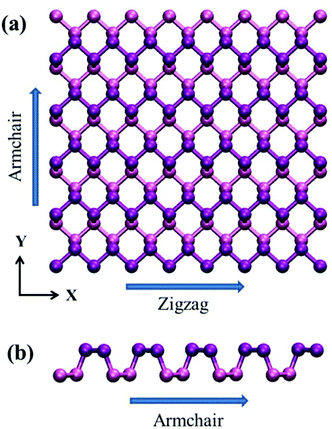 | ||
| Fig. 1 Configuration of single-layer phosphorene. The zigzag and armchair directions are placed along the x and y directions, respectively. | ||
It is worth noting that the previous studies25,27–29 on the thermal conductivity of phosphorene were based on the first-principles calculations, and thus they used very small samples to generate the linear K matrix (phonon dispersion) and the third-order nonlinear K matrix, based on which they further calculated the thermal conductivity by including phonon–phonon scattering. Up to now, a detailed study on the thermal conductivity of single-layer phosphorene based on molecular dynamics (MD) simulations is still lacking. Besides, no work has been done on the thermal properties of multi-layer phosphorene. The effects of layer number and mechanical strain on the thermal conductivity of multi-layer phosphorene remain unexplored.
In this work, we perform MD simulations to study the thermal conductivities of single-layer and multi-layer phosphorene in the diffusive transport regime by accounting for the phonon–phonon scattering. The effects of the sample size, lattice orientation, number of layers, and mechanical strain on the thermal conductivity of phosphorene have been investigated.
2. Simulation method
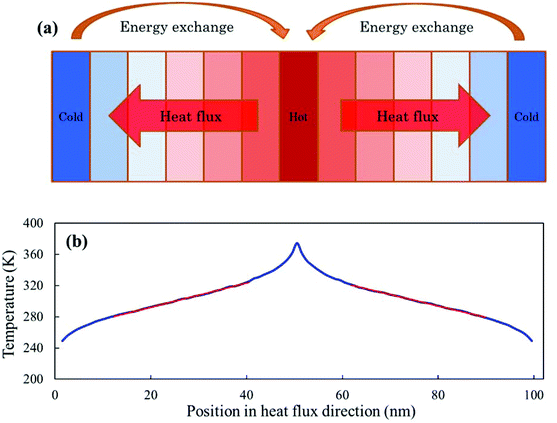
All the MD simulations are performed using the LAMMPS package.30 The Stillinger–Weber (SW) potential parameterized by Jiang31 is employed to describe the covalent interaction between the phosphorous atoms in phosphorene, while the Lennard-Jones (LJ) potential is used for the van der Waals (vdW) interactions across different layers in multi-layer phosphorene. The LJ potential is expressed as V(rij) = 4ε[(σ/rij)12 − (σ/rij)6], where rij is the distance between atoms i and j; ε and σ are the energy and distance constants, respectively. These parameters (ε = 0.0132 eV and σ = 3.695 Å) used in the present MD simulations are obtained from the Universal Force Field.32 It is noted that the value of σ is not directly provided in the reference. Instead, the distance at which the LJ potential reaches its minimum, r0, was given. The value of σ is obtained as σ = r0/(21/6) = 3.695 Å. The cutoff distance of the LJ potential is 15 Å. The multi-layer phosphorene is stacked in the A–B sequence, which is the most stable stacking sequence with the lowest energy.33The thermal conductivity is obtained by using the non-equilibrium molecular dynamics (NEMD).34 The simulation model is divided into 100 slabs along the length direction, with the heat source and sink each taking one of the slabs. As illustrated in Fig. 2a, the heat source and sink slabs are located at the middle and the two ends of the model, respectively. Periodic boundary conditions are applied in all the three directions. The initial relaxed configuration is equilibrated at 300 K in an NPT ensemble for 4 × 10⁵ steps with a time step of 0.5 fs. Then the system is switched to an NVE ensemble to conserve the energy. By continuously exchanging the kinetic energies (every 100 time steps) between the hottest atom in the heat sink slab and the coldest atom in the heat source slab in the NVE ensemble, the heat flux J due to the exchange of kinetic energies is then given.
To make sure that the temperature profile in the heat flux direction has reached the steady state before data collection, we have outputted the average temperature profiles every 0.5 ns and found that there is little change in the temperature profiles after about 2.5 ns, meaning that the system has reached the steady state. The final thermal conductivity is obtained by averaging data over another 2.5 ns period in the steady state and the error bars are calculated using a block averaging approach. The thermal conductivity λ is calculated by using the Fourier law as
 | (1) |
In essence, thermal energy is the energy of atomic vibration, which can be characterized by the vibration power spectrum or vibrational density of states (VDOS) in the frequency domain. To explain the underlying physics of the thermal transport properties of phosphorene, the VDOS was computed by taking Fourier transform of the velocity autocorrelation function (VAF) of all the atoms as:
 | (2) |
3. Results and discussion
3.1. In-plane thermal conductivity
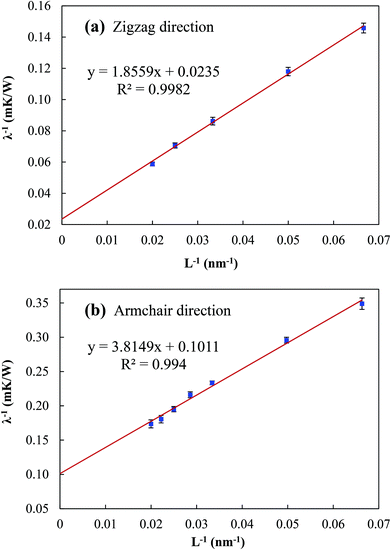
In addition to the phonon–phonon scattering, the phonon scattering also occurs at the heat source and sink when the sample size is smaller than the phonon mean free path (MFP). For a sample with a length smaller than the MFP, the thermal conductivity is affected by the system size. With increasing sample size, the scattering effect at the heat source and sink gradually diminishes, giving rise to the gradual increase in the thermal conductivity. In order to extract the effective MFP, l, and the thermal conductivity of infinitely long phosphorene, λ∞, an inverse fitting procedure is employed.35–37 In this procedure, the relationship between λ−1 and L−1 is expressed as
 | (3) |
From Fig. 3, the thermal conductivity λ∞ along the zigzag and armchair directions is found to be 42.553 and 9.891 W m−1 K−1, respectively, which are comparable to those obtained by Qin et al. (30.15 and 13.65 W m−1 K−1).27 Based on eqn (3), the corresponding MFP values are found to be l = 39.48 and 18.87 nm, respectively, which are much smaller than that of graphene (i.e. 775 nm).38 This also explains the much smaller thermal conductivity of phosphorene. Different from the thermal conductivities of other 2D materials, such as graphene,39 silicene36,40 and MoS2,41–44 the thermal conductivity of phosphorene shows a strong anisotropy with a factor of 4.3, in line with the previous results obtained by other researchers.27,28 This strong anisotropy in the thermal conductivity of phosphorene may be attributed to its puckered configuration in the armchair direction.29,45
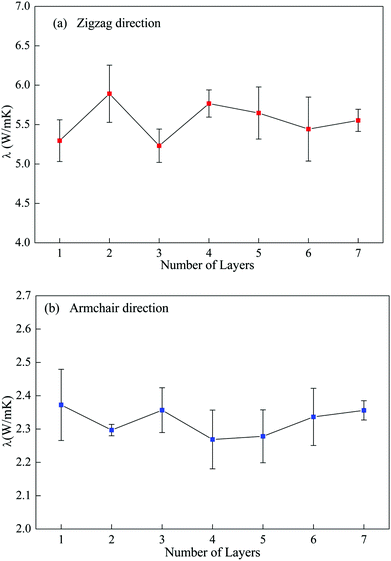 | ||
| Fig. 4 Variation in the in-plane thermal conductivity with number of layers in multi-layer phosphorene along zigzag (a) and armchair (b) directions. | ||
To further examine this layer-independent thermal conductivity, we calculated the VDOS for the multi-layer phosphorene. The VDOS is calculated in the NVE ensemble after the system is relaxed in the NPT ensemble at 300 K, but before the heat flux is imposed. It is clearly seen from Fig. 5 that the profiles of VDOS for multi-layer phosphorene with different numbers of layers show a high level of similarity. In particular, the peaks in the low and high frequency regions occur around 5 and 12.5 THz for all the cases.
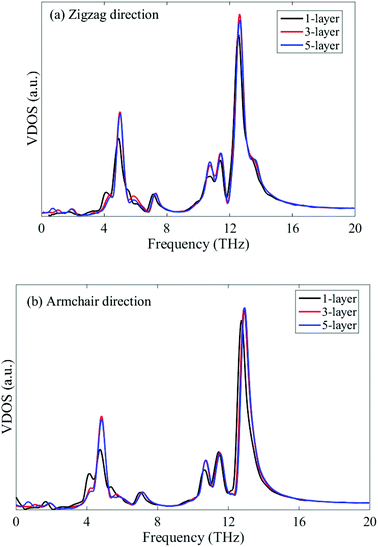 | ||
| Fig. 5 VDOS of single-layer, tri-layer and five-layer phosphorene with heat flux along zigzag (a) and armchair (b) directions. | ||
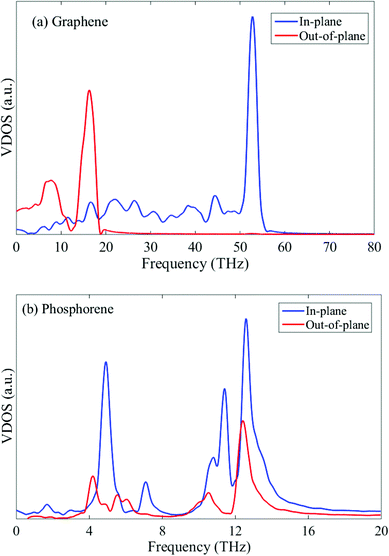
The underlying physical origin behind this layer-independent thermal conductivity of multi-layer phosphorene can be explained as follows. Unlike graphene with only one-atom thickness, the atoms in single-layer phosphorene are arranged in two sub-layers and formed a puckered geometry as clearly illustrated in Fig. 1. This puckered structure in single-layer phosphorene hinders the out-of-plane (flexural) phonon mode and thus diminishes the layer effect in multi-layer phosphorene.
To further explain this interesting point, we plot the VDOS for both single-layer phosphorene and single-layer graphene in Fig. 6. The adaptive intermolecular reactive empirical bond order (AIREBO) potential49 is used to simulate graphene. It is seen from Fig. 6a that the out-of-plane vibration mode (flexural mode) in single-layer graphene makes predominant contribution to the heat conduction in the low frequency range. For multi-layer graphene, the interlayer vdW interactions restrict the flexural mode and thus the thermal conductivity of multi-layer graphene decreases with increasing layer number.46–48 In contrast to single-layer graphene, the flexural mode in single-layer phosphorene contributes only slightly to the low frequency heat conduction as shown in Fig. 6b. Therefore, the increase in the layer number in multi-layer phosphorene and the associated interlayer vdW interactions have a negligible effect on the thermal conductivity, resulting in the observed layer-independent characteristics shown in Fig. 4.
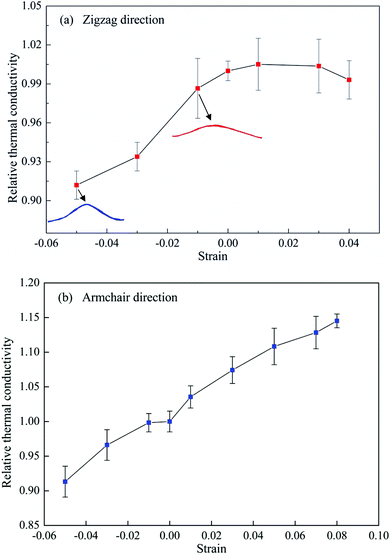
MD simulations are performed on a single-layer phosphorene sample with a length of 60 nm and a width of 20 nm subjected to different levels of strain along the length direction, which can be either the zigzag or armchair direction. After the structure is fully relaxed, a constant strain rate of 5 × 10⁷ s−1 is applied along the length direction in an NVT ensemble to achieve the desired strain level in the simulation sample. Thereafter, the system is switched to the NVE ensemble and a heat flux is applied along the length direction to calculate the corresponding thermal conductivity. Fig. 7 shows the effect of uniaxial strain on the thermal conductivity of single-layer phosphorene along both the armchair and zigzag directions. Note that the thermal conductivities shown in Fig. 7 are normalized by their corresponding strain-free values, and that the deformed length is used for the calculation of the temperature gradient.
When the phosphorene sample is under compression, the relative thermal conductivity is smaller than 1 for both the zigzag and armchair directions, indicating that compressive strain reduces the thermal conductivity of phosphorene. Similar to graphene, phosphorene undergoes out-of-plane buckling under compressive strain. As the compressive strain increases, the buckling deformation is increased as illustrated by the red and blue curved lines in Fig. 7a, which correspond to the deformed configurations at the compressive strain of −0.01 and −0.05, respectively. Since the buckling deformation is able to enhance phonon scattering, consequently, the thermal conductivity of phosphorene decreases, as observed in Fig. 7, which is consistent with that of graphene.54
When the phosphorene sample is subjected to uniaxial tension, the relative thermal conductivity is greater than 1, implying that the tensile strain exerts a positive influence on the thermal conductivity. We limit the applied strain along the zigzag direction to 0.04 since the fracture strain of phosphorene along this direction is only around 0.05.31 The thermal conductivity along the zigzag direction increases slightly when the tensile strain is 0.01. Thereafter, the thermal conductivity reaches a plateau until the strain level of 0.04. However, from the VDOS profiles at different tensile strains shown in Fig. 8, it is seen that the tensile strain in the zigzag direction softens both the in-plane and out-of-plane phonon modes, thus depressing the phonon group velocities and hindering the heat conduction. Therefore, this small increase in thermal conductivity along the zigzag direction may be attributed to the tension-induced elongation of the phosphorene sample, which results in a higher thermal conductivity due to the size effect.
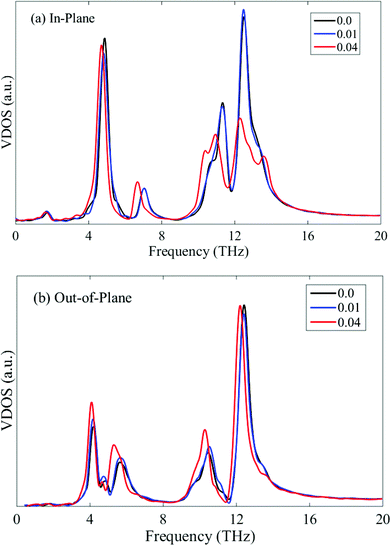 | ||
| Fig. 8 In-plane (a) and out-of-plane (b) VDOS of single-layer phosphorene under tensile strain along the zigzag direction. | ||
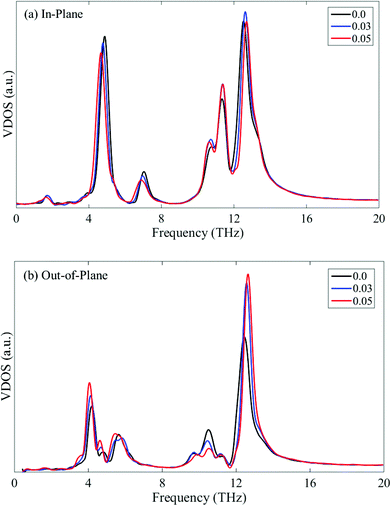
However, the thermal conductivity along the armchair direction increases almost linearly with increasing tensile strain up to 0.08 as shown in Fig. 7b. In comparison with Fig. 7a, it is readily seen that the tensile strain has a more significant effect on the thermal conductivity along the armchair direction. This thermal conductivity enhancement induced by the tensile strain is quite surprising, since it is well known that tensile strain reduces the thermal conductivity of crystal materials. The positive effect produced by the tensile strain for the phosphorene is in sharp contrast to graphene, but similar to silicene.36,40 The in-plane and out-of-plane VDOS for the phosphorene sample under tensile strain along the armchair direction are plotted in Fig. 9a and 9b, respectively. It is clearly shown that the presence of the tensile strain leads to phonon stiffening in both the in-plane and out-of-plane modes, which facilitates thermal transport. In addition, the phonon stiffening is more obvious in the out-of-plane modes as shown in Fig. 9b. Together with the size effect (elongated structures under tensile strain), the thermal conductivity of phosphorene along the armchair direction is thus enhanced remarkably. It is noted that the low frequency modes near 4 THz undergo a small red-shift under tension. Since our MD simulations show that the thermal conductivity can be enhanced by the mechanical tension, this may indicate a stronger effect from the tension-induced blue-shift of the high frequency phonon modes than the red-shift of the low frequency phonon modes.
3.2. Cross-plane thermal conductivity
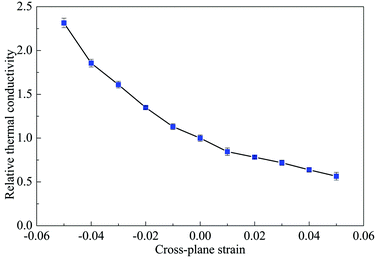
Now we study the cross-plane thermal conductivity of multi-layer phosphorene. It is expected that multi-layer phosphorene may have great potential in nanoelectronics and thermoelectric applications.55–57 Thus it is of great interest to investigate the thermal transport properties along the cross-plane direction (Z direction) and how the thermal conductivity is changed by the mechanical strain. For this purpose, a 60-layer phosphorene was built with the in-plane dimension of 4 × 4 nm2 and the initial interlayer distance of 5.24 Å. Periodic boundary conditions are applied in all the three directions. The 60-layer structure is long enough for the cross-plane thermal conductivity calculation, as a linear region of the temperature profile is obtained. The interlayer distance after relaxation is about 5.66 Å. The cross-plane compressive or tensile strain is applied on the relaxed structure. The cross-plane thermal conductivity as a function of the cross-plane strain is shown in Fig. 10. Here the thermal conductivity is normalized by the thermal conductivity at zero strain. When the strain changes from −0.05 (compression) to 0.05 (tension), the relative thermal conductivity decreases from 2.314 to 0.565, indicating that the cross-plane thermal conductivity can be effectively modulated by the cross-plane strain. This finding is consistent with that for multi-layer graphene under cross-plane strain.58When the multi-layer phosphorene is under cross-plane compression/tension, the relative thermal conductivity is greater/smaller than 1, signifying that the cross-plane compressive/tensile strain enhances/reduces the thermal conductivity. The external strains affect the interlayer interaction strength and then the thermal transport. The compressive cross-plane strain suppresses the multi-layer phosphorene, reduces the interlayer distance and enhances the interlayer interaction. The stronger interlayer interaction facilitates the heat transport, and thus results in a higher thermal conductivity. In contrast, the tensile cross-plane strain increases the interlayer distance, weakens the interlayer interaction and consequently hinders the heat transport.
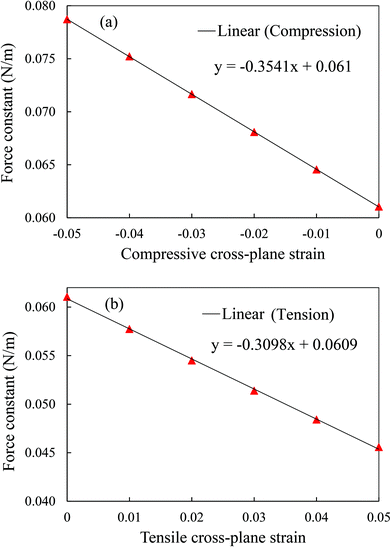
The interlayer interaction strength can be quantified numerically by the force constant from the second derivative of the interlayer LJ potential with respect to the interlayer distance at different cross-plane strains. The force constant is inversely proportional to the cross-plane strain varying from −0.05 to 0.05 as shown in Fig. 11, which corresponds to the variation in the thermal conductivity shown in Fig. 10. In addition, the force constant experiences a larger change under cross-plane compression with a larger slope of 0.3541 than 0.3098 under tension. It is evident from Fig. 10 and 11 that the cross-plane compression is more effective in adjusting the cross-plane thermal conductivity.
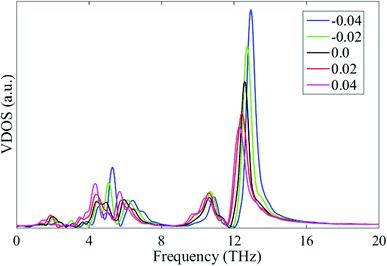
This thermal conductivity modulation by the cross-plane strain can also be explained by the VDOS shown in Fig. 12. Apparently, the compressive and tensile cross-plane strains induce phonon stiffening (blue shift) and softening (red shift) of the phonon spectrum, respectively. The phonon stiffening/softening increases/decreases the group velocity, thus leading to an increase/decrease in the thermal conductivity along the cross-plane direction.
4. Conclusions
In summary, we have performed NEMD simulations to study the in-plane and cross-plane thermal conductivities of single- and multi-layer phosphorene. The variation in the thermal conductivity with respect to the sample length, orientation, layer number and mechanical strain is systematically examined. From the simulation results, it was found that the phosphorene possesses a strong anisotropy and also strong layer-number independence of the in-plane thermal conductivity due to its puckered structure, which is distinctly different from other 2D materials. Similar to other 2D materials, the in-plane thermal conductivity is dependent on the sample length and mechanical strain. Compared with the in-plane thermal conductivity under uniaxial in-plane strain, the cross-plane thermal conductivity is more sensitive to the cross-plane strain and is thus more tunable by the mechanical strain. Our findings can provide a useful guideline in modulating the thermal properties of phosphorene for its potential applications in thermal management and thermoelectric devices.Acknowledgements
Y.Y. Zhang is grateful for the computational support provided by Intersect Australia Ltd and the 2015 Academic Development Program in Western Sydney University, Australia.References
- K. S. Novoselov, A. K. Geim, S. V. Morozov, D. Jiang, Y. Zhang, S. V. Dubonos, I. V. Grigorieva and A. A. Firsov, Science, 2004, 306, 666–669 CrossRef CAS PubMed.
- C. Soldano, A. Mahmood and E. Dujardin, Carbon, 2010, 48, 2127–2150 CrossRef CAS.
- Q. X. Pei, Y. W. Zhang and V. B. Shenoy, Carbon, 2010, 48, 898–904 CrossRef CAS.
- T. Y. Ng, J. J. Yeo and Z. S. Liu, Carbon, 2012, 50, 4887–4893 CrossRef CAS.
- B. Liu, C. D. Reddy, J. W. Jiang, J. A. Baimova, S. V. Dmitriev, A. A. Nazarov and K. Zhou, Appl. Phys. Lett., 2012, 101, 211909 CrossRef.
- R. Mas-Balleste, C. Gomez-Navarro, J. Gomez-Herrero and F. Zamora, Nanoscale, 2011, 3, 20–30 RSC.
- N. N. Li, Z. D. Sha, Q. X. Pei and Y. W. Zhang, J. Phys. Chem. C, 2014, 118, 13769–13774 CAS.
- J. Chen, G. Zhang and B. Li, Nanoscale, 2013, 5, 532–536 RSC.
- A. Hirsch, Nat. Mater., 2010, 9, 868–871 CrossRef CAS PubMed.
- Y. Y. Zhang, Q. X. Pei and C. M. Wang, Appl. Phys. Lett., 2012, 101, 081909 CrossRef.
- Y. Y. Zhang, Q. X. Pei, Y. W. Mai and Y. T. Gu, J. Phys. D: Appl. Phys., 2014, 47, 425301 CrossRef.
- B. Aufray, A. Kara, S. Vizzini, H. Oughaddou, C. Leandri, B. Ealet and G. Le Lay, Appl. Phys. Lett., 2010, 96, 183102 CrossRef.
- Q. X. Pei, Z. D. Sha, Y. Y. Zhang and Y. W. Zhang, J. Appl. Phys., 2014, 115, 023519 CrossRef.
- H. Oughaddou, H. Enriquez, M. R. Tchalala, H. Yildirim, A. J. Mayne, A. Bendounan, G. Dujardin, M. A. Ali and A. Kara, Prog. Surf. Sci., 2015, 90, 46–83 CrossRef CAS.
- X. Wu, J. Dai, Y. Zhao, Z. Zhuo, J. Yang and X. C. Zeng, ACS Nano, 2012, 6, 7443–7453 CrossRef CAS PubMed.
- Y. F. Gao, X. L. Zhang, Y. H. Jing and M. Hu, Nanoscale, 2015, 7, 7143–7150 RSC.
- A. Splendiani, L. Sun, Y. Zhang, T. Li, J. Kim, C. Y. Chim, G. Galli and F. Wang, Nano Lett., 2010, 10, 1271–1275 CrossRef CAS PubMed.
- J. W. Jiang, Nanoscale, 2014, 6, 8326–8333 RSC.
- B. Liu, F. Meng, C. D. Reddy, J. A. Baimova, N. Srikanth, S. V. Dmitriev and K. Zhou, RSC Adv., 2015, 5, 29193–29200 RSC.
- A. S. Rodin, A. Carvalho and A. H. Castro Neto, Phys. Rev. Lett., 2014, 112, 176801 CrossRef CAS PubMed.
- J. Qiao, X. Kong, Z. X. Hu, F. Yang and W. Ji, Nat. Commun., 2014, 5, 4475 CAS.
- J. W. Jiang and H. S. Park, Nat. Commun., 2014, 5, 4727 CAS.
- L. K. Li, Y. J. Yu, G. J. Ye, Q. Ge, X. Ou, H. Wu, D. Feng, X. H. Chen and Y. Zhang, Nat. Nanotechnol., 2014, 9, 372–377 CrossRef CAS PubMed.
- V. Tran, R. Soklaski, Y. Liang and L. Yang, Phys. Rev. B: Condens. Matter, 2014, 89, 235319 CrossRef.
- R. Fei, A. Faghaninia, R. Soklaski, J. A. Yan, C. Lo and L. Yang, Nano Lett., 2014, 14, 6393–6399 CrossRef CAS PubMed.
- H. Y. Lv, W. J. Lu, D. F. Shao and Y. P. Sun, Phys. Rev. B: Condens. Matter, 2014, 90, 085433 CrossRef.
- G. Qin, Q. B. Yan, Z. Qin, S. Y. Yue, M. Hu and G. Su, Phys. Chem. Chem. Phys., 2015, 17, 4854–4858 RSC.
- A. Jain and A. J. McGaughey, Sci. Rep., 2015, 5, 8501 CrossRef CAS PubMed.
- Z. Y. Ong, Y. Q. Cai, G. Zhang and Y. W. Zhang, J. Phys. Chem. C, 2014, 118, 25272–25277 CAS.
- S. Plimpton, J. Comptut. Phys., 1995, 117, 1–19 CrossRef CAS.
- J. W. Jiang, Nanotechnology, 2015, 26, 315706 CrossRef PubMed.
- A. K. Rappe, C. J. Casewit, K. S. Colwell, W. A. Goddard and W. M. Skiff, J. Am. Chem. Soc., 1992, 114, 10024–10035 CrossRef CAS.
- J. Dai and X. C. Zeng, J. Phys. Chem. Lett., 2014, 5, 1289–1293 CrossRef CAS PubMed.
- F. MullerPlathe, J. Chem. Phys., 1997, 106, 6082–6085 CrossRef.
- P. K. Schelling, S. R. Phillpot and P. Keblinski, Phys. Rev. B: Condens. Matter, 2002, 65, 144306 CrossRef.
- Q. X. Pei, Y. W. Zhang, Z. D. Sha and V. B. Shenoy, J. Appl. Phys., 2013, 114, 033526 CrossRef.
- M. Hu and D. Poulikakos, Nano Lett., 2012, 12, 5487–5494 CrossRef CAS PubMed.
- S. Ghosh, I. Calizo, D. Teweldebrhan, E. P. Pokatilov, D. L. Nika, A. A. Balandin, W. Bao, F. Miao and C. N. Lau, Appl. Phys. Lett., 2008, 92, 151911 CrossRef.
- J. Haskins, A. Kinaci, C. Sevik, H. Sevincli, G. Cuniberti and T. Cagin, ACS Nano, 2011, 5, 3779–3787 CrossRef CAS PubMed.
- M. Hu, X. L. Zhang and D. Poulikakos, Phys. Rev. B: Condens. Matter, 2013, 87, 195417 CrossRef.
- Y. Q. Cai, J. H. Lan, G. Zhang and Y. W. Zhang, Phys. Rev. B: Condens. Matter, 2014, 89, 035438 CrossRef.
- Z. Ding, J. W. Jiang, Q. X. Pei and Y. W. Zhang, Nanotechnology, 2015, 26, 065703 CrossRef CAS PubMed.
- I. Jo, M. T. Pettes, E. Ou, W. Wu and L. Shi, Appl. Phys. Lett., 2014, 104, 201902 CrossRef.
- X. J. Liu, G. Zhang, Q. X. Pei and Y. W. Zhang, Appl. Phys. Lett., 2013, 103, 133113 CrossRef.
- L. Kou, C. Chen and S. C. Smith, J. Phys. Chem. Lett., 2015, 6, 2794–2805 CrossRef CAS PubMed.
- S. Ghosh, W. Bao, D. L. Nika, S. Subrina, E. P. Pokatilov, C. N. Lau and A. A. Balandin, Nat. Mater., 2010, 9, 555–558 CrossRef CAS PubMed.
- L. Lindsay, D. A. Broido and N. Mingo, Phys. Rev. B: Condens. Matter, 2011, 83, 235428 CrossRef.
- Z. Wei, Z. Ni, K. Bi, M. Chen and Y. Chen, Carbon, 2011, 49, 2653–2658 CrossRef CAS.
- S. J. Stuart, A. B. Tutein and J. A. Harrison, J. Chem. Phys., 2000, 112, 6472–6486 CrossRef CAS.
- X. Han, H. M. Stewart, S. A. Shevlin, C. R. Catlow and Z. X. Guo, Nano Lett., 2014, 14, 4607–4614 CrossRef CAS PubMed.
- L. Lindsay, W. Li, J. Carrete, N. Mingo, D. A. Broido and T. L. Reinecke, Phys. Rev. B: Condens. Matter, 2014, 89, 155426 CrossRef.
- S. Bhowmick and V. B. Shenoy, J. Chem. Phys., 2006, 125, 164513 CrossRef PubMed.
- Z. X. Guo, D. Zhang and X. G. Gong, Appl. Phys. Lett., 2009, 95, 163103 CrossRef.
- N. Wei, L. Xu, H. Q. Wang and J. C. Zheng, Nanotechnology, 2011, 22, 105705 CrossRef PubMed.
- M. Buscema, D. J. Groenendijk, S. I. Blanter, G. A. Steele, H. S. J. van der Zant and A. Castellanos-Gomez, Nano Lett., 2014, 14, 3347–3352 CrossRef CAS PubMed.
- Y. Xu, J. Dai and X. C. Zeng, J. Phys. Chem. Lett., 2015, 6, 1996–2002 CrossRef CAS PubMed.
- J. S. Kim, Y. N. Liu, W. N. Zhu, S. Kim, D. Wu, L. Tao, A. Dodabalapur, K. Lai and D. Akinwande, Sci. Rep., 2015, 5, 8989 CrossRef CAS PubMed.
- J. Chen, J. H. Walther and P. Koumoutsakos, Nano Lett., 2014, 14, 819–825 CrossRef CAS PubMed.
| This journal is © The Royal Society of Chemistry 2016 |

