Ca6BaP4O17:Eu2+,Gd3+: a yellow emitting long-lasting phosphor with high brightness and long afterglow duration
Haijie
Guo
ab,
Yuhua
Wang
*ab,
Wenbo
Chen
ab,
Wei
Zeng
ab,
Gen
Li
ab and
Yanyan
Li
ab
aDepartment of Materials Science, School of Physical Science and Technology, Lanzhou University, Lanzhou, 730000, P. R. China. E-mail: wyh@lzu.edu.cn; Fax: +86 931 8913554; Tel: +86 931 8912772
bKey Laboratory for Special Function Materials and Structural Design of the Ministry of Education, Lanzhou University, Lanzhou 730000, China
First published on 13th November 2015
Abstract
A yellow emitting long-lasting phosphor based on a Ca6BaP4O17 matrix was successfully synthesized by means of solid state method in a reducing atmosphere. The persistent phosphor was characterized in detail by X-ray powder diffraction (XRD), photoluminescence (PL), persistent luminescence and decay curves as well as thermoluminescence (TL) spectra. When irradiated by ultraviolet light in advance, Ca6BaP4O17:0.02Eu2+,0.015Gd3+ phosphor shows a yellow persistent luminescence dominating at ∼553 nm at room temperature due to the 5d–4f transitions of Eu2+ ions and the chromaticity coordinate was calculated to be (0.431, 0.545), which is in the yellow region. Moreover, investigation of TL curves reveals that the incorporation of Gd3+ ion creates more appropriate energy traps and increases the density of intrinsic traps leading to the enhancement of afterglow. Consequently, the initial long lasting phosphorescence (LLP) intensity of Ca6BaP4O17:0.02Eu2+,0.015Gd3+ (0.21 cd m−2) is significantly enhanced by a factor of 2 compared with Ca6BaP4O17:0.02Eu2+,0.015Ho3+ and the sustained phosphorescence also can last approximately 19 h above the recognizable intensity level (0.32 mcd m−2). In order to study the trapping process and explain the mechanism of long afterglow, a schematic model is also proposed and discussed in detail.
1. Introduction
Long-lasting phosphorescence (LLP) phosphors are well-known as a kind of important optical functional materials which can absorb, store energy and then release visible or near-infrared light for several minutes or tens of hours even after the removal of the activated light source.1–3 This phenomenon is due to thermally stimulated recombination of charge carriers (electrons and/or holes) which are released slowly from electrons and hole traps at room temperature.4–7 LLP can be widely applied in various important fields including high-energy irradiation dosimeters, optical storage media, decoration, traffic signage, medical diagnostics, solar energy utilization, and bio-imaging all attributed to their outstanding properties such as energy saving, recycling and environmental protection.8–11In the middle of the 1990s, the first commercial application of persistent luminescence begun with ZnS:Cu,Co for marking watch dials.12 Nevertheless, the drawback of sensitivity to moisture hampered the utility of this phosphor. In 1996, Matsuzawa et al.13 discovered the green persistent phosphors of SrAl2O4:Eu2+,Dy3+. Since then, research on different afterglow materials has been extensively conducted and has brought efficient and stable afterglow phosphors emitting mainly in the blue-green spectral range. These phosphors still play a dominant role in visible light scope owing to extremely long-persistent times and strong emitting intensities. Unfortunately, the efficient long-wavelength LLP emission from yellow to red is lacking, e.g. Ca6BaP4O17:Eu,Ho (yellow, >47 h),14 Li2SrSiO4:Eu,Dy (orange-yellow, >15 h),15 Sr3SiO5:Eu,Dy (yellow, >6 h),16 and Ca2Si5N8:Eu,Tm (red, >1 h),17 Thus, we need explore new LLP phosphors to extend the family of this kind of light-storing materials. In recent years, many novel LLP phosphors based on different hosts have been reported and their possible mechanisms were discussed.18–23 But the step of developing new LLP materials with excellent performance is still slow because there is a lack of detail about the LLP mechanism. In fact, one of the researching focuses of the LLP material is how to fabricate the appropriate traps in the corresponding material and only the suitable host doped with the right activator could yield considerable phosphorescence.24
Phosphate compounds have excellent thermal stabilities and ionic charge stabilities in the lattice.25 Besides, the luminescence of Eu2+ activated phosphors usually results from the allowed electric dipole transition (4f7 to 4f65d1) and thus the efficient Eu2+ emission can be expected in a large number of hosts.26 On the other hand, the incorporation of Gd3+ could improve the luminescence of rare earth ions. Accordingly, Gd3+ acts as the sensitizer of Eu2+, Sm3+, Tb3+ and Dy3+ in many compounds.27–30 Recently, Naoyuki Komuro et al. discovered the phase of Ca6BaP4O17 with a monoclinic structure in space group C2/m and a large band gap (5.79 eV).31 In a previous work, we found that the incorporation of Ho3+ ion into the Ca6BaP4O17:Eu2+ system as an auxiliary activator can enhance its afterglow intensity and duration.14 In our present paper, it was found that codoping Gd3+ ion can significantly enhance initial LLP intensity (0.21 cd m−2) by a factor of 2 compared with Ca6BaP4O17:0.02Eu2+,0.015Ho3+ and the LLP also can last approximately 19 h. The luminescence and phosphorescence properties of Ca6BaP4O17:Eu2+,Gd3+ were systematically investigated by photoluminescence (PL) spectra, LLP emission spectra and decay curves and thermoluminescence (TL) glow curves. Also, the possible LLP mechanism of this phosphor was discussed in this paper.
2. Experimental
A series of persistent phosphors of Ca6BaP4O17:0.02Eu2+,xGd3+ (x = 0, 0.005, 0.01, 0.015, 0.02 and 0.025 which are denoted as samples S1–S6, respectively) were synthesized by the solid-state reaction technique using CaCO3 (A.R.), BaCO3 (99.99%), NH4H2PO4 (A.R.), Gd2O3 (99.99%) and Eu2O3 (99.99%) as starting materials. The required amounts of starting materials were homogeneously mixed and thoroughly ground in an agate mortar by adding an appropriate amount of ethanol, followed by further grinding for 30 min. Subsequently, the mixture was transferred into alumina crucibles and sintered at 1280 °C for 10 h in a weak reductive atmosphere (5%H2–95%N2 mixed flowing gas) in a tubular oven. After annealing, the samples were cooled to room temperature naturally and ground again to obtain final sample products in the form of fine powder.The phase and purity identification of the synthesized phosphor samples were investigated by a Rigaku D/Max-2400 X-ray diffractometer (XRD) using a Rigaku diffractometer with Ni filtered Cu Kα radiation at scanning steps of 0.02° in the 2θ range from 10° to 80°. The excitation and emission spectra were measured by a FLS-920T fluorescence spectrophotometer equipped with Xe 900 (450 W xenon arc lamp) as the excitation source and the scanning step was 1 nm. The decay curves were recorded using a PR305 long afterglow instrument after the samples were irradiated with ultraviolet light for 15 min. The TL curves were detected using a FJ-427A TL meter (Beijing Nuclear Instrument Factory) with a heating rate of 1 K s−1 in the temperature range from 20 to 400 °C. Prior to the TL measurements, about 0.0001 g samples pressed in pellets were exposed to radiation for 2 min by UV lights. All measurements except for the TL curves were carried out at room temperature.
3. Results and discussion
3.1. Phase identification and crystal structure analysis
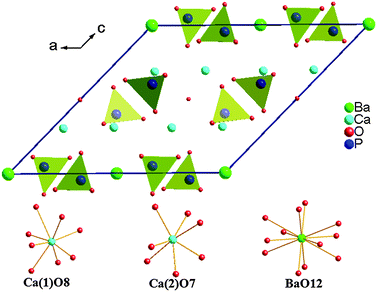
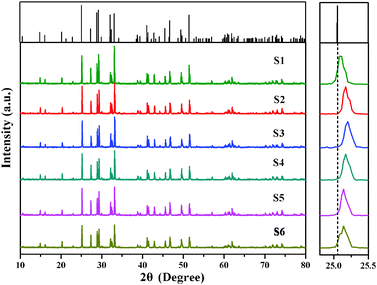
A novel persistent phosphor material of Ca6BaP4O17:Eu2+,Gd3+ was synthesized by a conventional solid-state method. The Ca6BaP4O17 sample was refined using the Maud refinement program by the Rietveld method.32,33 The value of the profile R factor (Rwp) = 10.68%, and the profile R factor (Rp) = 8.91%, indicating that the structural date are reliable. The crystal structure of Ca6BaP4O17 and the cationic sites made with Balls–Sticks are shown in Fig. 1. The Ca1 site is surrounded by eight oxygen atoms with an average bond length of 2.51 Å, and the Ca2 site by seven oxygen atoms with an average bond length of 2.42 Å, the Ba site is coordinated by twelve oxygen atoms with an average bond length of 3.04 Å. The ionic radii of Ba2+ is 1.61 Å for twelve coordinated ions, and the ionic radii of Ca2+ for seven and eight coordinated ions is 1.06 Å and 1.12 Å, respectively. Therefore, for the consideration of ionic radii matching, the doping Eu2+ (r = 1.20 Å, CN = 7; r = 1.25 Å, CN = 8) and Gd3+ (r = 1.20 Å, CN = 7; r = 1.25 Å, CN = 8) ions tend to substitute for the two different Ca2+ sites rather than the Ba2+ sites in the Ca6BaP4O17 matrix.Fig. 2 shows the XRD of Ca6BaP4O17:Eu2+,Gd3+ phosphors. The typical XRD patterns of samples (S1–S6) are in good agreement with refine results indicating that all samples are of a single phase. It can be clearly seen that no impurity peak was detected in the compositions, and results clearly suggest that the Eu2+ and Gd3+ ions are successfully incorporated in the host lattice without inducing significant changes in the crystal structure. Besides, all the peaks of Ca6BaP4O17:Eu2+,Gd3+ (S2–S6) slightly move to a higher 2θ value referring to the position of Ca6BaP4O17 and Ca6BaP4O17:Eu2+ (S1). This finding can be explained by the fact that Gd3+ ion with smaller ionic radii substitutes for Ca2+ leading to a decrease in the lattice constants of Ca6BaP4O17:Eu2+,Gd3+.
3.2. Photoluminescence and phosphorescence properties of Ca6BaP4O17:0.02Eu2+,xGd3+ (0 ≤ x ≤ 0.025)
Fig. 3 displays both the excitation and emission spectra of Ca6BaP4O17:Eu2+,Gd3+ samples. The monitored emission wavelength for the excitation spectra is 553 nm and the excitation spectra of the corresponding emission wavelength is 370 nm. Monitored at 370 nm, the emission spectra show an unresolved broad band predominating at 553 nm from 480 to 730 nm, which can be ascribed to the electric-dipole-allowed 4f65d1 → 4f7 transition of the Eu2+ ions. The Ca6BaP4O17:Eu2+,Gd3+ phosphors exhibit intense yellow luminescence. In addition, the typical emission of Gd3+ is not observed, indicating that Gd3+ ions are not serving as a luminescence center in Ca6BaP4O17:Eu2+,Gd3+ but may play the role of a trapping center. When the content of Gd3+ ions increased to 0.01 mol, their codoping markedly enhanced the PL intensity of the phosphor. It is noted that the PL intensity is reduced when the concentration of Gd3+ ions is 0.015 mol and then the PL intensity gradually increases until the concentration of Gd3+ ions reaches 0.025 mol. The unusual quenching concentrations may be related to the occupancy sequence of two Ca2+ sites for Eu2+ ions, the defects and lattice distortion by codoping different concentrations of Gd3+ ions.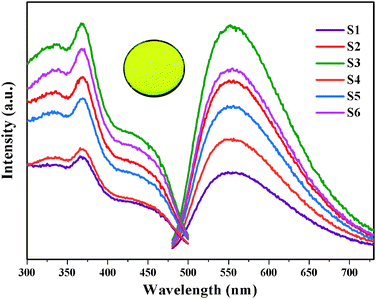 | ||
| Fig. 3 Emission (λex = 370 nm) and excitation (λem = 553 nm) spectra of Ca6BaP4O17:0.02Eu2+,xGd3+ (0 ≤ x ≤ 0.025); (inset) photograph of Ca6BaP4O17:0.02Eu2+,0.015Gd3+ under UV irradiation. | ||
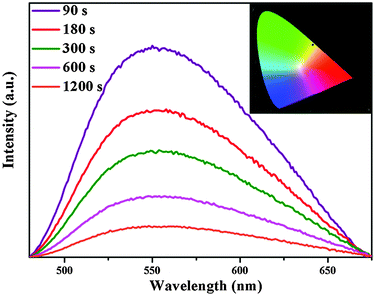
An interesting result of the present work is that we have observed yellow-emitting afterglow phosphorescence in Ca6BaP4O17:0.02Eu2+,xGd3+ (0 ≤ x ≤ 0.025) phosphors even after switching off the excitation source. Fig. 4 shows the phosphorescence spectra of the Ca6BaP4O17:0.02Eu2+,0.015Gd3+ sample after the excitation source is stopped at different periods of time (t = 90, 180, 300, 600, 1200 s). The phosphorescence spectra still reveal one broad band located at 553 nm, which is similar to its emission spectrum. In addition, the typical emission of Gd3+ is not observed. Therefore, it is justified to say that its phosphorescence also can be derived from Eu2+ in the above-mentioned two crystallographic Ca sites. Calculation from phosphorescence spectrum using chromaticity coordinate calculation method based on the CIE1931 (Commission International de I'Eclairage France) system reveals that the phosphorescence chromaticity coordinates of Ca6BaP4O17:0.02Eu2+,0.015Gd3+ are (0.431, 0.545) and the LLP color is yellow.
3.3. LLP decay curves of Ca6BaP4O17:0.02Eu2+,xGd3+ (0 ≤ x ≤ 0.025)
Fig. 5 depicts the LLP decay curves of the Ca6BaP4O17:Eu2+,Gd3+ phosphors recorded immediately after removing the UV irradiation source. It can be seen that all the LLP decay curves of codoped phosphors consist of a rapid decay process in the beginning dominating an intense LLP intensity and later a slow decay process responsible for longer afterglow duration. Whereas, the LLP decay curve of Ca6BaP4O17:0.02Eu2+ resembles a vertical line and the phosphorescence can be visible only for 1 h by naked eyes. Compared with other samples, the Ca6BaP4O17:0.02Eu2+,0.015Gd3+ phosphor obviously exhibits the best phosphorescence properties. Interestingly, the PL intensity of Ca6BaP4O17:0.02Eu2+,0.015Gd3+ phosphor is not the strongest compared with that of other reference samples. After the excitation source was switched off, the yellow phosphorescence of Ca6BaP4O17:0.02Eu2+,0.015Gd3+ was observed for 19 h by naked eyes and the initial intensity can reach about 0.21 cd m−2. Since the eye sensitivity is about 100 times better than 0.32 mcd m−2, we can in fact observe a much longer LLP in complete darkness.34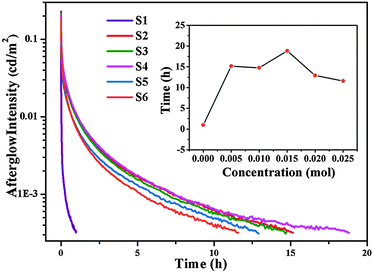 | ||
| Fig. 5 LLP decay curves of Ca6BaP4O17:0.02Eu2+,xGd3+ (0 ≤ x ≤ 0.025); (inset) the delay time as a function of the Gd3+ contents. | ||
3.4. Thermoluminescence characteristics
It is well known that trapping centers play a crucial role in photo-energy storage in persistent, photostimulated and thermo-stimulated phosphors.35,36 Generally speaking, the corresponding information about the trapping level can be obtained by TL measurements, the shallower the trap depth, the lower the temperature of the TL peak.37Fig. 6 presents the TL glow curves of Ca6BaP4O17:0.02Eu2+,xGd3+ (0 ≤ x ≤ 0.025). It can be seen that the TL glow curve of Ca6BaP4O17:0.02Eu2+ consists of three very weak peaks located at about 307 K, 343 K and 397 K. This result reveals that there are at least three types of traps with different depths in the Ca6BaP4O17:0.02Eu2+ material. According to Clabau et al.,37 Eu2+ can exist in an oxidized state Eu3+ so that the electron excited to a 5d orbital can potentially be trapped by anion vacancies. Therefore, the traps involved in LLP of the Ca6BaP4O17:0.02Eu2+ material could be due to oxygen vacancies or clusters which are created during the synthesis process at a high temperature and in a reducing atmosphere.38,39 Furthermore, the weak TL signal suggests that the concentration of carriers captured at the intrinsic traps is very low. However, we can see that there emerges a new peak at around 330 K and the TL intensity of P2 (343 K) and P3 (397 K) are greatly enhanced for the co-doped samples, which means that the doping of Gd3+ ions largely improves the trap levels and creates new traps in the samples of Ca6BaP4O17:Eu2+,Gd3+. Due to the nonequivalent substitution, an excess of positive charge in the host must be compensated. The only possible way to fulfill the charge compensation is that two Gd3+ ions replace three Ca2+ ions to balance the charge of the phosphor, which will form two positive defects and one
  negative defect. The positive defects could form electron-traps while negative defects act as hole-traps. Thus, the new traps can be caused by
  and
and  defects. The TL intensity of P1 (330 K) and P3 (397 K) peaks as a function of the Gd3+ contents are showed in the inset of Fig. 6. It is found that the TL intensity of two peaks increases simultaneously and then decreases when the Gd3+ contents is more than 0.015 mol due to the concentration quenching effect.40 Thus, taking the analyses of decay and TL properties into account together, it can be concluded that the Ca6BaP4O17:0.02Eu2+,0.015Gd3+ sample shows the best persistent luminescence performance.
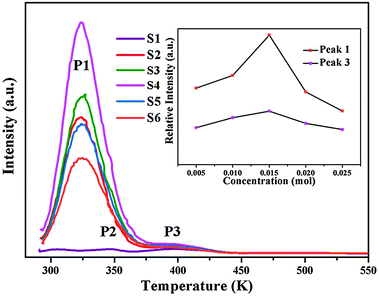 | ||
| Fig. 6 The TL glow curves of Ca6BaP4O17:0.02Eu2+,xGd3+ (0 ≤ x ≤ 0.025); (inset) the TL intensity of P1 (340 K) and P3 (382 K) peaks as a function of the Gd3+ contents. | ||
The fading of TL is due partly to the bleaching of the trapped carriers by thermal energy. The TL glow curves with different delay time after ceasing the UV irradiation may also provide important information on the trap distribution in materials.39 The effective TL peak is situated slightly above room temperature (320–400 K), which is a temperature leading to better LLP properties.41,42 So, in our present work, the TL peaks at 330 K (P1), 343 K (P2) and 397 K (P3) account for the LLP in room temperature. As shown in Fig. 7, the TL intensity of P1 (330 K) due to the shallow traps decreases very quickly and approximately has disappeared after 30 minutes because that the charge carriers escape from shallower traps much faster than that in deep ones. At the same time, it is found that the deep traps at 343 K (P2) and 397 K (P3) play a major role and their TL intensities relatively decrease slowly with time as showed in the inset of Fig. 7. This result indicates that the shallow traps corresponding to the P1 (340 K) peak should mainly be responsible for an intense LLP intensity and a rapid decay process in the beginning, while the deep traps at 343 K (P2) and 397 K (P3) lead to darker initial phosphorescence and longer afterglow duration of the Ca6BaP4O17:0.02Eu2+,0.015Gd3+ material.
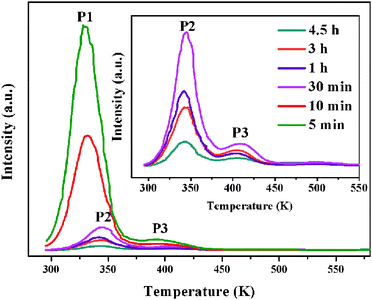 | ||
| Fig. 7 The TL glow curves of Ca6BaP4O17:0.02Eu2+,0.015Gd3+ sample after UV irradiation for 2 min and then delaying for a different period of time. | ||
3.5. Afterglow mechanism
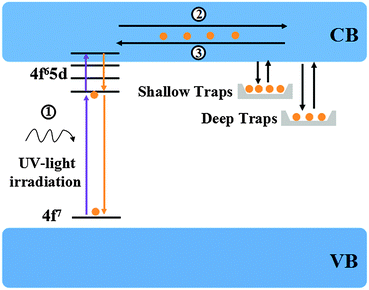
Based on the above results, a simple model of Ca6BaP4O17:Eu2+,Gd3+ LLP mechanism is proposed and illustrated in Fig. 8. Under ultraviolet-light excitation, the ground-state electrons of Eu2+ ions are promoted to the 5d electron state (process 1), which is partly overlapped with the conduction band. The excited electrons are subsequently captured by both shallow electron traps (P1) and deep electron trap oxygen vacancies or clusters (P2 and P3) through the conduction band (process 2) and thus the excitation energy is efficiently stored. After a sufficient illumination time, all of the appropriate traps are filled. Subsequently, the electrons are released from traps in the temperature order under the action of thermal activation at an appropriate temperature and then transferred to the emission centers (process 3), followed by the recombination and finally resulting in the LLP.
4. Conclusions
By introducing Gd3+ ions into Eu2+ doped calcium barium phosphate Ca6BaP4O17, we first obtain a novel LLP phosphor Ca6BaP4O17: Eu2+,Gd3+ by the conventional solid state method. When the contents of Gd3+ ions increased to 0.015 mol, its codoping markedly enhanced the PL and phosphorescence intensity. After the UV light excitation source was switched off, the bright yellow LLP was observed in Ca6BaP4O17: Eu2+,Gd3+ phosphor and the LLP can last near 19 h at a recognizable intensity level. The analysis of TL glow curves reveals that the shallow traps (330 K) are mainly responsible for an intense LLP intensity and a rapid decay process, while the deep traps (343 K and 397 K) lead to darker initial phosphorescence and longer afterglow duration of the Ca6BaP4O17:0.02Eu2+,0.015Gd3+ material.Acknowledgements
This work was supported by a Specialized Research Fund for the Doctoral Program of Higher Education (No. 20120211130003) 35 and the National Natural Science Funds of China (Grant no. 51372105).Notes and references
- K. Van den Eeckhout, P. F. Smet and D. Poelman, Materials, 2010, 3, 2536–2566 CrossRef CAS.
- K. Van den Eeckhout, D. Poelman and P. F. Smet, Materials, 2013, 6, 2789–2818 CrossRef CAS.
- H. F. Brito, J. Holsa, T. Laamanen, M. Lastusaari, M. Malkamaki and L. C. V. Rodrigues, Opt. Mater. Express, 2012, 2, 371–381 CrossRef CAS.
- L. C. V. Rodrigues, H. F. Brito, J. Hölsä and M. Lastusaari, Opt. Mater. Express, 2012, 2, 382–390 CrossRef CAS.
- Z. W. Pan, Y. Y. Lu and F. Liu, Nat. Mater., 2012, 11, 58–63 CrossRef CAS PubMed.
- Y. H. Jin, Y. H. Hu, L. Chen, X. J. Wang and G. F. Ju, Opt. Mater., 2013, 35, 1378–1384 CrossRef CAS.
- D. Liu, C. Cui, P. Huang, L. Wang and G. W. Jiang, J. Alloys Compd., 2014, 583, 530–534 CrossRef CAS.
- M. Kowatari, D. Koyama, Y. Satoh, K. Iinuma and S. Uchida, Nucl. Instrum. Methods Phys. Res., Sect. A, 2002, 480, 431–439 CrossRef.
- C. N. Xu, T. Watanabe, M. Akiyama and X. G. Zheng, Appl. Phys. Lett., 1999, 74, 2414–2416 CrossRef CAS.
- S. X. Lian, Y. Qi, C. Y. Rong, L. P. Yu, A. L. Zhu, D. L. Yin and S. B. Liu, J. Phys. Chem. C, 2010, 114, 7196–7204 CAS.
- C. N. Xu, X. G. Zheng, M. Akiyama, K. Nonaka and T. Watanabe, Appl. Phys. Lett., 2000, 76, 179–181 CrossRef.
- W. Hoogenstraaten and H. A. Klasens, J. Electrochem. Soc., 1953, 100, 366–375 CrossRef CAS.
- T. Matsuzawa, Y. Aoki, N. Takeuchi and Y. Murayama, J. Electrochem. Soc., 1996, 143, 2670–2673 CrossRef CAS.
- H. J. Guo, W. B. Chen, W. Zeng, G. Li, Y. H. Wang, Y. Y. Li, Y. Li and X. Ding, J. Mater. Chem. C, 2015, 3, 5844–5850 RSC.
- S. Cheng, X. H. Xu, J. Han, J. B. Qiu and B. H. Zhang, Powder Technol., 2015, 276, 129–133 CrossRef CAS.
- X. Y. Sun, J. H. Zhang, X. Zhang, Y. S. Luo and X. J. Wang, J. Phys. D: Appl. Phys., 2008, 41, 195414 CrossRef.
- V. K. Van den Eeckhout, P. F. Smet and D. Poelman, J. Lumin., 2009, 129, 1140–1143 CrossRef.
- J. Wang, S. B. Wang and Q. Su, J. Solid State Chem., 2004, 177, 895–900 CrossRef CAS.
- L. Y. Liu, C. Y. Li, S. B. Wang and Q. Su, Appl. Phys. Lett., 2006, 88, 241107 CrossRef.
- N. Kodama, T. Takahashi, M. Yamaga, Y. Tanii, J. Qiu and K. Hirao, Appl. Phys. Lett., 1999, 75, 1715 CrossRef CAS.
- C. Guo, Q. Tang, D. Huang, C. Zhang and Q. Su, J. Phys. Chem. Solids, 2007, 68, 217–223 CrossRef CAS.
- Y. Cong, B. Li, B. Lei and W. Li, J. Lumin., 2007, 126, 822–826 CrossRef CAS.
- B. F. Lei, B. Li, X. J. Wang and W. L. Li, J. Lumin., 2006, 118, 173–178 CrossRef CAS.
- R. Pang, C. Y. Li, S. Zhang and Q. Su, Mater. Chem. Phys., 2009, 113, 215–218 CrossRef CAS.
- Y. S. Tang, S. F. Hu, C. C. Lin, N. C. Bagkar and R. S. Liu, Appl. Phys. Lett., 2007, 90, 108–151 Search PubMed.
- X. Zhao, Z. S. Li, T. Yu and Z. G. Zou, RSC Adv., 2013, 3, 1965–1969 RSC.
- J. Shmulovich, G. W. Berkstresser, C. D. Brandle and A. Valentino, J. Electrochem. Soc., 1988, 135, 3141–3151 CrossRef CAS.
- R. T. Wegh, H. Donker, K. Oskam and A. Meijerink, Science, 1999, 283, 663–666 CrossRef CAS PubMed.
- H. Su, Z. Jia, C. Shi, J. Xin and S. A. Reid, Chem. Mater., 2001, 13, 3969–3974 CrossRef CAS.
- Y. Sato, T. Kumagai, S. Okamoto, H. Yamamoto and T. Kunimoto, Jpn. J. Appl. Phys., 2004, 43, 3456 CrossRef CAS.
- N. Komuro, M. Mikami, Y. Shimomura, E. G. Bithell and A. K. Cheetham, J. Mater. Chem. C, 2014, 2, 6084–6089 RSC.
- H. Rietveld, Acta Crystallogr., 1967, 22, 151–152 CrossRef CAS.
- H. Rietveld, J. Appl. Crystallogr., 1969, 2, 65–71 CrossRef CAS.
- C. Q. Wu, J. C. Zhang, P. F. Feng, Y. M. Duan, Z. Y. Zhang and Y. H. Wang, J. Lumin., 2014, 147, 229–234 CrossRef CAS.
- H. Yamamoto, Y. Mita, T. Ide and T. Katase, J. Lumin., 1999, 72, 959–960 Search PubMed.
- D. Jia, W. Jia, D. R. Evans, W. M. Dennis, H. Liu, J. Zhu and W. M. Yen, J. Appl. Phys., 2000, 88, 3402–3404 CrossRef CAS.
- S. W. S. McKeever and R. Chen, Radiat. Meas., 1997, 27, 625–628 CrossRef CAS.
- F. Clabau, X. Rocquefelte, T. L. Mercier, P. Deniard, S. Jobic and M. H. Whangbo, Chem. Mater., 2006, 18, 3212–3220 CrossRef CAS.
- J. C. Zhang, M. H. Yu, Q. S. Qin, H. L. Zhou, M. J. Zhou, X. H. Xu and Y. H. Wang, J. Appl. Phys., 2010, 108, 123518 CrossRef.
- J. C. Zhang, R. Hu, Q. S. Qin, D. Wang, B. T. Liu, Y. Wen, M. J. Zhou and Y. H. Wang, J. Lumin., 2012, 132, 2590 CrossRef.
- X. Sun, J. Zhang, X. Zhang, Y. Luo and X. J. Wang, J. Phys. D: Appl. Phys., 2008, 41, 195414 CrossRef.
- Y. Liu, B. Lei and C. Shi, Chem. Mater., 2004, 17, 2108–2113 CrossRef.
| This journal is © The Royal Society of Chemistry and the Centre National de la Recherche Scientifique 2016 |

